- 1NORCE Norwegian Research Centre AS, Kristiansand, Norway
- 2Department of Applied Mathematics, University of Santiago de Compostela, Santiago de Compostela, Spain
- 3PoreLab, Department of Physics, Norwegian University of Science and Technology, Trondheim, Norway
The ability to navigate safely and efficiently through a given landscape is relevant for any intelligent moving object. Examples range from robotic science and traffic analysis, to the behavior within an ecosystem. Many objects tend to move in patterns depending on their nature. By establishing models of patterns of motion one may estimate the future motion within an area. We propose here a method for detecting regular patterns of motion by modeling the environment as an energy landscape, and locating optimal paths through it. As an example, we use maritime position Automatic Identification System (AIS) data as input to work out optimal routes between different start and end points when these are not located along the standard shipping lanes. These initial tests show that the method has potential for analyzing and determining regular patterns of motion.
1 Introduction
Imagine a large town square. The square has fixed structures such as fountains etc. that block direct pathways across it. It is a busy place where many pass across it in all directions. Cameras have been set up that record the motion of people across the town square. The question we will address in this paper is the following: Based on the recordings, is it possible to predict the motion of a single person from some start point A to some end point B across the town square, even when the points A and B are not located along the typical paths that people use across the square. This question has since long been posed in different contexts [1]. Examples range from the behavior of ecosystems to robotic navigation and traffic systems. A predator needs to account for the future motion of its prey in order to catch it, just as a ship needs to consider the future positions of other ships to avoid collisions [2].
Moving objects are influenced by both the landscape in which they move, as well as other objects, moving or not, within the same area [3–5]. There are several different ways to approach motion prediction. The most straight forward approach is to predict the motion of each object in a system individually, by assigning to each object a position as a function of time [6]. However, for large systems, this method would produce a large number of coupled equations. Hence, this approach would be unproductive in this case. A better approach is to exploit the fact that objects tend to move in patterns [3, 7]. Depending on their nature and surroundings, moving objects tend to move in regular patterns. By establishing a model of these motion-patterns in a given area, one may use the pattern itself when predicting future motion. This is the core idea of our approach.
When applying methods of pattern recognition to motion prediction, the process typically operates in two stages. The first stage is the actual pattern recognizing, which learns the regular patterns of motion using a set of training data. The next stage applies the learned pattern to predict the future motion. Further, this two-stage process may be grouped into two main groups of techniques; Grid-based techniques and cluster-based techniques [3].
The grid-based techniques are derived from the occupancy grid concept [8]. That is, the landscape is modeled as a grid and transition probabilities between the cells are calculated from the training data. The grid is then used directly for motion prediction. Grid-based techniques are frequently used in robot navigation systems [9–11].
Cluster-based techniques on the other hand, apply statistical decision tools in order to group similar trajectories into representative clusters. Several different clustering techniques exists, the Expectation-Maximization approach [12] is considered to be the state of the art [3]. Future motion of a moving object is then estimated as the representative cluster which the given route is most likely to belong to.
In this paper, we propose a dynamic grid-based technique for learning motion patterns by mapping it onto the optimal paths in a disordered landscape problem [13, 14]. We describe this problem as follows. Imagine a plane and that
The optimal path is found by the minimization
This problem has produced a large body of work within the statistical physics community. It is also closely related to the optimal path problem which is central in a large number of applications and fields [15–18].
The central idea we present in this paper is to relate the function
We apply this idea to vessel traffic, using marine automatic identification system coordinates. We transform the coordinates to a dimensionless area and introduce a grid over the area. We associate each grid point with the local density of AIS coordinates. We implement the optimal paths through the area using the iterative algorithm of Hansen and Kertész [19, 21], but any other algorithms may be used, e.g., the Bellman-Ford or the Dijkstra algorithms [22–24].
We emphasize that we are not attempting here to present a fully implementable algorithm ready to be used on ships. Rather, this is a feasibility study testing whether the central ideas may work.
We note that optimal paths have been used earlier in connection with marine motion prediction [20]. However, the paths in this case are optimized with respect to length. This is a very different concept than what we present here.
We organize this paper as follows. Section 2 describes the method we propose. In Section 3, we implement the method for marine AIS data. We end by a brief summary and discussion.
2 Algorithm
We now describe how we transform the AIS coordinates, given in terms of continuous longitude and latitude, into grid points. We then go on to describe the concept of optimal paths in this context and the algorithm used to extract it. Lastly, we describe how we turn this into path prediction.
2.1 From Automatic Identification System Coordinates to Grid
The automatic tracking system AIS uses tranceivers to allow ships to view surrounding marine traffic and to be seen themselves. It provides, among other services, a record of the position as a function of time for the equipped vessels passing through the area. This includes most large vessels.
We define our area of interest as the rectangle defined by the corners given by the longitudinal and latitudinal coordinates
and
The position of a given ship at a given time k at
We define the weights
The path density may then be defined as
when K is the number of position recordings within the grid cell.
We now associate a weight with node
where α is an adjustable parameter controlling the magnitude of the fluctuations of
The last step in setting up the system is to assign weights to the links between neighboring nodes. Let the node
We also allow for diagonal paths. The link between node
where the factor
2.2 Optimal Path Construction
We define a path
The optimal path is then
We will in the following assume that both nodes A and B lie on the edges of the grid. In order to identify the optimal path, we use the algorithm of Hansen and Kertész [19]. It consists of two main steps; first an initialization and then an updating process. A variable
After M iterations, the variable
Consider now a node
We now choose another boundary node
We may now combine the optimal paths starting at boundary node
Associating each internal node
2.3 Predicting Paths
We now focus our attention on pathscapes where boundary nodes
Suppose the optimal path
where β is an adjustable parameter. The constant
3 Analysis of Two Automatic Identification System Patterns
We denote the two AIS sets we consider in the following A and B. Figures 1, 2 show the two areas and the subsets that we use in our analysis. Both subsets, shown in Figures 1B, 2B, have size 100 × 100 and where each grid block has size 100 × 100 m2 (area A) and 1000 × 1000 m2 (area B). We see that A has a simpler structure than B, consisting of two vertical clusters, while B includes multiple clusters with different orientation. By “cluster” we mean an area with high density of position recordings.
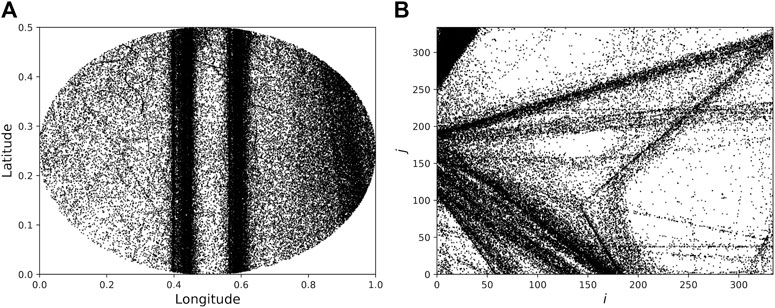
FIGURE 1. (A) Data set A showing AIS position recordings with positions in degrees relative to the origin. (B) A selected subset of area A spanning
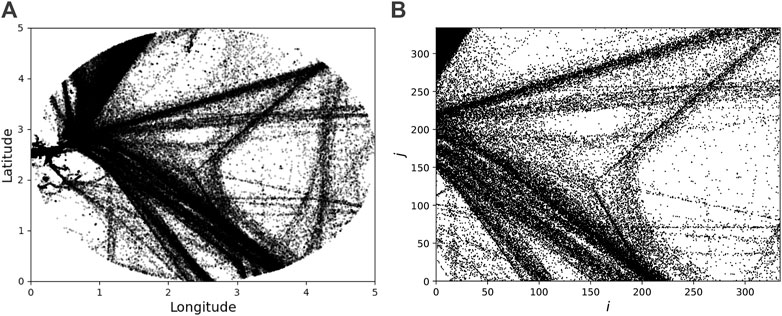
FIGURE 2. (A) Data set B showing AIS position recordings with positions in degrees relative to the origin. (B) A selected subset of area B spanning
We now consider area A. Setting parameter
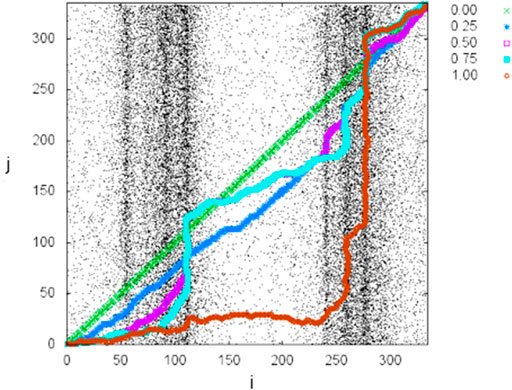
FIGURE 3. Optimal paths between the lower left and upper right corner of the grid in Figure 1B for
We show in Figure 4 the length of the optimal path between the lower left and upper right corner in Figure 3 for different values of α and with
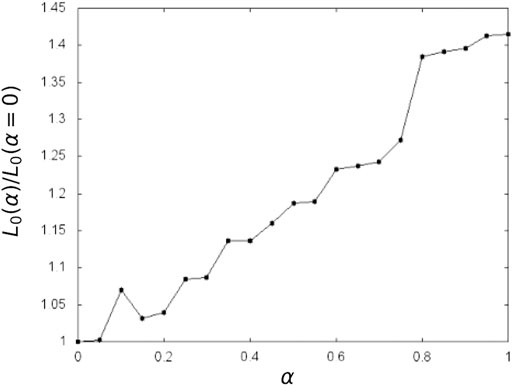
FIGURE 4. The length of the optimal paths,
Turning to area B, we show in Figure 5 the optimal paths starting from the lower left corner and ending at the upper right corner of the grid shown in Figure 2B as a fuction of α while keeping
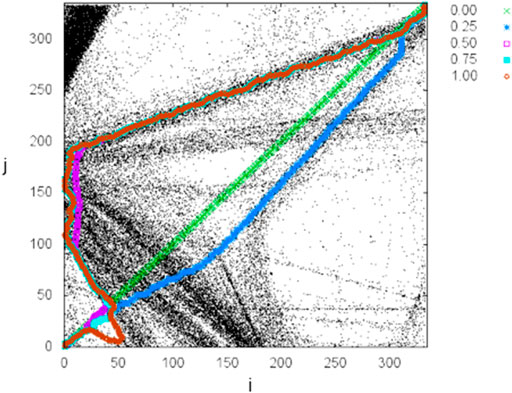
FIGURE 5. Optimal paths between the lower left and upper right corner of the grid in Figure 2B for
We show in Figure 6 the length of the optimal path between the lower left and upper right corner in Figure 5 for different values of α and
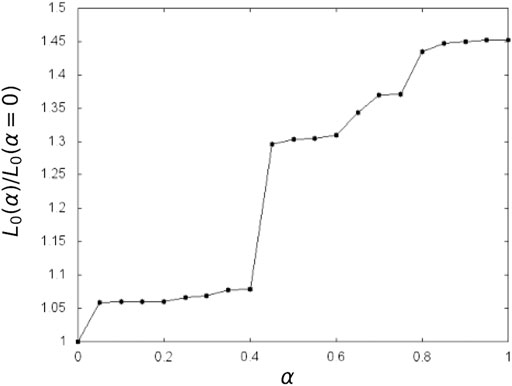
FIGURE 6. The length of the optimal paths,
We now introduce intervals
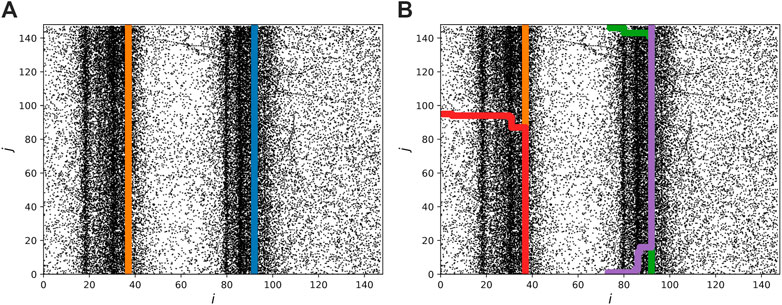
FIGURE 7. Area A: (A) The two most optimal paths between the intervals along different edges. (B) The five most optimal paths between different edges. Each edge has been divided into two intervals, and fixing
Figure 8 shows the ordered sequence of weights
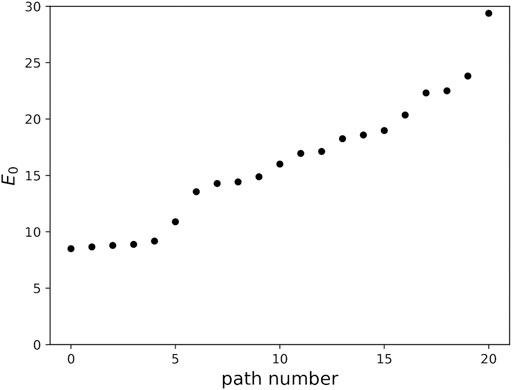
FIGURE 8. The weight
We do the same construction as in Figure 7 for area B in Figure 9. We divide the edges into three intervals and choose the values
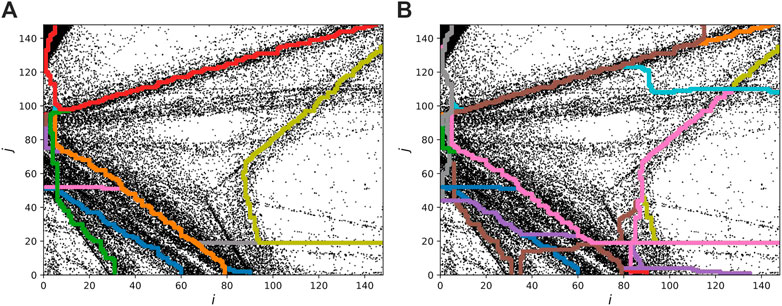
FIGURE 9. Area B: Here the grid has been divided into three segments along each edge. In (A) we show the 24 most optimal paths and in (B) we show the 48 most optimal paths. We fixed the parameter values to
Figure 10 shows the ascending sequence of renormalized weights
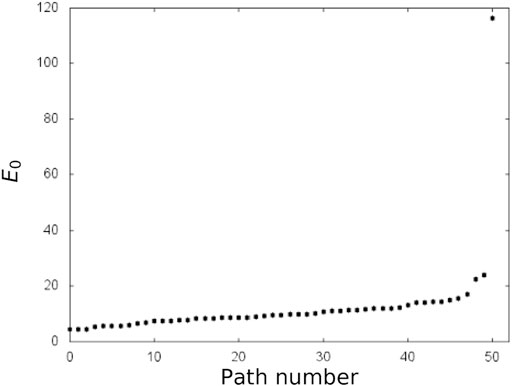
FIGURE 10. The weight
Figure 9 shows the same area as in Figure 5. We have here divided the edges into three intervals. The weight of the 50 most optimal paths is shown if Figure 10. As in the much simpler pucture in Figure 7, there is also in this case considerable overlap between the optimal paths.
4 Discussion and Conclusion
We have in this paper introduced a method to predict motion in an area based on earlier motion in the same region. That is, given the history of traffic in the area, what would be the most likely path a new traveler would take between positions A and B, even if these positions are outside the usual routes of travel in the area. The method is based on the concept of optimal paths through a landscape formed by the paths taken earlier. It is a dynamic method as each new trajectory taken in the area is added to the history.
We have tested the method on marine Automatic Identification System (AIS) data. From a visual point of view, the method locates the motion patterns efficiently in both the simple case we studied (A) and in the more complex traffic picture (B). However, a proper performance test has not been performed. Further, the results showed that sectioning the edges into only a few intervals, were enough to generate a good estimate of the pattern. As all the grid nodes along the edges, may be represented by only a few intervals, with a short running time of the algorithm. The grid dimension and size of the cells does not seem to influence the results that are found.
This work shows that the method we propose manages to identify sensible paths that optimize between path length and frequency of use—two seemingly very different quantities. In order to turn this into a practical method, much more work is needed, e.g. with respect to the cluster identification, grid construction, type of vessel (if it is to be implemented as a marine tool).
Data Availability Statement
The original contributions presented in the study are included in the article/Supplementary Material, further inquiries can be directed to the corresponding author.
Author Contributions
MF did the numerical work based on an idea by AH. MF write the first draft of the manuscript. AH wrote the second version.
Funding
This work was partly supported by the Research Council of Norway through its Centers of Excellence funding scheme, project number 262644.
Conflict of Interest
The authors declare that the research was conducted in the absence of any commercial or financial relationships that could be construed as a potential conflict of interest.
References
1. Hirakawa T, Yamashita T, Tamaki T, Fujiyoshi H, Umezu Y, Takeuchi I, et al. Can AI Predict Animal Movements? Filling Gaps in Animal Trajectories Using Inverse Reinforcement Learning. Ecosphere (2018) 9:e02447. doi:10.1002/ecs2.2447
2. Pallotta G, Vespe M, Bryan K. Vessel Pattern Knowledge Discovery from AIS Data: A Framework for Anomaly Detection and Route Prediction. Entropy (2013) 15:2218–45. doi:10.3390/e15062218
3. Vasquez D, Fraichard T. Motion Prediction for Moving Objects: A Statistical Approach. Proc ICRA’04, IEEE (2004) 4:3931–6. doi:10.1109/ROBOT.2004.1308883
4. Martinez J, Black MJ, Romero J. On Human Motion Prediction Using Recurrent Neural Networks. In: Proceedings of the IEEE Conference on Computer Vision and Pattern Recognition (2017). p. 2891–900.
5. González D, Pérez J, Milanés V, Nashashibi F. A Review of Motion Planning Techniques for Automated Vehicles. IEEE Trans Intell Transport Syst (2016) 17:1135–45. doi:10.1109/TITS.2015.2498841
6. Zhu Q. A Stochastic Algorithm for Obstacle Motion Prediction in Visual Guidance of Robot Motion. In: IEEE International Conference on Systems EngineeringIEEE (1990). doi:10.1109/ICSYSE.1990.203136
7. Weiming Hu W, Xuejuan Xiao X, Zhouyu Fu Z, Xie D, Tieniu Tan T, Maybank S. A System for Learning Statistical Motion Patterns. IEEE Trans Pattern Anal Mach Intell (2006) 28:1450–64. doi:10.1109/TPAMI.2006.176
8. Elfes A. Using Occupancy Grids for mobile Robot Perception and Navigation. Computer (1989) 22:46–57. doi:10.1109/2.30720
9. Tadokoro S, Hayashi M, Manabe Y, Nakami Y, Takamori T. Motion Planner of mobile Robots Which Avoid Moving Human Obstacles on the Basis of Stochastic Prediction. Intell Syst 21st Century (1995) 4:3286–91. doi:10.1109/ICSMC.1995.538292
10. Kruse E, Gutsche R, Wahl FM. Estimation of Collision Probabilities in Dynamic Environments for Path Planning with Minimum Collision Probability. In: Proceedings of IEEE/RSJ International Conference on Intelligent Robots and Systems. IROS’96, 3 (1996). p. 1288–95. doi:10.1109/IROS.1996.568983
11. Tanaka K. Detecting Collision-free Paths by Observing Walking People. In: IEEE/RSJ International Conference on Intelligent Robots and Systems, 1 (2002). p. 55–60. doi:10.1109/IRDS.2002.1041362
12. Bennewitz M, Burgard W, Thrun S. Learning Motion Patterns of Persons for mobile Service Robots. In: Proceedings 2002 IEEE International Conference on Robotics and Automation (Cat. No. 02CH37292), 4 (2002). p. 3601–6. doi:10.1109/ROBOT.2002.1014268
13. Halpin-Healy T, Zhang Y-C. Kinetic Roughening Phenomena, Stochastic Growth, Directed Polymers and All that. Aspects of Multidisciplinary Statistical Mechanics. Phys Rep (1995) 254:215–414. doi:10.1016/0370-1573(94)00087-J
14. Alava M, Duxbury P, Moukarzel C, Rieger H. Combinatorial Optimization and Disordered Systems. In: C Domb, and JL Lebowitz, editors. Phase Transitions and Critical Phenomena, Vol. 18. Amsterdam: Elsevier (2000).
15. Alur R, La Torre S, Pappas GJ. Optimal Paths in Weighted Timed Automata. In: International Workshop on Hybrid Systems: Computation and Control, 49–62. Berlin: Springer (2001). p. 49–62. doi:10.1007/3-540-45351-2_8
16. Xia Q. Optimal Paths Related to Transport Problems. Commun Contemp Math (2003) 05:251–79. doi:10.1142/S021919970300094X
17. Gendreau M, Ghiani G, Guerriero E. Time-dependent Routing Problems: A Review. Comput Operations Res (2015) 64:189–97. doi:10.1016/j.cor.2015.06.001
18. Yu J, LaValle SM. Planning Optimal Paths for Multiple Robots on Graphs. In: IEEE International Conference on Robotics and Automation (2013). p. 3612–7. doi:10.1109/ICRA.2013.6631084
19. Hansen A, Kertész J. Phase Diagram of Optimal Paths. Phys Rev Lett (2004) 93:040601. doi:10.1103/PhysRevLett.93.040601
20. Soleimani BH, De Souza EN, Hilliard C, Matwin S. Anomaly Detection in Maritime Data Based on Geometrical Analysis of Trajectories. In: 18th International Conference on Information Fusion (Fusion) (2015). p. 1100–5.
21. Talon L, Auradou H, Pessel M, Hansen A. Geometry of Optimal Path Hierarchies. EPL (2013) 103:30003. doi:10.1209/0295-5075/103/30003
Keywords: optimal paths, machine learning, motion prediction, energy landscape, Dijkstra algorithm
Citation: Fromreide M and Hansen A (2021) Predicting Motion Patterns Using Optimal Paths. Front. Phys. 9:656296. doi: 10.3389/fphy.2021.656296
Received: 20 January 2021; Accepted: 02 June 2021;
Published: 21 June 2021.
Edited by:
Antonio F. Miguel, University of Evora, PortugalReviewed by:
Gyei-Kark Park, Mokpo National Maritime University, South KoreaMathias Anneken, Fraunhofer-Institut für Optronik, Systemtechnik und Bildauswertung (IOSB), Germany
Copyright © 2021 Fromreide and Hansen. This is an open-access article distributed under the terms of the Creative Commons Attribution License (CC BY). The use, distribution or reproduction in other forums is permitted, provided the original author(s) and the copyright owner(s) are credited and that the original publication in this journal is cited, in accordance with accepted academic practice. No use, distribution or reproduction is permitted which does not comply with these terms.
*Correspondence: Alex Hansen, YWxleC5oYW5zZW5AbnRudS5ubw==
 Mads Fromreide
 Alex Hansen