 Li Wang
 Hu Zhang
 Wei Li
 Jiaxuan Li4
95% of researchers rate our articles as excellent or good
Learn more about the work of our research integrity team to safeguard the quality of each article we publish.
Find out more
ORIGINAL RESEARCH article
Front. Phys. , 16 March 2021
Sec. Optics and Photonics
Volume 9 - 2021 | https://doi.org/10.3389/fphy.2021.655547
This article is part of the Research Topic Physical Model and Applications of High-Efficiency Electro-Optical Conversion Devices View all 24 articles
As a new display technology, electrowetting display (EWD) has many excellent display characteristics, such as paper-like, low power consumption, quick response and full color. These characteristics make EWD devices very suitable for portable devices. However, the gray-scale distortion caused by the contact angle hysteresis of EWDs seriously affects the accuracy of gray-scale display. To improve this phenomenon, the hysteresis curve of an EWD panel was studied according to the motion characteristics of advancing contact angle and receding contact angle of oil in a pixel. Then, a driving scheme for EWDs using alternating current (AC) voltage instead of direct current (DC) voltage was proposed in this paper. And the advantages and disadvantages of the driving scheme at different AC frequencies from 90 to 2,700 Hz were analyzed through experiments. According to the stability of aperture ratio in EWDs, a 470 Hz AC driving scheme was determined. Experimental results showed that the aperture ratio distortion of EWDs could be reduced from 35.82 to 5.97%, which significantly improved the display performance of pixel units.
Electrowetting display (EWD) is a new type of electronic paper display technology with excellent display characteristics: (a) reflective display, paper-like reading experience [1]; (b) response speed of several milliseconds which can meet the needs of video playback [2]; (c) paper-like reflective display mode, with low power consumption [3]; (d) high reflectivity and true color display can be implemented [4]; (e) pixel structure can be attached to flexible backplanes [5]; (f) high degree of overlap with the existing liquid crystal display (LCD) manufacturing process, which means a low manufacturing cost [6]. These advantages make EWD technology to be known as the most promising next-generation paper-like display technology.
The EWD technology was first proposed by Beni and Hackwood [7]. In 2003, Hayes proposed a fast display EWD scheme, which could realize a simple video playback function [8]. However, when EWDs were driven, the phenomenon of contact angle hysteresis would occur, which had a bad effect on the gray-scale display performance of pixels in EWDs [9, 10]. The linear inconsistency of advancing contact angle and receding contact angle increased the complexity for controlling gray-scales [11]. In the process of pixel gray-scales display, it is difficult to control the gray-scale accurately, and gray-scale distortion may be caused. Therefore, it is necessary to analyze the influence of contact angle hysteresis and study how to optimize the contact angle hysteresis in EWDs.
Many scholars have studied the hysteresis phenomenon of EWDs. An AC voltage driving scheme was proposed by studying the balance among the surface tension of oil wetting, pinning force and electrostatic force on the contact line. It was proved that the hysteresis of the contact angle of a moving droplet could be reduced during a wetting process [12]. However, researchers did not further explore parameters of the AC voltage. Then, according to pixel characteristics, two driving methods of using hydrophilic patches or adding steps for pixels were proposed to enhance the motion control of oil and realize a hysteresis-free gray-scale conversion of pixels [13]. However, the transparent electrode of the pixel could be blocked by hydrophilic patches and the increased steps, which could reduce the reflectivity of a pixel. And then, a driving waveform with an optimized voltage slope was proposed, this method can improve the aperture ratio and reduce the hysteresis of pixels [14]. Although the PWM (pulse width modulation) could compensate for the hysteresis to a certain extent, it means an increase of response time, a decrease of effective frames, and an increase of power consumption [15]. At the same time, the PWM can only be used in fully opened and completely closed for driving a pixel, and the display ability of EWDs is limited by this feature.
In this paper, the influence of contact angle hysteresis on the gray-scale was analyzed when the driving voltage was turned on and off, and an AC voltage driving scheme was proposed, the influence of contact angle hysteresis on display performance could be significantly reduced by the proposed AC driving scheme compared with the traditional DC voltage driving scheme.
Wettability is great significance for EWDs. Wettability describes the relationship between the contact angle and the surface tension of droplets. The surface tension can be expressed by equation (1), γLG is a liquid-gas surface tension, f is the frequency of the surface wave, λ is the wavelength of the surface wave, ρ is the density of droplets. The relationship between contact angle and surface tension can be expressed by equation (2) [16], θ0 is a static contact angle, γSG is a solid-gas surface tension and γSL is a solid-liquid surface tension.
Lippmann-Young equation was first proposed by Gabriel Lippmann in 1898, and it is regarded as the theoretical foundation of electrowetting. This equation describes the changing process of the contact angle of droplets on the solid surface with an applied voltage. As shown in equation (3) [17]:
Where, θ is the contact angle when driving voltage is V, ε0 is the vacuum dielectric constant, εr is the relative dielectric constant, d is the thickness of a hydrophobic insulation layer, γeo is the interface tension between oil and electrolyte solution, and V is the driving voltage. As shown in Figure 1, The other two interfacial tensions are γso and γse, γso is the interfacial tension between the hydrophobic insulation layer and oil. γse is the interfacial tension between the hydrophobic insulation layer and electrolyte solution. When the driving voltage is 0V, the non-polar oil is laid on the hydrophobic insulation layer, and the contact angle is small, close to zero.
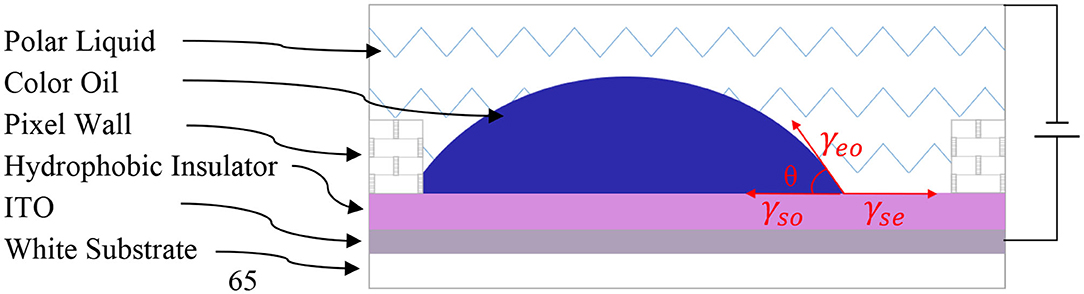
Figure 1. The structure of an EWD pixel. The colored oil was pushed to a corner of the pixel by driving voltage. The pixel would display the color of oil and part of the white substrate.
EWD is an optical switch for realizing gray-scale display by controlling the movement of colored oil by applying voltage. In practical application, the display is realized by an optical stack. It consists of a white substrate, a hydrophobic insulation layer, colored oil, water and an ITO (indium tin oxide) glass. When the voltage is turned off, the force among the colored oil, the hydrophobic insulation layer and the water is balanced. At this time, γeo > γso, and contact angle θ < 90. The colored oil is laid between the water and the hydrophobic insulation, which can show a hydrophilicity and become a continuous spreading film. And we could see the color of oil, as shown in Figure 2A, the state is in the lowest energy state at this time.
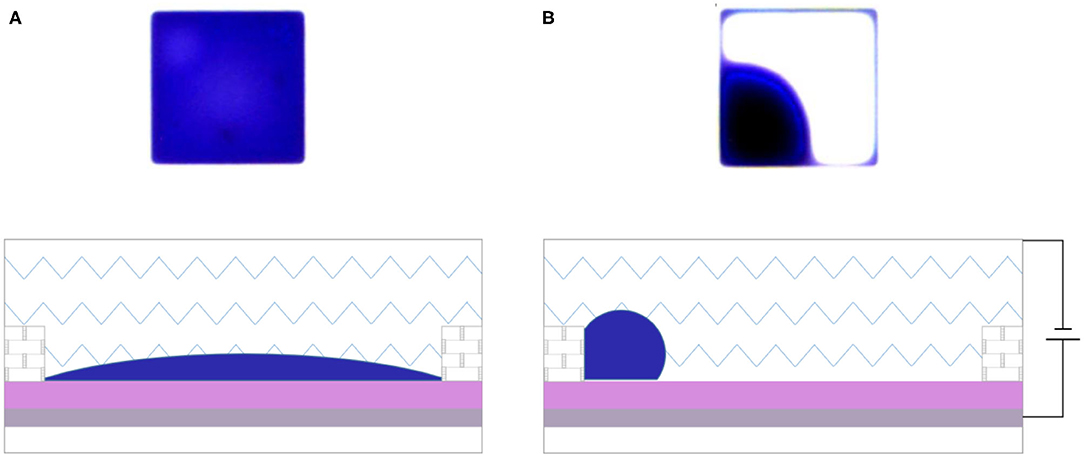
Figure 2. Display principle of an EWD pixel. (A) When the pixel was turned off, the whole pixel was covered by oil, the color of oil was reflected. (B) When the pixel was turned on, the oil was pushed into a corner of the pixel, the color of substrate was reflected.
Next, the voltage is connected to the upper and lower plates of ITO. As shown in Figure 2B, according to Lippmann-Young equation, with the increase of electric field, the surface tension among insulation layer, oil film and water can be increased, and the indirect antennae of the interface become larger. The original balance can be broken by the electric field force generated by the voltage difference. Water instead of the oil to contact with the hydrophobic insulation layer surface. At this time, γeo < γso, and contact angle θ > 90. The oil is pushed to a corner of pixels, so pixels show color of the white substate. The colored oil shows hydrophobicity.
In an EWD driving process, as the driving voltage increases from 0V to the maximum voltage Vm, the oil in the pixel is gradually gathered. When the driving voltage reaches the maximum value, the oil can be completely pushed to a corner. In this process, the higher the voltage, the larger the contact angle. The process of increasing voltage is the advancing process, and the contact angle is also called as advancing angle. On the contrary, the process of reducing the voltage from Vm to 0V is called as receding process, and the contact angle at this time is also called as the receding angle. With a same driving voltage value, the difference between the advancing angle and the receding angle is the contact angle hysteresis in EWDs.
The aperture ratio is a proportion of the exposed white substrate area in a whole pixel. The different aperture ratio represents different optical states. The surface area of oil can be expressed as equation (4), and the aperture ratio can be defined as equation (5) [18].
Where, WA(V) is the aperture ratio, Soil represents the surface area of oil when voltage V is applied to EWDs. Spix is the surface area of a whole pixel, and Boil is the volume of the oil. The pixel wall can divide an EWD into several pixels. This transparent grid structure has a small area which can be ignored in calculating the aperture ratio.
In order to measure the display state of pixels, a complete experimental platform was built. As shown in Figure 3, the experimental equipment mainly includes: (a) is a GDS-3354 oscilloscope (Shanghai GuWei Electronics Co., Ltd, Shanghai, China); (b) is an AFG3052C function generator, produced by Tektronix (United States); (c) is an ATA-2022H amplifier, produced by Agitek (Xi'an, China); (d) is a XTL-165 microscope, produced by Phenix (Jiangxi, China), and (e) is a computer. The experimental process was described as follows: First, the required waveform was edited by the computer. Second, the voltage sequence of the waveform was generated by the waveform generator, and the voltage was amplified by the amplifier. Then the output voltage of the amplifier was applied to an EWD panel. Finally, the video stream was captured by the high-speed camera combined with the microscope and displayed on another computer. The aperture ratio was calculated by a software.
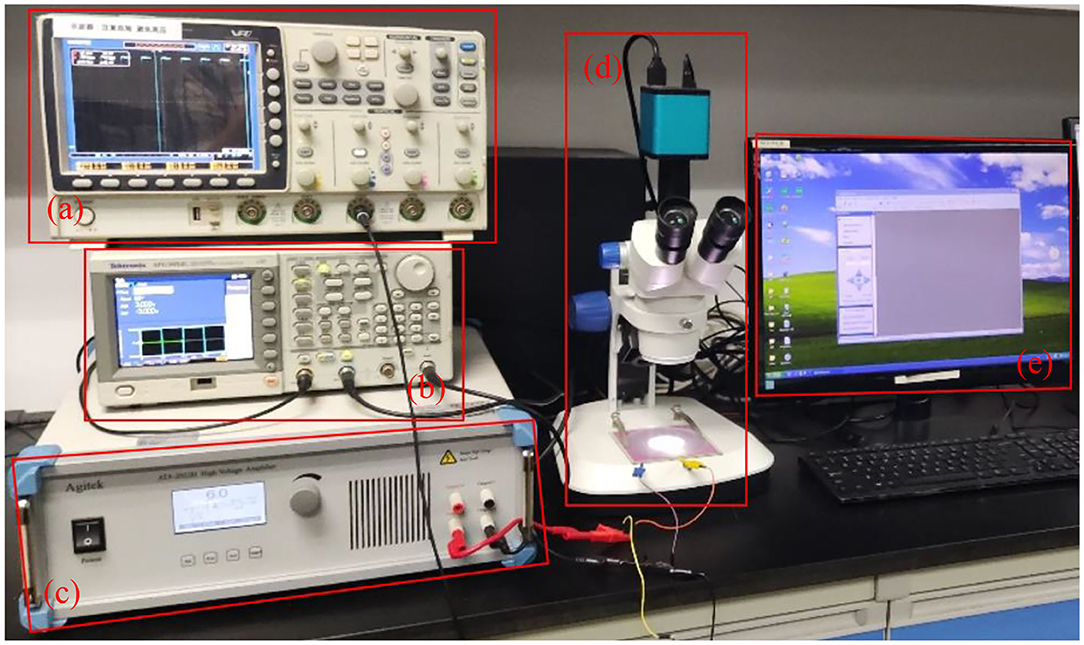
Figure 3. Experimental platform for the testing of EWD contact angle hysteresis. It was composed of driving system and testing system. (a) Oscilloscope. (b) Function generator. (c) Amplifier. (d) Microscope. (e) Computer.
The materials of an EWD panel used in the experiment are as follows. The material of hydrophobic insulating layer was Teflon AF1600, and the solution was a fluorocarbon solvent FC-43 of 3M Company in United States. Transparent polyimide was used as the grid material of pixel walls. Photoresist was SU-83005 which came from Microchem. The ITO glass substrate came from Shenzhen Laibao High-Tech Co., Ltd, with a thickness of 0.7 mm and an impedance of 100 Ω/cm2. The electrolyte solution was sodium chloride solution with a concentration of 1 × 10⁻⁴ mol/L, deionized water was obtained by an ultra-pure ultraviolet water purification system. And the parameters of the EWD panel were listed in Table 1.
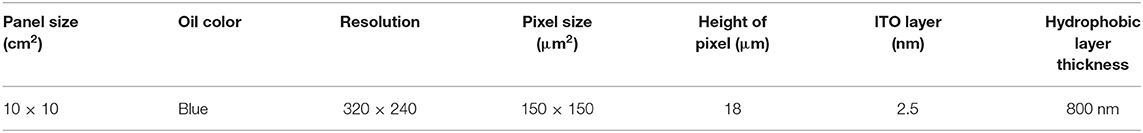
Table 1. Parameters of the EWD panel.
During the driving process of EWDs, the period that the driving voltage increases from 0V to the maximum voltage and then decreases from the maximum voltage to 0V is called a driving period T. In 0-T/2, the driving voltage can be gradually increased, and the pixel oil gradually shrinks from the flat state to a corner in a pixel. In the process from T/2 to T, the oil state should be completely opposite to the first half cycle. In this case, the oil could be controlled more precisely and achieve a multiple gray-scale display.
However, the state of oil is different from an ideal situation. Two identical EWD panels were used to test the impact of contact angle hysteresis. The driving voltage was increased from 0 to 20V and decreased from 30 to 20V respectively. When starting voltages were different, the gray-scale obtained was different with a same target driving voltage. As shown in Figure 4, when the driving voltage was increased from 0 to 20V, the pixel aperture ratio was 24.85%; when the driving voltage was decreased from 30 to 20V, the pixel aperture ratio was 40.12%. The maximum difference of the aperture ratio was 15.27%. During the process of driving voltage increased from 0 to 20V, the electric field force increased, and the oil was pushed to achieve a balance state. During the process of driving voltage decreased from 30 to 20V, the electric field force decreased, and the oil spread naturally due to the wetting effect. Due to the coarseness of hydrophobic insulation layer and the existence of charge trapping, the rising and falling process was asymmetric. This phenomenon is called hysteresis effect, and also can be called gray-scale distortion. The smaller the difference, the smaller the gray-scale distortion. This gray-scale distortion phenomenon was caused by contact angle hysteresis.
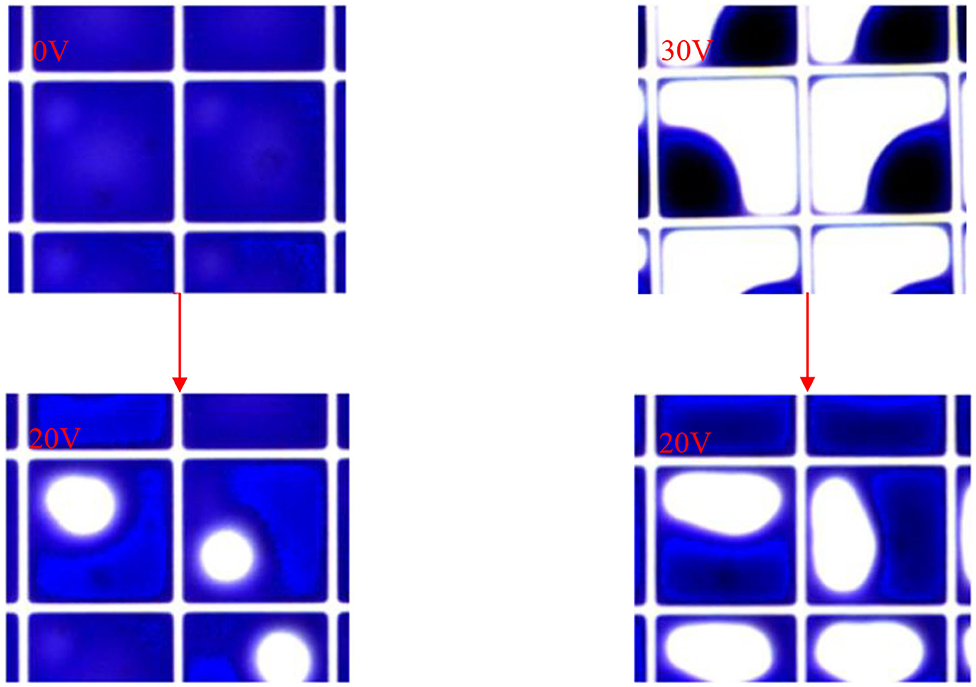
Figure 4. Inconsistent performance of aperture ratio in a pixel. The driving voltage was increased from 0 to 20V and decreased from 30 to 20V, respectively, the aperture ratio was different at 20V.
In order to study the effect of contact angle hysteresis on aperture ratio of EWDs, some experiments were designed in this paper. The traditional square wave was selected to drive an EWD panel, and 60 Hz was determined as the default driving frequency [3]. As shown in Figure 5, they are square waves in DC driving scheme and AC driving scheme, respectively. The relationship between driving voltage and aperture ratio in DC driving scheme and AC driving scheme were tested. During experiments, the overall trend of the pixel aperture ratio was increasing with the increasing of driving voltage. When the driving voltage was decreased, the aperture ratio was decreased, and finally returned to a flat state. When the voltage was increased from 0 to 30V, the oil state was in the forward process. When the voltage was decreased from 30 to 0V, the oil state was in the backward process. When the driving voltage was higher than 30V, the pixel could be broken down.
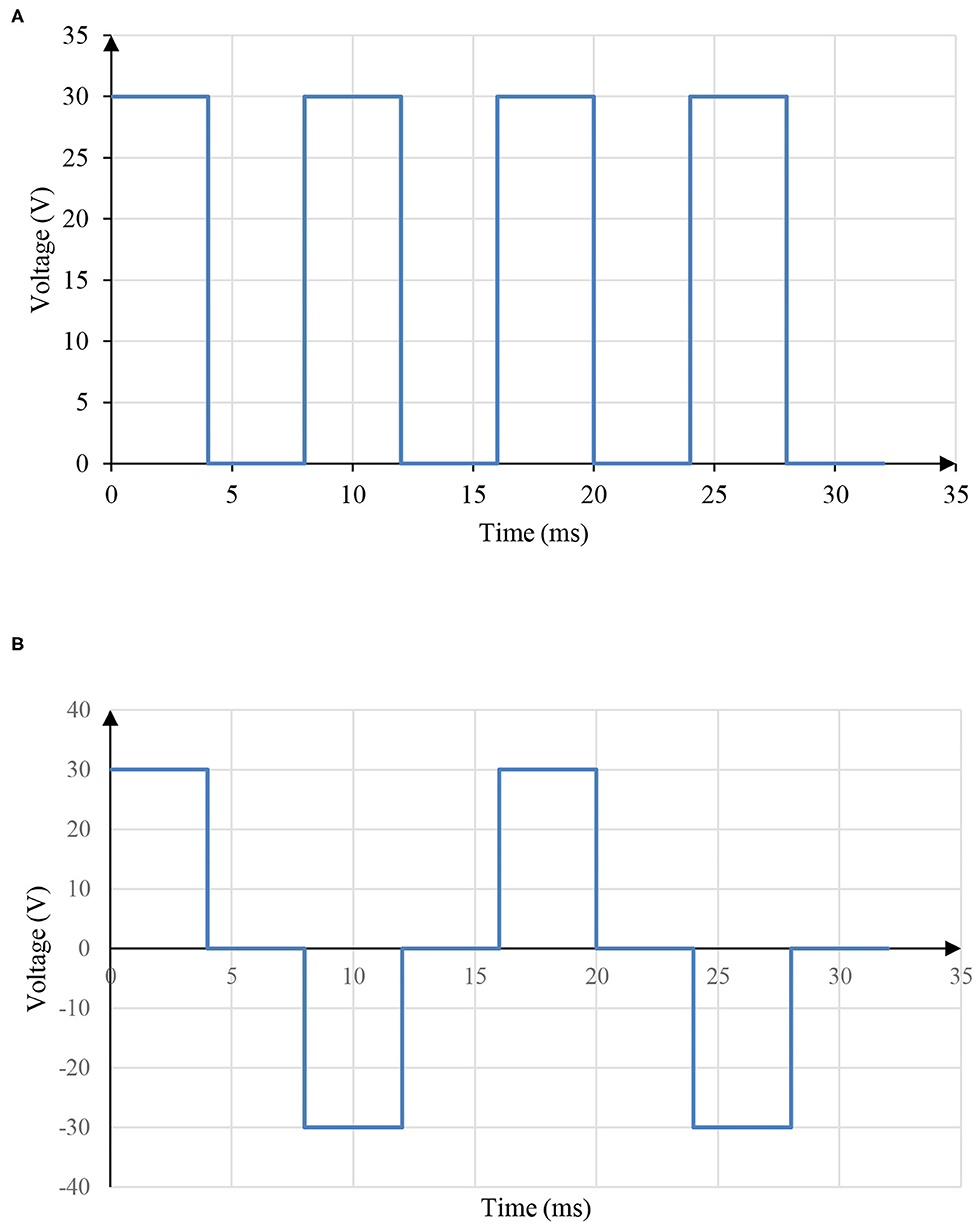
Figure 5. Square waves in DC driving scheme and AC driving scheme. (A) The square wave in DC driving scheme. (B) The square wave in AC driving scheme.
The test results are shown in Figure 6. Figure 6A shows the result of square wave in DC driving scheme, the range of aperture ratio was 1–61.48%. At both ends of the driving voltage value, the distortion of the aperture ratio was small. When the driving voltage was in the middle stage, the rate of the aperture ratio distortion was bigger. Among these situations, when the driving voltage was 16V, the maximum distortion could reach to 35.82%. During an entire EWD process, the scale distortion interval of gray-scale was 0–35.82%. Figure 6B shows the result of square wave in AC driving scheme, the range of aperture ratio was 1–58.71%. At both ends of the driving voltage value, the distortion of the aperture ratio was small. When the driving voltage was in the middle stage, the rate of the aperture ratio distortion was bigger. Among these situations, when the driving voltage was 13V, the maximum distortion could reach to 20.84%. During an entire EWD process, the scale distortion interval of gray-scale was 0–20.84%. It can be seen that the contact angle hysteresis of AC driving scheme is lower than that of DC driving scheme.
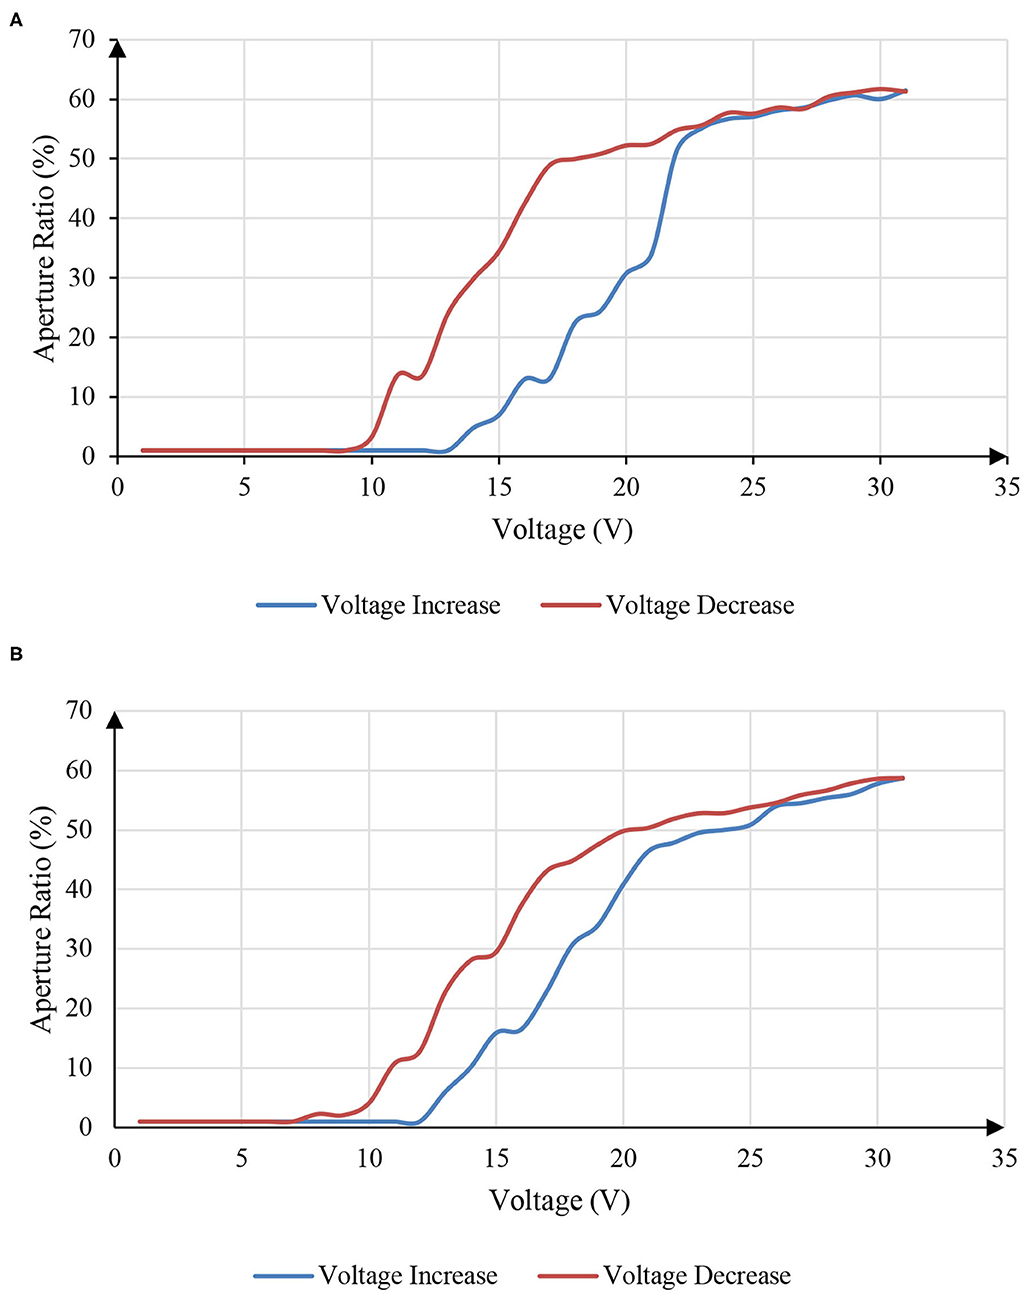
Figure 6. Hysteresis curves of an EWD driven by DC driving scheme and AC driving scheme. The black curve showed the aperture ratio when driving voltage was increased from 0 to 30V, and the red curve showed the aperture ratio when driving voltage was decreased from 30 to 0V. (A) The hysteresis curve of an EWD driven by DC driving scheme. (B) The hysteresis curve of an EWD driven by AC driving scheme.
In order to determine the optimal driving frequency, more experiments were designed. The maximum voltage in AC driving scheme used in this paper was 30V. And AC voltages with frequency of 90–2,700 Hz were applied to EWD panels. Then the average value of aperture ratio was recorded, simulated and calculated by a microscope.
As shown in Figure 7, when the frequency was from 90 to 350 Hz, the oil in pixels was unstable, and pixels were opened for a short time and closed in an instant. In addition, the unstable state of oil in the pixel led to an oil splitting. Although the driving voltage was remained unchanged, the aperture ratio of the pixel was decreased gradually with the passage of time, and the stability of the aperture ratio was insufficient.
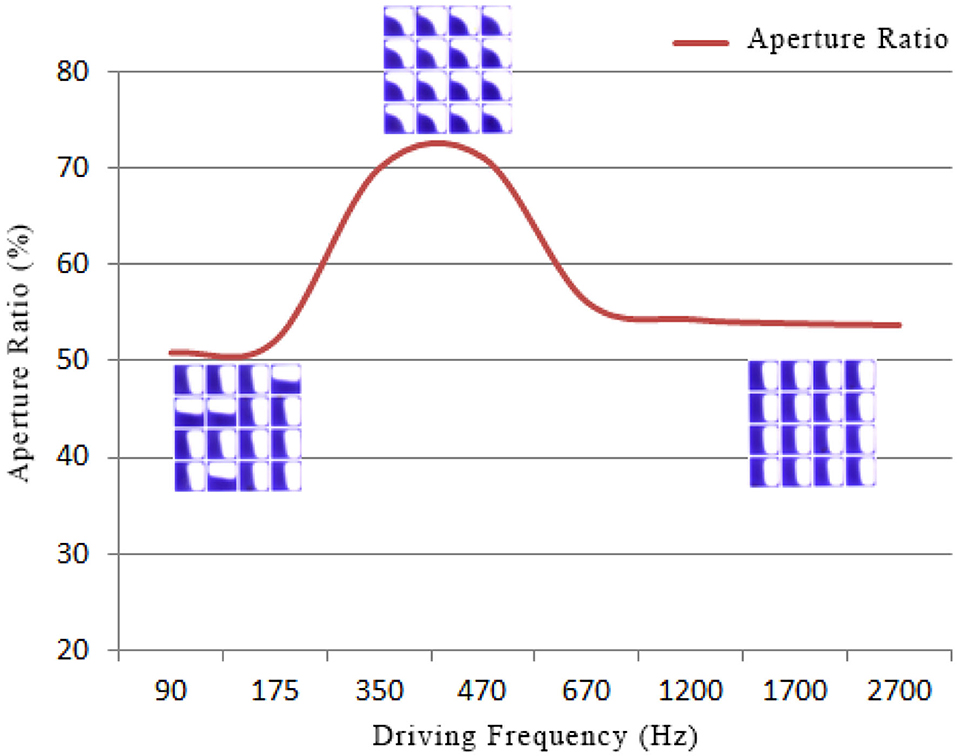
Figure 7. The EWD was driven by a 30V AC driving voltage, the aperture ratio changed when the frequency was increased from 90 to 2,700 Hz. When the frequency was 350–500 Hz, pixels were fully opened.
When the frequency was 350–500 Hz. The oil in pixels was stable, pixels were fully opened, the aperture ratio was 70.96%, and pixels were hardly closed within 12 s. When the frequency was 500–1,200 Hz, some pixels were fully opened, and others were not fully opened. The oil state was not stable enough. The overall aperture ratio of pixels varied from 62.10 to 56.33%. When the frequency was 1,200–2,700 Hz, the oil state in pixels was stable, but pixels were not fully opened, and the aperture ratio was stable at about 51.89%. At the same time, when the driving voltage was unchanged, the oil state had almost no change by time, and the aperture ratio was remained stable. When the driving voltage frequency was higher than 2,700 Hz, as the frequency was changed, the aperture ratio was remained at about 50.73%. Therefore, when the frequency was higher than 2,700 Hz, the influence of driving voltage and frequency on aperture ratio was very small.
In the process of an AC voltage driving with a constant frequency, the oil movement path became more stable over time. We tested the stability of the aperture ratio within 12 s when the frequency was 90, 175, 350, 470, 670, 1,200, 1,700, and 2,700 Hz. As shown in Figure 8.
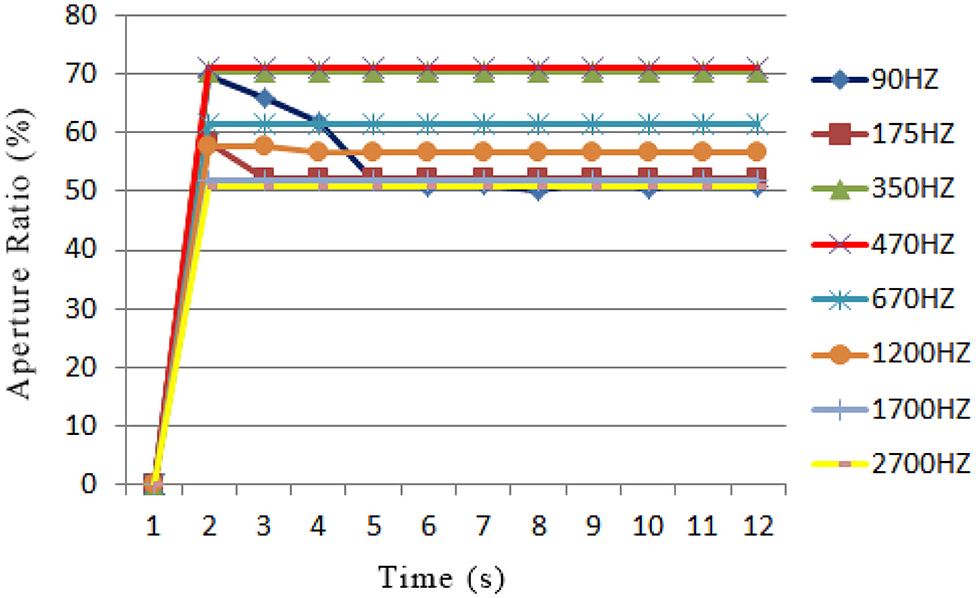
Figure 8. The relationship between time and aperture ratio when an EWD was driven by a 30V AC driving voltage at different frequencies. The smoothness of curves represented the oil stability. The 470 Hz AC driving voltage had the largest aperture ratio and most stable aperture ratio.
It can be seen from Figure 8 that the aperture ratio reached the maximum with frequency of 90 Hz. But the oil was gradually spread out from the fully contracted state within 2 s. After 5 s, the aperture ratio was decreased from about 69.76% to 50.77%. In addition, during the oil shrinking process, the oil state was unstable and split. At the same time, the oil in pixels was driven randomly to four corners, and it could affect the display brightness of pixels. Compared with the frequency of 90 Hz, the oil was more stable under the frequency of 175 Hz. But within 1 s, aperture ratio was decreased from 58.38 to 52.11%. Then the aperture ratio was remained stable. When the frequency was higher than 350 Hz, the stability of aperture ratio was significantly improved. When the frequency was 350 and 470 Hz, the oil in pixels was completely contracted and remained stable within 12 s. When the frequency was 670 Hz, the aperture ratio was 61.33%, and pixels were not fully opened. At this time, the aperture ratio was stable. When the frequency was 1,200, 1,700, and 2,700 Hz, the aperture ratio and the oil state were stable, but pixels were not fully opened. Therefore, the 470 Hz AC driving voltage was selected in our driving scheme for EWDs.
The generation process of the 470 Hz AC driving voltage was as follows, the waveform generator can generate 470 Hz AC driving voltage with the maximum voltage difference of 10V. Therefore, the AC voltage was varied from +5 to −5V. Then the output of waveform generator was amplified 6 times by a high voltage amplifier, so that the AC driving voltage can be changed from +30 to −30V. During the AC driving process, the average value of the aperture ratio was calculated.
As shown in Figure 9, the red curve indicated that the driving voltage was increased from 10 to 25V and the blue curve indicated that the driving voltage was decreased from 25 to 10V. When the voltage was > 25V or < 10V, these two curves were coincident. In process (B), when the driving voltage was increased or decreased, the aperture ratio was basically the same, and the maximum difference between them was 3%. In process (A), when the difference of aperture ratio was the largest, the EWD is shown in the Figure 10. Figure 10A showed the aperture ratio of EWDs during the driving voltage increasing process, the average aperture ratio was 26.50%; Figure 10B showed the aperture ratio of EWDs during the driving voltage decreasing process, the average aperture ratio was 32.47%. Therefore, the maximum difference between them is 5.97%. When the traditional DC voltage was used, the maximum distortion was 35.82%. Although the distortion could not be completely eliminated, the aperture ratio distortion could be reduced by 29.85% with the AC driving scheme.
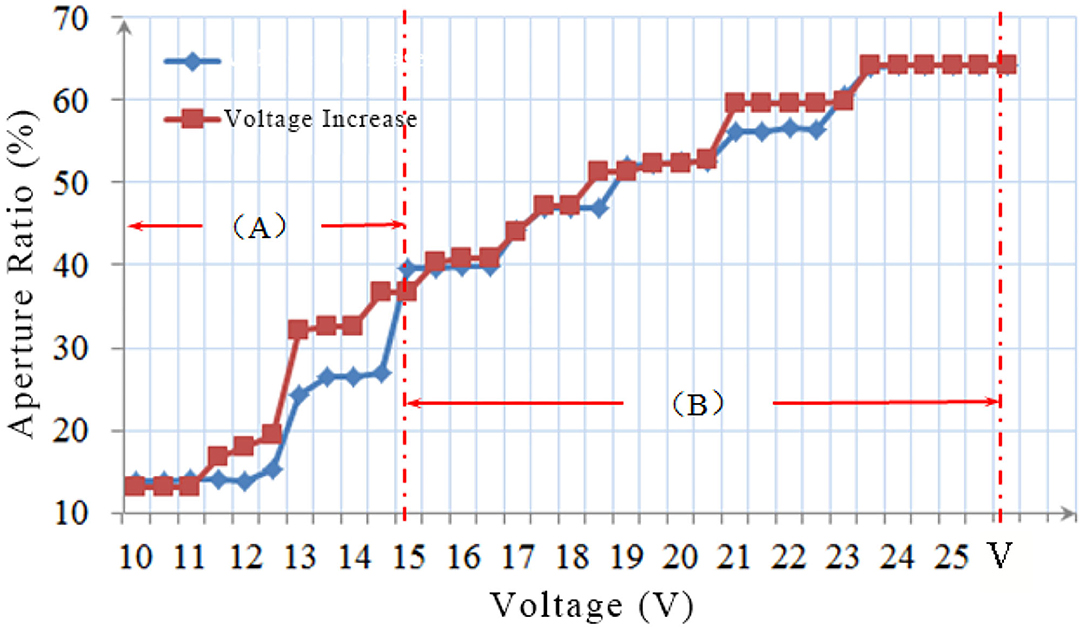
Figure 9. Hysteresis characteristic curves of an EWD driven by a 470 Hz AC driving voltage. The red curve represented the aperture ratio when the driving voltage was increased from 10 to 25V, the blue curve represented the aperture ratio when the driving voltage was decreased from 25 to 10V. The maximum distortion is 5.97%. (A) Indicates the state where the difference of aperture ratio changes greatly, (B) indicates the stage where the difference of aperture ratio changes little.
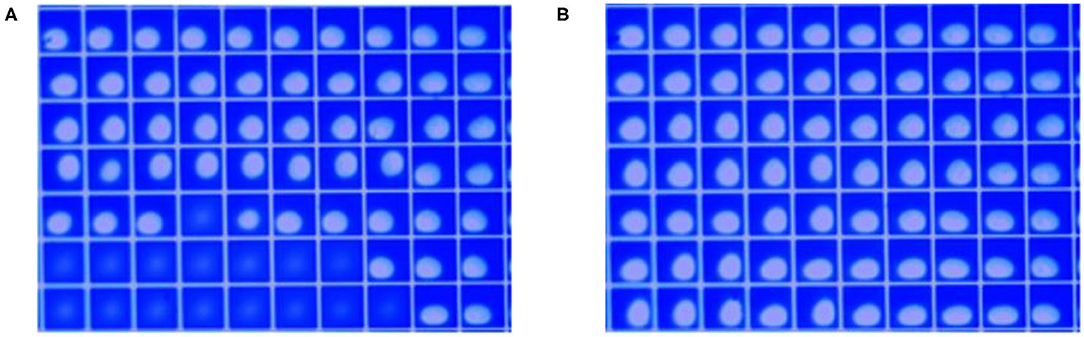
Figure 10. The aperture ratio of pixels when the EWD was driven by 470 Hz AC driving voltage. (A) The pixel aperture ratio was 26.50% during the voltage increasing process. (B) The pixel aperture ratio was 32.47% during the voltage decreasing process. The maximum difference was 5.97%.
In order to reduce the distortion of aperture ratio and achieve precise control of gray-scales, an AC driving scheme was proposed for improving the performance of EWDs. This scheme can effectively reduce the influence of contact angle hysteresis. The advantages and disadvantages of AC driving voltages at different frequencies were analyzed by experiments. And then, according to the stability and aperture ratio of EWDs, a 470 Hz AC driving scheme was determined. Compared with traditional DC driving scheme, the aperture ratio distortion caused by contact angle hysteresis could be reduced to 5.97%. Therefore, this scheme could be applied to EWDs system to achieve more accurate control for displaying gray-scales.
The raw data supporting the conclusions of this article will be made available by the authors, without undue reservation.
LW and WL designed this project. LW and HZ carried out most of the experiments and data analysis. JL and ZY carried out a few of the experiments and data analysis. WL, HZ, WL, JL, ZY, QW, JZ, and PM gave suggestions on the project management and conducted helpful discussion on the experimental results. All authors contributed to the article and approved the submitted version.
This research was supported by the Special Projects in Key Fields of Colleges and Universities of Guangdong in 2020 (No. 2020ZDZX3083), the Second Batch of Social Welfare and Basic Research Key Projects of Zhongshan (No. 2020B2021), the School Level Project of Zhongshan Polytechnic (No. 2018KQ22), the Key Technology Development of High Frequency Antenna Substrate Based on 5G Communication (No. 2020ZDZX2081), Key Project of Provincial Education Department, the Key Technology Research and Development of High Frequency Substrate Based on 5G Communication (No. KYA2002), and Key Scientific Research Project of the University.
The authors declare that the research was conducted in the absence of any commercial or financial relationships that could be construed as a potential conflict of interest.
1. Heikenfeld J, Drzaic P, Yeo J S, Koch T. Review paper: a critical review of the present and future prospects for electronic paper. J Soc Inform Display. (2011) 19:129–56. doi: 10.1889/JSID19.2.129
2. Mingyong Q, Shanling L, Suyun Z, Zhixian L, Tailiang G, Biao T. Real-time dynamic driving system implementation of electrowetting display. Opto-Electronic Eng. (2019) 46:180623. doi: 10.12086/oee.2019.180623
3. Li W, Wang L, Zhang T, Lai S, Liu L, He W, et al. Driving waveform design with rising gradient and sawtooth wave of electrowetting displays for ultra-low power consumption. Micromachines. (2020) 11:145. doi: 10.3390/mi11020145
4. Heikenfeld J, Zhou K, Kreit E, Raj B, Yang S, Sun B, et al. Electrofluidic displays using young–laplace transposition of brilliant pigment dispersions. Nat Photo. (2009) 3:292–6. doi: 10.1038/nphoton.2009.68
5. Tröls A, Enser H, Jakoby B. Modeling and fabrication of low-cost electrowetting actuators for flexible microfluidic display applications. 2016 IEEE Sens. (2016) 10:1–3. doi: 10.1109/ICSENS.2016.7808429
6. Zhao R, Cumby B, Russell A, Heikenfeld J. Large area and low power dielectrowetting optical shutter with local deterministic fluid film breakup. Appl Phys Lett. (2013) 103:223510. doi: 10.1063/1.4834095
7. Beni G, Hackwood S. Electro-wetting displays. Appl Phys Lett. (1981) 38:207–9. doi: 10.1063/1.92322
8. Hayes RA, Feenstra BJ. Video-speed electronic paper based on electrowetting. Nature. (2003) 425:383–5. doi: 10.1038/nature01988
9. Xu ZN. An algorithm for selecting the most accurate protocol for contact angle measurement by drop shape analysis. Rev Sci Instrum. (2014) 85:125107. doi: 10.1063/1.4903198
10. Yi Z, Huang Z, Lai S, He W, Wang L, Chi F, et al. Driving waveform design of electrowetting displays based on an exponential function for a stable grayscale and a short driving time. Micromachines. (2020) 11: 313. doi: 10.3390/mi11030313
11. Yi Z, Liu L, Wang L, Li W, Shui L, Zhou G. A driving system for fast and precise gray-scale response based on amplitude–frequency mixed modulation in TFT electrowetting displays. Micromachines. (2019) 10:732. doi: 10.3390/mi10110732
12. Li F, Mugele F. How to make sticky surfaces slippery: contact angle hysteresis in electrowetting with alternating voltage. Appl Phys Lett. (2008) 92:244108. doi: 10.1063/1.2945803
13. Giraldo A, Aubert J, Bergeron N, Li F, Slack A, Weijer M. Transmissive electrowetting-based displays for portable multi-media devices. Sid Sympos Digest Techn Papers. (2012) 40:479–82. doi: 10.1889/1.3256820
14. Yi Z, Feng W, Wang L, Liu L, Lin Y, He W, et al. Aperture ratio improvement by optimizing the voltage slope and reverse pulse in the driving waveform for electrowetting displays. Micromachines. (2019) 10:862. doi: 10.3390/mi10120862
15. Van Dijk R, Feenstra BJ, Hayes RA, Camps IGJ, Boom RGH, Wagemans MMH, et al. Gray scales for video applications on electrowetting displays. Sid Sympos Digest Techn Papers. (2006) 37:1926–9. doi: 10.1889/1.2433427
16. Seveno D, Blake TD, Coninck JD. Young's equation at the nanoscale. Phys Rev Lett. (2013) 111:096101. doi: 10.1103/PhysRevLett.111.096101
17. Dou Y, Wang B, Jin M, Yu Y, Zhou G, Shui L. A review on self-assembly in microfluidic devices. J Micromech Microeng. (2017) 27:113002. doi: 10.1088/1361-6439/aa84db
Keywords: electrowetting display, contact angle hysteresis, alternating current voltage, driving scheme, aperture ratio
Citation: Wang L, Zhang H, Li W, Li J, Yi Z, Wan Q, Zhang J and Ma P (2021) Driving Scheme Optimization for Electrowetting Displays Based on Contact Angle Hysteresis to Achieve Precise Gray-Scales. Front. Phys. 9:655547. doi: 10.3389/fphy.2021.655547
Received: 19 January 2021; Accepted: 22 February 2021;
Published: 16 March 2021.
Edited by:
Qiang Xu, Nanyang Technological University, SingaporeReviewed by:
Xiaowen Zhang, Guilin University of Electronic Technology, ChinaCopyright © 2021 Wang, Zhang, Li, Li, Yi, Wan, Zhang and Ma. This is an open-access article distributed under the terms of the Creative Commons Attribution License (CC BY). The use, distribution or reproduction in other forums is permitted, provided the original author(s) and the copyright owner(s) are credited and that the original publication in this journal is cited, in accordance with accepted academic practice. No use, distribution or reproduction is permitted which does not comply with these terms.
*Correspondence: Wei Li, d2VpLmxpQGd1b2h1YS1vZXQuY29t
Disclaimer: All claims expressed in this article are solely those of the authors and do not necessarily represent those of their affiliated organizations, or those of the publisher, the editors and the reviewers. Any product that may be evaluated in this article or claim that may be made by its manufacturer is not guaranteed or endorsed by the publisher.
Research integrity at Frontiers
Learn more about the work of our research integrity team to safeguard the quality of each article we publish.