 Alejandro D. Arroyo
 Andrea E. Guzman
 Alexander V. Kachur
 Anatoliy V. Popov1
 E. James Delikatny
- 1Department of Radiology, Perelman School of Medicine, University of Pennsylvania, Philadelphia, PA, United States
- 2Department of Chemistry and Biochemistry, Misher College of Arts and Sciences, University of the Sciences, Philadelphia, PA, United States
This paper describes functional fluorinated bioactivatable molecules to study cancer metabolism using Cerenkov imaging. Resazurin (RA), or Alamar Blue, is a commonly used viability dye and redox sensor. Under reductive conditions or by the action of NADH dehydrogenases, RA is reduced into resorufin (RAred), a highly fluorescent molecule. Cold- and radiolabeled monofluorinated resazurin (MFRA) and difluorinated resazurin (DFRA) were synthesized using electrophilic fluorination. The fluorescence of the reduced probes allowed for the detection of Cerenkov Radiation Energy Transfer (CRET). Cerenkov imaging of MFRAred showed a 4-fold increase in signal at 640 nm relative to MFRA, demonstrating the ability to differentiate between oxidized and reduced species via optical imaging. CRET allows the measurement of signal at longer wavelengths closer to the near infrared (NIR) window, ideal for in vivo imaging. MFRA reduction showed different rates in two breast cancer cell lines: MDA-MB-231, a triple-negative breast cancer, and 4175-Luc+, an aggressive MDA-MB-231 variant, isolated from murine lung metastases. 4175-Luc + cells showed a more rapid reduction of RA and MFRAox than MDA-MB-231 cells. Intratumoral injections of 18F-FDG/MFRA showed a faster reduction of the probe in 4175-Luc + tumors than in MDA-MB-231, suggesting that the metabolic feature observed in the cells is maintained in the tumors. MFRA is a promising probe to determine tumor energy imbalance, reductive environments and assess metastatic potential of tumors. Furthermore, the use of 18F-labeled probes allows for dual modality PET/Cerenkov imaging for probe localization and biodistribution while assessing probe reduction simultaneously.
Introduction
Cerenkov radiation is a photon emission arising from a beta particle emitted with kinetic energy greater than the phase velocity of the speed of light in its surrounding solution [1]. The positrons or electrons expulsed from the radioactive isotope travel faster than the speed of light in a dielectric medium, releasing energy as visible wavelength photons. As positrons collide with electrons, gamma rays arising from this annihilation can be detected by positron emission tomography (PET), but gamma rays are not affected by the structure of the molecule containing the radioisotope. As with optical imaging techniques, the Cerenkov photons emitted can be differentially absorbed by bioactive contrast agents that act as molecular switches depending on the effect of the tissue environment on its molecular structure. The development of agents capable of PET and Cerenkov imaging can become the bridge between optical and nuclear imaging; working toward a dual imaging technique that can assess a metabolic profile with Cerenkov complimenting the quantitative information provided by PET.
Despite being discovered almost a century ago, the potential for biomedical Cerenkov imaging was not recognized until 2009 when the first studies were performed in vivo in mice [2]. Investigations into the physical and chemical properties of this new technique demonstrated that the number of Cerenkov photons produced by beta-emitting radionuclides and thus, the brightness of the isotopes, was directly correlated to the kinetic energy of the beta emission of each isotope [3, 4]. While fluorine-18 is a widely used radioisotope for Cerenkov imaging, other isotopes such as iodine-124 and gallium-68 produce more photons due to their higher energy, with yttrium-90 being the highest producer of Cerenkov photons.
The first human Cerenkov imaging study was performed in 2013, to measure and detect the uptake of iodine-131 into the thyroid of a patient with hyperthyroidism [5]. Cerenkov radiation from 18F-FDG has also been used to detect human sentinel nodes [6] in patients undergoing routine PET/CT for various malignancies. The use of gallium-68 labeled probes targeting prostate-specific membrane antigen (PSMA) have been studied for intraoperative positive margin assessment of primary prostate cancer tumor resection [7]. The feasibility of tumor margin assessment has also been explored in breast tumor resections by using 18F-FDG [8]. Cerenkov radiation could be used to measure the doses of 90Y-labeled medications in vivo [9] and, aided by its higher Cerenkov emission, yttrium-90 Cerenkov endoscopic imaging showed improved results compared to an 18F-labeled radiotracer [10]. With its capabilities as a dual isotope for PET and Cerenkov, gallium-68 has been used for the study of glioblastoma in murine xenograft and orthotopic tumors by targeting the integrin αvβ3 using an 3PRGD2 selective tracer [11]. Cerenkov emission is also being used in the clinic to image radiation dosage in patients undergoing radiation therapy treatment [12]. In cancer immunotherapy, Cerenkov imaging has been employed for tracking and measuring T-cells radiolabeled with phosphorus-32 ATP in vivo [13]. Cerenkov radiation has also been suggested as a photon source for photoimmunotherapy, though its lower efficiency compared to NIR can be attributed to the lower tissue penetration of shortwave radiation which accounts for most of its emission [14]. Yttrium-90 has been used to induce activation of photodynamic therapy in vitro [15] and its potential for preclinical imaging has been explored [16]. The blue-weighted Cerenkov emission has been used to activate an azide moiety in fluorophores and drugs in an effort to improve fluorescence-guided surgery and therapy in mice [17].
Cerenkov radiation is continuous and multispectral across the visible spectrum. As a result, Cerenkov emission can be modulated by probes (chromophores and fluorophores) with absorption or emission in the visible wavelengths [18]. Our group has been studying the interaction between Cerenkov photons and pH-sensitive chromophores including bromothymol blue [19], monofluorocresol purple [20], and their respective fluorinated derivatives. We have demonstrated that a pH-dependent attenuation near the absorption maximum can be measured in vitro with discrete filters via a process called Selective Bandwidth Quenching (SBQ). This effect is quantifiable and dependent on concentration of the modulator probe, which makes it ideal for the detection of pH-sensitive probes whose optical properties change depending on the pH of the solution in which they are dissolved. The 18F-labeled monofluorocresol purple probe (18F-MFCP) was further used in vivo to detect pH changes in the urinary bladders of mice arising from the pharmacological inhibition of carbonic anhydrase [20]. A similar interaction can be observed with fluorophores in a process called Cerenkov Radiation Energy Transfer (CRET) or Second Cerenkov emission fluorescence imaging (SCIFI); both refer to the red-shifted radiation caused by the fluorescence of molecules or nanoparticles excited by their absorption of Cerenkov radiation [21, 22].
Resazurin (RA), also known as Alamar Blue, is a compound that is widely used to measure cell viability and cytotoxicity in vitro [23]. It is commonly used in the laboratory setting to monitor cellular health, cell death, and microbial susceptibility. Previously, our lab synthesized and characterized fluorinated derivatives of both resazurin and resorufin (reduced resazurin) [24]. In this paper, we utilize the two main fluorinated derivatives of RA, exploring the potential of these probes for in vitro and in vivo measurement of reductive status. The development of a probe to identify differences in metabolism and correlate it with the metastatic potential of a tumor will give insight on its aggressiveness, stage and, potentially on the progress of the therapeutic regimen. This optical characterization gives us insight to the translation into mouse models and future potential applications.
Methods
Probe Synthesis
RA was fluorinated following a previously reported synthesis [24]. Fluorination was performed by bubbling [18F]F2 gas (0.1% [18F]F2 in Ne with a total activity of 5,550–7,400 MBq for 5 min through a freshly prepared solution of the sodium salt of resazurin (3–5 mg) in 2 ml of glacial acetic acid at a concentration of 2 mg/ml. The reaction mixture was evaporated in vacuo at 120°C, redissolved in 2 ml of water, and injected onto a semi-preparative HPLC column (Phenomenex, Synergi 4 μm Hydro-RP 80 Å 10 × 250 mm). The HPLC elution solvent was 26% ethanol-water for resazurin at a rate of 3 ml/min. The HPLC method used the detection of radioactivity and UV absorption at 575 nm. Under these conditions, elution times for monofluorinated (MFRAox) and difluorinated (DFRAox) compounds were in the range of 25–40 min providing sufficient peak separation without significant decay of the radioactive label. The reactions produce more than one isoform of each of the monofluorinated and difluorinated products, the most abundant being: 4-MFRA (2%) and 2-MFRA (0.5%) for MFRA, and 4,5-DFRA (1%) and 2,4-DFRA (0.5%) for DFRA. As an example, a synthetic run of MFRA results in 63 ± 4 MBq (n = 3). The isoforms co-elute on HPLC and no further purification was performed.
In vitro Cerenkov Imaging
For intramolecular studies, 2.5 MBq of 18F-MFRA in 100 µl saline solution were placed into black-wall clear bottom 96-well plates. For intermolecular studies, 18F-FDG and cold resazurin (∼2.6 MBq in 100 µl) were added to the wells. For both experiments, the probes were reduced by addition of 10 µl of 1 mg/ml sodium dithionite. Cerenkov images were acquired using the PerkinElmer IVIS Spectrum in the Small Animal Imaging Facility (SAIF) Optical Core. Images were collected using an open filter or using the 20-nm bandwidth emission filters available in the imaging system, which span from 500 to 840 nm. The parameters of the acquisition were: Binning: 8 (medium), FOV: 12 cm, f2, 60 s exposure for filters and 30 s for the open filter. Images were processed and quantitated in LivingImage 4.4. ROIs were defined by overlaying a grid over the well plate image. These studies were performed in triplicate wells.
Cell Studies
4175-Luc+ and MDA-MB-231 cells were seeded at 1.5–3.5 x 10⁴ cells in 96-well black-wall, clear-bottom plates around 24 h prior to the experiment. At the time of the experiment, media was aspirated and replaced with 100 μl of fresh phenol red-free media, followed by addition of 10 μl of probe. Fluorescence was monitored as a function of time on a SpectraMax M5 fluorescent plate reader at 37°C, bottom read, ex/em 575/585 nm (for RA), and 588/594 nm (for MFRA).
Liposomal Formulation
Egg phosphatidylcholine (12 µl) and chloroform (988 µl) were mixed together in a 25 ml round bottom flask. The mixture was placed under a slow stream of nitrogen gas to evaporate the solvent, resulting in an even lipid “cake” forming in the bottom of the flask. This lipid cake was resuspended in 1 ml of an aqueous solution of DFRA, then sonicated in a 4°C water bath for 10–15 min. The resulting slightly cloudy mixture was used immediately.
Mouse Experiments
All animal experiments were approved by the Institutional Animal Care and Use Committee at the University of Pennsylvania. Mice were anesthetized using 3–4% isoflurane in oxygen. For imaging experiments, mice were kept under anesthesia with 1.5–2% isoflurane.
Tumor Xenograft Inoculation
Cells were grown in T-150 tissue culture flasks up to 80% confluency. Cells were trypsinized, centrifuged, counted and suspended in PBS to obtain a final concentration of 2 × 10⁷ cells/ml. The resulting suspension was diluted 1:1 with Matrigel® (Corning), achieving a final concentration of 1 × 10⁷ cells/ml. This solution was placed in a 12-well plate inside an ice bucket. The cell:Matrigel mixture was drawn up into a 1 ml syringe. Any air bubbles were removed through gentle tapping and/or flicking and a 26-gauge needle was placed at the tip. The area of injection was cleaned with an alcohol wipe (70% isopropanol). 100 µl of the cell:Matrigel solution was injected subcutaneously in the right superior shoulder flank or the right hind leg flank. 4175-Luc+ tumors are palpable one week after inoculation and are suitable for probe injection and optical experiments between 2.5–3 weeks post-injection. MDA-MB-231 tumors take between 4–5 weeks to reach a suitable size for imaging.
Tumor Painting
Tumors grown in athymic nude mice were harvested, sliced into approximately 1 mm sections and placed in a 12-well plate with warm phenol red-free media. Following a 2-h incubation at 37°C and 5% CO2, 100 µl of DFRA were added to the media focusing the pipette over the tumor slice. The plate was placed in the IVIS Spectrum imaging system and fluorescence was acquired at 570/620 nm (ex/em) as a function of time. Fluorescence emission was quantified using LivingImage software by laying a 3 x 4 ROI grid over the timed images obtained from the IVIS.
Probe Injection
For intratumoral injections, the probe (1.1–1.5 MBq in 20–25 μl) was drawn up into a 300 µl insulin syringe (Covidien) with a 29-gauge needle. The area was sterilized with an alcohol wipe (70% isopropanol). Injection was done into the center of the tumor. If the tumor was ovoid in shape, the insertion of the needle was done along the longest axis, allowing for maximum travel of the needle to prevent probe leakage. The syringe plunger was pressed very gently to account for back pressure from the tumor and to prevent tumor structural damage.
For intravenous injections, the probe (∼11.1–14.8 MBq in 200 μl) was drawn up into a 300 µl insulin syringe (Covidien) with a 29-gauge needle. Air bubbles were removed through gentle tapping and/or flicking. The tail vein was warmed by the use of a warm water compress and sterilized with an alcohol wipe (70% isopropanol). The needle was injected into the tail vein and the plunger gently pushed to prevent vessel rupture.
In vivo Cerenkov Imaging
Mice were placed on a warmed stage of the IVIS Spectrum quickly after injection of the probe. Before the mice were placed, acquisition parameters were set in the computer: Binning: 8 (medium), FOV: 22.5 cm, f2, 5 min exposure for filters 580, 640, and 840 nm. These filters were chosen because of their relevance for MFRA imaging: at 580 nm the Cerenkov emission signal is the same between the reduced (MFRAred) and oxidized (MFRAox) probes, 640 nm represented a wavelength with a significantly higher emission of the reduced form. At 840 nm, Cerenkov emission is negligibly affected by either probe, and this wavelength was chosen for ratiometric measurements to correct for probe decay and concentration effects. Regions of Interest (ROI) were drawn around white light images of tumora using the Freedraw feature of LivingImage software, followed by overlay of fluorescence or Cerenkov data. For DFRA experiments of flank tumors, a piece of black construction paper was gently rolled into a cylinder to cover the mouse. A hole in the shape of the tumor was cut allowing for the tumor to be uncloaked.
PET Imaging
Positron emission tomography (PET) was performed at the SAIF Nuclear Imaging Core. PET imaging studies of 2-h dynamic scans were performed after IV injection of 14.8–18.5 MBq of the radioactive probe into the mouse in saline or liposomal formulation. Mice were anesthetized as mentioned above and images acquired in the aPET scanner for 2 h. Reconstruction of the data obtained was performed using Amide software with 10-min time points.
Results
Figure 1 shows the effect of oxidized and reduced MFRA and DFRA on the Cerenkov radiation spectrum. Figure 1A shows the intermolecular effects of the probe (when non-radioactive MFRA was mixed with 18F-FDG), and Figure 1B shows this effect intramolecularly (using 18F-MFRA). The graphs below show the quantification of the images in quadruplicate relative to the emission measured using the 840 nm filter. Each experiment has an 18F-FDG control, which shows the expected 1/λ2-dependent decrease in Cerenkov emission with increasing wavelength. The row of wells below shows the intermolecular effects of 19F-MFRA mixed with 18F-FDG (A) and intramolecular 18F-MFRA (B); a significant attenuation of the Cerenkov signal was observed in the 560–660 nm filters, due to SBQ, the absorption of Cerenkov light by MFRA at these wavelengths. In the third row of wells, the probes were reduced chemically using sodium dithionite to form MFRAred. Attenuation of the Cerenkov signal by SBQ is still detected in the 560–580 nm filters, both inter- and intramolecularly. However, an increase in signal is detected in the 600–660 nm filters, when compared to the wells above containing MFRA (highlighted in the yellow boxes). This increase in signal is caused by CRET, the absorption of Cerenkov radiation by MFRAred followed by fluorescence emission at a longer wavelength. The ratio of the signal of MFRAred:MFRA peaks at 620 nm, exhibiting a ratio of around 4:1.
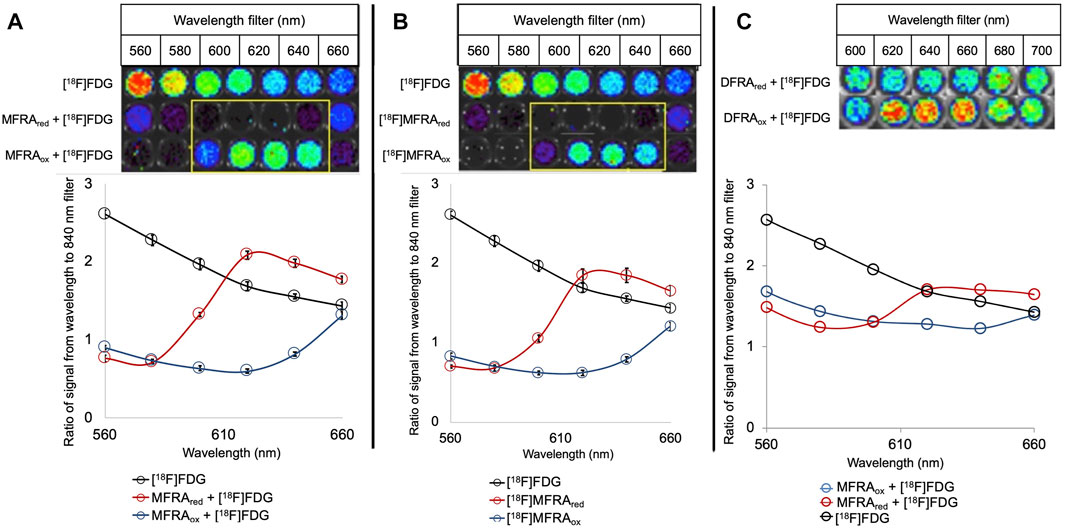
FIGURE 1. Intermolecular (A) and intramolecular (B) effects of MFRAox and MFRAred and intermolecular (C) effect of DFRA and DFRAred on Cerenkov radiation: Cerenkov images are shown on top, the graphs below show the quantification of the signal relative to the emission at 840 nm (n = 4). At each wavelength, an 18F-FDG control shows the expected emission of Cerenkov radiation as a visual point of reference. In the 19F-MFRA mixed with 18F-FDG (A) and 18F-MFRA (B), an attenuation of the Cerenkov signal is observed in the 560–660 nm filters. After reduction with sodium dithionite, attenuation of the Cerenkov signal is still detected in the 560–580 nm filters, both inter- and intramolecularly. In filters 600–660 nm, an increase in signal is detected when compared to the oxidized probe due to CRET, fluorescence emission of absorbed Cerenkov light. The CRET emission peaks at 620 nm with a 4:1 ratio of reduced to oxidized signal. DFRA (Error bars = standard deviation) (C) attenuates Cerenkov signal between the 600–660 nm filters. CRET from DFRAred increases the detected signal in the 620–660 nm filters (n = 1). The ratio of DFRAred:DFRA peaks at 1.4:1 in both the 620 and 640 nm filters.
When the intermolecular experiment was replicated using the difluorinated derivative DFRA, similar results were observed, although the overall effect was reduced (Figure 1C). SBQ in the Cerenkov spectrum was detected in the presence of DFRA between 600–660 nm. When DFRA was reduced, the attenuation is only detected in the 600 nm filter, but a CRET increase in signal is detected from 620–660 nm. The ratio between reduced and oxidized was calculated to be 1.4 to 1 at 620 and 640 nm.
The reduction in SBQ and CRET in DFRA relative to MFRA led us to synthesize and further investigate the fluorescence optical properties of the fluorinated products, MFRAred and DFRAred. Consistent with previous studies [19, 20, 24, 25], the introduction of successive fluorines into the dye molecule caused a progressive bathochromic shift of both excitation/emission wavelengths: from 568/585 nm for RAred to 576/594 nm for MFRAred, and 588/601 nm for DFRAred (Supplementary Figure 1). In addition, the relative brightness of the fluorescent products decreased with addition of fluorine. MFRAred showed a 37% decrease in the ratio of fluorescence to absorbance when compared to RAred. DFRAred showed a ratio of 0.05, an even steeper decrease of 93% when compared to RAred.
RA is commonly used in cells as a viability sensor where it is reduced by NADH dehydrogenases, like Complex I in the mitochondrial electron transport chain [23]. We tested the ability of MDA-MB-231 and 4175-Luc+ breast cancer cells to reduce RA and the fluorinated derivatives (Figure 2). Both cell lines were able to reduce RA and MFRA, but the extent of reduction was reduced in the monofluorinated compound. Reduction was further reduced in the difluorinated derivative (data not shown). In addition, MDA-MB-231 cells showed a slower reduction rate of RA (Figure 2A) and MFRA (Figure 2B) than 4175-Luc+ cells. Rotenone, a Complex I inhibitor used in Parkinson’s Disease research [26], was able to decrease the rate of reduction of RA (Supplementary Figure 2).
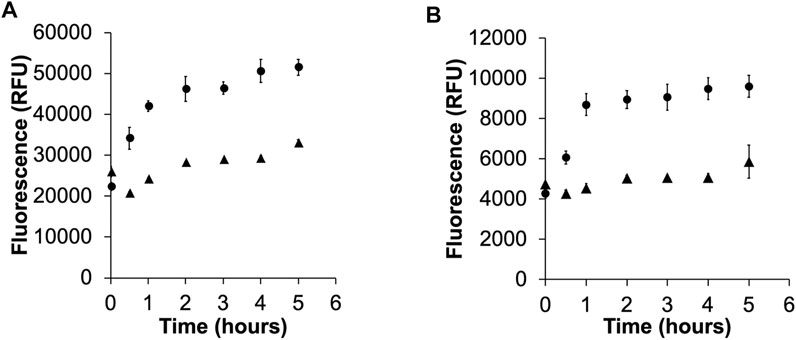
FIGURE 2. Activation of RA (A), and MFRA (B) in 4175-Luc+ (circles) and MDA-MB-231 (triangles). The graphs show the activation of the probes as measured by the time dependent increase in fluorescence of the reduced product at their respective maxima (RAred = 585 nm, MFRAred = 594 nm). The reduction of RA and MFRA is greater and faster in the metastatic variant 4175-Luc+ cells (Error bars = standard deviation).
To determine the potential for reduction of the probe in tumors, an ex vivo fluorescence experiment was performed by painting DFRA onto tumor slices. Figure 3 demonstrates significant ex vivo activation of DFRA in either saline or liposomal formulation that could be observed as early as 15 min after application. The controls in this experiment show that DFRA was not spontaneously activated by cell culture media for the first 90 min, nor was there significant signal arising from the tumor tissue in the absence of DFRA.
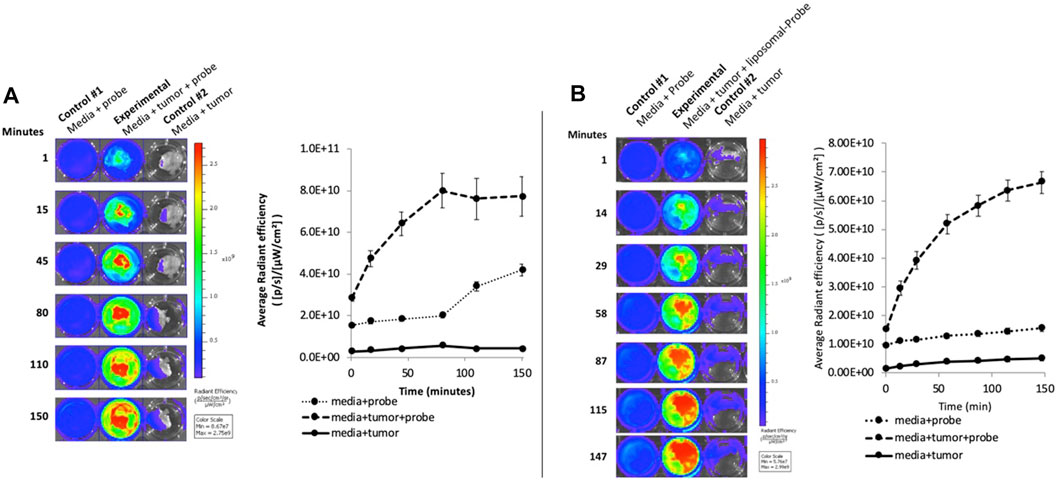
FIGURE 3. Ex vivo activation of DFRA in aqueous (A) and liposome formulation (B) by 4175-Luc+ tumor slices: The image shows the fluorescence activation of DFRA painted on tumor slices over a 2.5-h time course measured using the IVIS Spectrum, with excitation and emission at 570 and 620 nm, respectively. No increase in fluorescence was observed when the tumors were incubated in media alone. There was some non-specific increase in fluorescence after 90 min when the probe was incubated in media in the absence of tumor that was eliminated when the DFRA was packaged in liposomes. The graph shows the quantification of the fluorescence signal from the wells in the image (Error bars = standard deviation).
In vivo PET imaging was used to determine the optimal delivery time of 18F-DFRA to the tumor and its biodistribution in mice bearing 4175-Luc+ tumor xenografts (Supplementary Figure 3). Both the saline and liposomal formulations of DFRA were tested. PET showed distribution of the probe predominantly to the liver and kidneys. Maximum tumor accumulation occurred at about 1 h, with 0.27% of injected dose in the tumor for saline formulation and 0.9% for the liposomal formulation.
To measure the in vivo reduction of the probe using Cerenkov imaging, a mouse bearing a 4175-Luc+ flank tumor was injected via tail vain with 22.2 MBq of 18F-DFRA and monitored for 2 h. Figure 4 shows the image time course using the open filter setting in the IVIS Spectrum. The kidneys were detected as two prominent hot spots at the first time point (around 10 min past injection) and were not detectable after 1 h. After the 1-h time point, the mouse was cloaked allowing just the tumor to be imaged (magnified insert in Figure 4). The open filter image confirms signal arising from the tumor, demonstrating the accumulation of the probe in accordance with the PET data. Signal attenuation is observed in the 580 nm filter, some signal is detected in the 620 nm filter (focused in the distal periphery of the tumor) and mostly background was detected in the 840 nm filter. The increased signal in the 620 nm filter imaging implies the presence of CRET, and thus reduction of the probe in vivo. Cloaking was necessary in this experiment due to the high degree of background signal from kidney, and the relatively lower signal obtainable from DFRA. Cerenkov emissions measured through the cloak may contain contributions from the adjacent bright kidney and/or bladder. Thus, for subsequent experiments, tumors were implanted in the mouse shoulder, using intratumoral injections of MFRA.
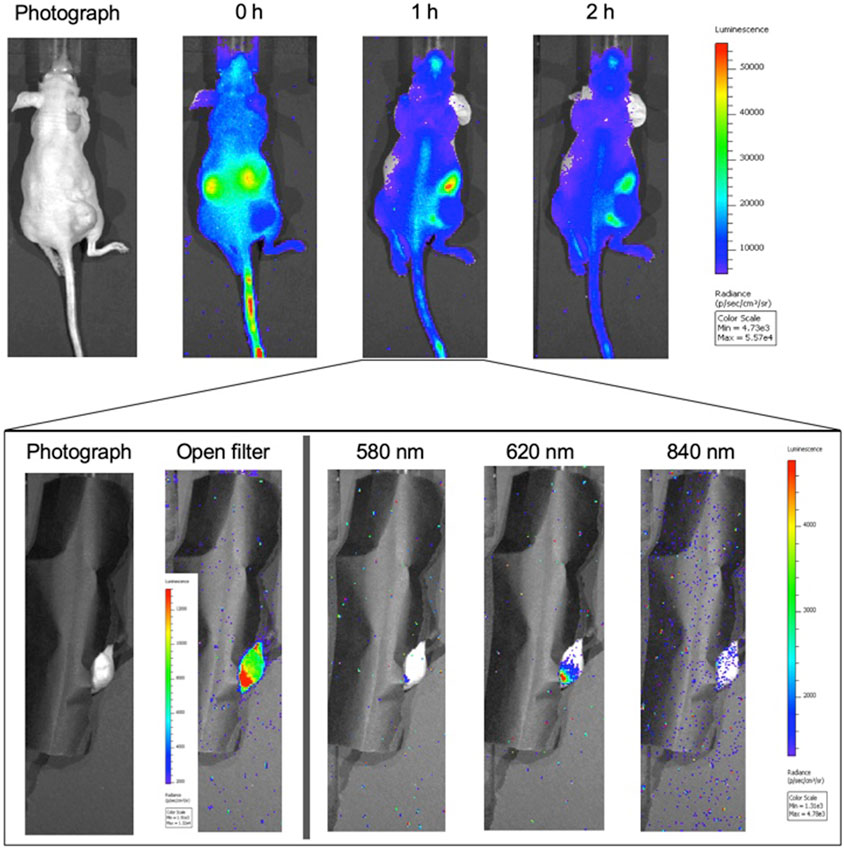
FIGURE 4. Cerenkov imaging time course of 18F-DFRA in tumor-bearing athymic nude mice (n = 1): A mouse with a 4175-Luc+ breast tumor xenograft in the right flank was injected with 22.2 MBq of 18F-DFRA via tail vein and imaged for 2 h. (A) The top figure shows the biodistribution of the probe in the mouse at three time points using the open filter setting in the IVIS Spectrum. The kidney signal is quite prominent at t = 0 h, suggesting rapid renal elimination. (B) At the 1 h time point, the mouse was covered leaving only the tumor visible for imaging (inset). The open filter image shows that the probe was in higher concentration in the periphery in the lower part of the tumor (smaller lobe). Imaging with the 580 nm filter showed little signal emitting from this lobe; the signal was higher in the 620 nm filter, indicating probe reduction.
A comparison between 4175-Luc+ and MDA-MB-231 xenografts was performed using intramolecular Cerenkov imaging to test if the activation rate difference observed in cultured cells is retained in tumors (Figure 5). 0.7 MBq 18F-MFRA in 20 µl was injected intratumorally and the activation was monitored over the course of one hour. The 4175-Luc+ tumors showed high initial signal that decreased over time. The MDA-MB-231 tumor showed a lower initial signal with a tendency toward increasing with time. Each time point measurement was corrected to the emission observed in the 840 nm filter. This observation reflects what was seen in cells: the probe is reduced more rapidly in 4175-Luc + tumors than in MDA-MB-231 tumors. A preliminary study using MFRA co-injected with 18F-FDG had shown a similar trend (Supplementary Figures 4A–C). In this experiment, the tumors were excised and sliced in half to reveal an area close to the site of the injection. Excised tumor halves confirm that the tumors retain the metabolic differences observed in the cells (Supplementary Figures 4D–E).
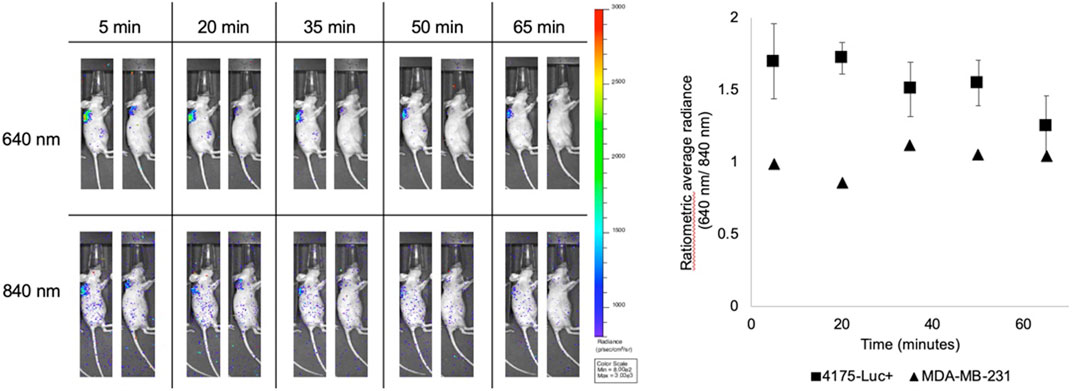
FIGURE 5. In vivo activation of 18F-MFRA in 4175-Luc+ and MDA-MB-231 tumors. 0.7 MBq in 20 µl of 18F-MFRA were intratumorally injected into tumor-bearing mice to compare the activation rate of the probe in two tumors types: 4175-Luc+ (left, n = 4) and MDA-MB-231 (right, n = 1). Cerenkov images show the emission detected in the 640 nm filter (Top), where we expect to see CRET, and in the 840 nm filter (Bottom), which were used for normalization to account for radioactive decay and probe concentration. The graph on the right shows the quantification of the probe as a function of time. As observed previously, 18F-MFRA seems to be immediately reduced in the 4175-Luc + tumors as evidenced by the CRET detected in the 640 nm filter at the earliest time point (t = 5 min). The signal decreases with time, which suggests the washout of the probe. The MDA-MB-231 tumor shows a slower rate of reduction, almost reaching the same signal by the endpoint of the experiment. In this tumor, we expect two mechanisms are acting in concert: the activation of 18F-MFRA and the washout of the probe from the tumor.
To compare the performance of the interaction of the probe with Cerenkov radiation in vivo, an intermolecular tumor study was performed to provide the comparison (Supplementary Figure 5). Similar to the in vitro experiment, the signals arising from both methods are comparable.
Discussion
RA belongs to a group of tricyclic organic molecules that can be electrophilically fluorinated by dilute fluorine gas ([19F]-F2 or [18F]-F2) (Supplementary Figure 1). The yields of the fluorinated products of this reaction are low (1–2.5%) compared to fluorination of triarylmethane pH indicators (5–10%) performed by our group [19, 25, 27–29]. However, the yield of MFRA and DFRA is sufficient to produce the 18F-labeled compounds for in vivo and in vitro experiments.
The application of the RA probe resides in its potential for biological reduction into RAred, or resorufin, a highly fluorescent compound. RA is used frequently in the laboratory as a measure of viability in cultured cells. In vitro, the reduction of RA by mitochondrial NADH dehydrogenases is associated with a functioning electron transport chain, and thus overall cellular health. The emission frequency of RAred at 585 nm is not in the NIR window and is not ideal for in vivo imaging. However, introduction of fluorine atoms into RA causes a bathochromic shift in the absorption and emission maxima of the fluorinated compounds. In turn, the resulting fluorinated derivatives of the reduced probes, MFRAred and DFRAred, analyzed by fluorinating RAred, also show a bathochromic shift in their absorbance and fluorescence. We observed a red shift in the maximum CRET emission of these fluorophores, out to 620 nm, closer to the NIR imaging window, thus diminishing the influence of hemoglobin, water, and other porphyrin-based molecules on our ability to detect the probe. These factors would ideally make DFRA the most promising probe for in vivo observations of cell viability; not only for the longer emission wavelengths but also for the increased Cerenkov signal expected from higher radiolabeling. However, when dealing with fluorophores, wavelength is not the only factor affecting in vivo imaging applications. At the excitation maximum wavelength for each molecule, MFRAred and DFRAred showed a progressive decrease in fluorescence intensity relative to RAred. Quantification of the intensity of fluorescence and comparison with the absorbance of each molecule confirmed the decrease between the parent fluorophore and the two fluorinated derivates (Supplementary Figure 2). This means that the use of the fluorinated derivatives needs to be balanced between radioactive signal and fluorescent CRET signal arising from excitation by Cerenkov radiation.
The optical difference between the oxidized and reduced form of the fluorinated RA derivatives provides the contrast for this imaging probe (Figure 1). SBQ and CRET were observed both intermolecularly (between MFRA and 18F-FDG) and intramolecularly (using 18F-MFRA) when the probe was chemically reduced using sodium dithionite. A high emission ratio of 4:1 between reduced and oxidized at 640 nm and a relative quantum yield of 0.46 indicates that 18F-MFRA should be the best candidate for in vivo imaging. The effect of DFRA and DFRAred on the Cerenkov radiation spectrum was similar, but as a result of the smaller fluorescence-to-absorbance ratio, the ratio between the reduced and oxidized form was only 1.4 to 1 at its highest point at 640 nm).
The reduction of RA occurs inside the cell, predominantly catalyzed by enzymes such as mitochondrial NADH dehydrogenases in the electron transport chain. The decrease in the rate of activation of RA is decreased by treatment with rotenone, a Complex I inhibitor (Supplementary Figure 2). However, the reduction is not completely inhibited suggesting that other enzymes, such as cytoplasmic and mitochondrial NAD(P)H dehydrogenases may also be involved independent of the electron transport chain function. RA and MFRA showed different rates of activation in two breast cancer cell lines, MDA-MB-231 and 4175-Luc+, suggesting that the probe could potentially differentiate between different cell types based on their metabolic activity and their metastatic potential (Figure 2).
The elimination of the probe occurred mostly through the renal route, as evidenced by two imaging techniques (PET and Cerenkov). For this type of probe, renal excretion would be expected due to its high polarity, high water solubility and small molecular weight. 18F-DFRA, when injected via tail vein localizes to the tumor in small amounts, from 0.27–0.9% of injected dose, depending on formulation (Supplementary Figure 3). In part, delivery relies on the enhanced permeability and retention (EPR) effect observed in tumors: leaky vasculature allowing the probe to escape the bloodstream, and a slow lymphatic system to prevent the probe from being removed. If the probe gets delivered to the tumor, it will be reduced, as confirmed by the ex vivo tumor slice fluorescence activation experiment shown in Figure 3.
When analyzing the Cerenkov data from a tail vein injection, the time course confirms what we detected in the PET imaging study. The kidneys start to filter the probe also as soon as it is injected. The difference in emission between the 580 and 620 nm filter image at the 1-h time point shown in Figure 4 shows signal arising from the lower part of the tumor. From this we can draw a couple of conclusions: DFRAred is present in the tumor, DFRAox has been biologically reduced in vivo, and CRET at 620 nm is the main source for this signal. Something to consider is that the signal arising from the 620 nm filter maybe subjected to slightly lower tissue attenuation and scattering than the 580 nm. Assuming that these filters are just 40 nm apart, we could expect this attenuation to be relatively similar. At this point, however, we decided to move ahead with MFRA to enhance the signal in vivo; it was brighter than DFRA and with a bigger signal difference between oxidized and reduced.
The comparative application of these probes in vivo relies on the different rate of reduction between cell types and the potential to identify cell viability or drug efficacy and/or action by a change in reduction rate. The potential to identify tumors of different metastatic potential and aggressiveness could be useful for staging or for predicting clinical outcome. In Figure 2, these two cell types showed different reduction rates of MFRA. The intratumoral injection of the 18F-MFRA into 4175-Luc + tumor xenografts showed probe reduction almost immediately, while the MDA-MB-231 tumor takes slightly longer for the probe to be fully reduced (Figure 5). This shows that the difference in reduction rate seems to be preserved from cells in tumor xenografts and confirms what was observed in the preliminary study with the 18F-FDG + MFRA shown in Supplementary Figure 4. A comparison between two experiments similar to those in Figure 5; Supplementary Figure 4 shows us that the signal obtained from intra- and intermolecular Cerenkov radiation in vivo behaves relatively the same across time; showing the potential for co-injection of a bioactive probe and a radiolabeled tracer.
Conclusion
The 18F-labeled and non-radioactive fluorinated derivatives of RA and of its reduced product RAred were presented. The fluorinated RA probes retain the cellular activity of the parent compound while shifting the fluorescent properties of the reduced products toward the NIR window. These probes show promise to determine the difference between cancer cell lines with different metabolism or metastatic potential. This aspect opens the door for assessing the effects of disruptors of cell metabolism, such as anti-cancer drugs in vivo and eventually in the clinic. The successful application of 18F-MFRA probe, the best candidate, will require higher specific activity, which could be achieved through higher specific labeling of the probe or by improvement of the synthetic pathway of the probe. While electrophilic fluorination can produce sufficient amounts of probes (at all levels of fluorination), and MFRA seems to be the optimal probe for Cerenkov applications, increasing the 18F labeling of the probe will allow smaller volumes of 18F-MFRA to be injected resulting in increased brightness of the Cerenkov signal. This would increase the signal-to-noise ratio allowing for a more robust methodology. Though adequate radiolabeled probe was synthesized for in vitro and systemic in vivo experiments, the major challenge for intratumoral application arises during the long purification, collection and evaporation steps of probe preparation for in vivo imaging. This optimization of the synthesis and the collective results presented in this paper show that the fluorinated RA probes could be used in the staging and overall determination of tumor health status during treatment using Cerenkov imaging.
Data Availability Statement
The raw data supporting the conclusions of this article will be made available by the authors, without undue reservation.
Ethics Statement
The animal study was reviewed and approved by Institutional Animal Care and Use Committee, University of Pennsylvania.
Author Contributions
ADA, AEG, AVK, AVP, and EJD were involved in the design, development and idea of the project. ADA and AEG were in charge of executing the experiments included in this paper. AVK and AVP’s expertise in fluorine chemistry was instrumental in the experiments that laid the foundations for this project. ADA and AVK were in charge of the synthesis of the radiolabeled compounds.
Funding
Funding for this project was provided by the National Institutes of Health. The following grants provided the funding for this project: T32 GM008076 (ADA), F31 CA206453 (ADA), F31 EB029309 (AEG) P30 CA016520 (EJD), UL1 RR024134 (EJD), R01 EB018645 (EJD).
Conflict of Interest
The authors declare that the research was conducted in the absence of any commercial or financial relationships that could be construed as a potential conflict of interest.
Publisher’s Note
All claims expressed in this article are solely those of the authors and do not necessarily represent those of their affiliated organizations, or those of the publisher, the editors and the reviewers. Any product that may be evaluated in this article, or claim that may be made by its manufacturer, is not guaranteed or endorsed by the publisher.
Acknowledgments
The authors would like to acknowledge Eric Blankemeyer, and Ching Huang from the University of Pennsylvania Small Animal Imaging Facility for their assistance and Julie Czupryna for her help in the initial experiments of this project. We would like to acknowledge also the Cyclotron Facility at the Hospital of the University of Pennsylvania, especially Sharon Lee and Alex Schmitz for their help navigating the production of the probes in the late stages of the project.
Supplementary Material
The Supplementary Material for this article can be found online at: https://www.frontiersin.org/articles/10.3389/fphy.2021.652179/full#supplementary-material
References
1. Bhatt NB, Pandya DN, Dezarn WA, Marini FC, Zhao D, Gmeiner WH. Practical Guidelines for Cerenkov Luminescence Imaging with Clinically Relevant Isotopes. Methods Mol Biol (2018) 1790:197–208. doi:10.1007/978-1-4939-7860-1_15
2. Robertson R, Germanos MS, Li C, Mitchell GS, Cherry SR, Silva MD. Optical Imaging of Cerenkov Light Generation from Positron-Emitting Radiotracers. Phys Med Biol (2009) 54(16):N355–N365. doi:10.1088/0031-9155/54/16/n01
3. Ciarrocchi E, Belcari N. Cerenkov Luminescence Imaging: Physics Principles and Potential Applications in Biomedical Sciences. EJNMMI Phys (2017) 4(1):14. doi:10.1186/s40658-017-0181-8
4. Ruggiero A, Holland JP, Lewis JS, Grimm J. Cerenkov Luminescence Imaging of Medical Isotopes. J Nucl Med (2010) 51(7):1123–30. doi:10.2967/jnumed.110.076521
5. Spinelli AE, Ferdeghini M, Cavedon C, Zivelonghi E, Calandrino R, Fenzi A. First Human Cerenkography. J Biomed Opt (2013) 18(2):020502-1–020502-3. doi:10.1117/1.jbo.18.2.020502
6. Thorek DLJ, Riedl CC, Grimm J. Clinical Cerenkov Luminescence Imaging of 18F-FDG. J Nucl Med (2014) 55:95–8. doi:10.2967/jnumed.113.127266
7. Olde Heuvel J, de Wit-van der Veen BJ, van der Poel HG, Bekers EM, Grootendorst MR, Vyas KN. 68Ga-PSMA Cerenkov Luminescence Imaging in Primary Prostate Cancer: First-In-Man Series. Eur J Nucl Med Mol Imaging (2020) 47(11):2624–32. doi:10.1007/s00259-020-04783-1
8. Grootendorst MR, Cariati M, Pinder SE, Kothari A, Douek M, Kovacs T. Intraoperative Assessment of Tumor Resection Margins in Breast-Conserving Surgery Using 18F-FDG Cerenkov Luminescence Imaging: A First-In-Human Feasibility Study. J Nucl Med (2017) 58(6):891–8. doi:10.2967/jnumed.116.181032
9. Lohrmann C, Zhang H, Thorek DLJ, Desai P, Zanzonico PB, O’Donoghue J. Cerenkov Luminescence Imaging for Radiation Dose Calculation of a 90Y-Labeled Gastrin-Releasing Peptide Receptor Antagonist. J Nucl Med (2015) 56(5):805–11. doi:10.2967/jnumed.114.149054
10. Liu H, Ren G, Miao Z, Zhang X, Tang X, Han P. Molecular Optical Imaging with Radioactive Probes. PLoS One (2010) 5(3):e9470. doi:10.1371/journal.pone.0009470
11. Fan D, Zhang X, Zhong L, Liu X, Sun Y, Zhao H. 68Ga-Labeled 3PRGD2for Dual PET and Cerenkov Luminescence Imaging of Orthotopic Human Glioblastoma. Bioconjug Chem. (2015) 26(6):1054–60. doi:10.1021/acs.bioconjchem.5b00169
12. Hachadorian RL, Bruza P, Jermyn M, Gladstone DJ, Pogue BW, Jarvis LA. Imaging Radiation Dose in Breast Radiotherapy by X-ray CT Calibration of Cherenkov Light. Nat Commun (2020) 11(1):2298. doi:10.1038/s41467-020-16031-z
13. Boschi F, De Sanctis F, Ugel S, Spinelli AE. T-cell Tracking Using Cerenkov and Radioluminescence Imaging. J Biophotonics (2018) 11(10):e201800093. doi:10.1002/jbio.201800093
14. Nakamura Y, Nagaya T, Sato K, Okuyama S, Ogata F, Wong K. Cerenkov Radiation-Induced Photoimmunotherapy with 18F-FDG. J Nucl Med (2017) 58(9):1395–400. doi:10.2967/jnumed.116.188789
15. Hartl BA, Hirschberg H, Marcu L, Cherry SR. Activating Photodynamic Therapy In Vitro with Cerenkov Radiation Generated from Yttrium-90. J Environ Pathol Toxicol Oncol (2016) 35(2):185–92. doi:10.1615/jenvironpatholtoxicoloncol.2016016903
16. Mitchell GS, Lloyd PNT, Cherry SR. Cerenkov Luminescence and PET Imaging of (90)Y: Capabilities and Limitations in Small Animal Applications. Phys Med Biol (2020) 65(6):065006. doi:10.1088/1361-6560/ab7502
17. Das S, Haedicke K, Grimm J. Cerenkov-Activated Sticky Tag for In Vivo Fluorescence Imaging. J Nucl Med (2018) 59:58–65. doi:10.2967/jnumed.117.198549
18. Ma X, Wang J, Cheng Z. Cerenkov Radiation: a Multi-Functional Approach for Biological Sciences. Front Phys (2014) 2(4). doi:10.3389/fphy.2014.00004
19. Kachur AV, Arroyo AD, Bryan NW, Saylor SJ, Popov AV, Delikatny EJ. Synthesis of pH Indicators for Cerenkov Imaging by Electrophilic Substitution of Bromine by Fluorine in an Aromatic System. J Fluorine Chem (2017) 200:146–52. doi:10.1016/j.jfluchem.2017.06.017
20. Czupryna J, Kachur AV, Blankemeyer E, Popov AV, Arroyo AD, Karp JS. Cerenkov-specific Contrast Agents for Detection of pH In Vivo. J Nucl Med (2015) 56(3):483–8. doi:10.2967/jnumed.114.146605
21. Dothager RS, Goiffon RJ, Jackson E, Harpstrite S, Piwnica-Worms D. Cerenkov Radiation Energy Transfer (CRET) Imaging: A Novel Method for Optical Imaging of PET Isotopes in Biological Systems. PLoS One (2010) 5(10):e13300. doi:10.1371/journal.pone.0013300
22. Tamura R, Pratt EC, Grimm J. Innovations in Nuclear Imaging Instrumentation: Cerenkov Imaging. Semin Nucl Med (2018) 48(4):359–66. doi:10.1053/j.semnuclmed.2018.02.007
23. O'Brien J, Wilson I, Orton T, Pognan F. Investigation of the Alamar Blue (Resazurin) Fluorescent Dye for the Assessment of Mammalian Cell Cytotoxicity. Eur J Biochem (2000) 267(17):5421–6. doi:10.1046/j.1432-1327.2000.01606.x
24. Kachur AV, Arroyo AD, Popov AV, Saylor SJ, Delikatny EJ. Synthesis of F-18 Labeled Resazurin by Direct Electrophilic Fluorination. J Fluorine Chem (2015) 178:136–41. doi:10.1016/j.jfluchem.2015.07.017
25. Arroyo AD, Guzmán AE, Kachur AV, Saylor SJ, Popov AV, Delikatny EJ. Development of Fluorinated Naphthofluoresceins for Cerenkov Imaging. J Fluorine Chem (2019) 225:27–34. doi:10.1016/j.jfluchem.2019.05.010
26. Heinz S, Freyberger A, Lawrenz B, Schladt L, Schmuck G, Ellinger-Ziegelbauer H. Mechanistic Investigations of the Mitochondrial Complex I Inhibitor Rotenone in the Context of Pharmacological and Safety Evaluation. Sci Rep (2017) 7:45465. doi:10.1038/srep45465
27. Kachur AV, Popov AA, Delikatny EJ, Karp JS, Popov AV. Synthesis of 18F-Labeled Phenolphthalein and Naphtholphthalein. J Fluorine Chem (2013) 151:1–6. doi:10.1016/j.jfluchem.2013.03.021
Keywords: cerenkov imaging, cancer metabolism, in vivo imaging, activatable probes, cerenkov radiation energy transfer
Citation: Arroyo AD, Guzman AE, Kachur AV, Popov AV and Delikatny EJ (2021) Development of 18F-Labeled Resazurin Derivatives for the Detection of Tumor Metabolic Activity Using Cerenkov Imaging. Front. Phys. 9:652179. doi: 10.3389/fphy.2021.652179
Received: 11 January 2021; Accepted: 29 June 2021;
Published: 24 August 2021.
Edited by:
Brian William Pogue, Dartmouth College, United StatesReviewed by:
Muhammad Ramish Ashraf, Dartmouth College, United StatesDavid B Stout, Independent researcher, Culver City, CA, United States
Copyright © 2021 Arroyo, Guzman, Kachur, Popov and Delikatny. This is an open-access article distributed under the terms of the Creative Commons Attribution License (CC BY). The use, distribution or reproduction in other forums is permitted, provided the original author(s) and the copyright owner(s) are credited and that the original publication in this journal is cited, in accordance with accepted academic practice. No use, distribution or reproduction is permitted which does not comply with these terms.
*Correspondence: E. James Delikatny, ZGVsaWthdG5AcGVubm1lZGljaW5lLnVwZW5uLmVkdQ==