- 1Laboratory for ElectromAgnetic Detection (LEAD), Institute of Space Sciences, Shandong University, Weihai, China
- 2School of Mechanical, Electrical & Information Engineering, Shandong University, Weihai, China
Solar radio bursts can be used to study the properties of solar activities and the underlying coronal conditions on the basis of the present understanding of their emission mechanisms. With the construction of observational instruments, around the world, a vast volume of solar radio observational data has been obtained. Manual classifications of these data require significant efforts and human labor in addition to necessary expertise in the field. Misclassifications are unavoidable due to subjective judgments of various types of radio bursts and strong radio interference in some events. It is therefore timely and demanding to develop techniques of auto-classification or recognition of solar radio bursts. The latest advances in deep learning technology provide an opportunity along this line of research. In this study, we develop a deep convolutional generative adversarial network model with conditional information (C-DCGAN) to auto-classify various types of solar radio bursts, using the solar radio spectral data from the Culgoora Observatory (1995, 2015) and the Learmonth Observatory (2001, 2019), in the metric decametric wavelengths. The technique generates pseudo images based on available data inputs, by modifying the layers of the generator and discriminator of the deep convolutional generative adversarial network. It is demonstrated that the C-DCGAN method can reach a high-level accuracy of auto-recognition of various types of solar radio bursts. And the issue caused by inadequate numbers of data samples and the consequent over-fitting issue has been partly resolved.
Introduction
Solar radio bursts are emission enhancements at radio wavelengths released during solar activities such as flares and coronal mass ejections (CMEs) [1]. They can be used to diagnose the properties of the associated solar activities and the underlying coronal conditions on the basis of the present understanding of emission mechanisms. For instance, many solar radio bursts observed in the metric wavelengths have been attributed to the plasma emission mechanism, according to which the emission frequency represents the fundamental or harmonic of plasma oscillation frequencies which are given by the plasma electron density. Thus, the radio data can be used to infer the plasma density in the corona [2, 3] and of the emission source such as coronal shocks.
Solar radio bursts in the metric wavelengths are classified into various types, including type I to V, according to their manifestation on the dynamic spectrum which presents the temporal variation of spectral intensities [4]. In Figure 1, we present examples of these five types of solar radio bursts observed by the Culgoora Observatory. The type I burst consists of two components, including the background continuum and short-term radio enhancements (called type I storm). The type II burst represents narrow-band drifting structures in the dynamic spectrum, generally attributed to energetic electrons accelerated around coronal shocks. The type III burst has fast-drifting features on the dynamic spectrum, usually attributed to fast, energetic electrons releasing from the flare reconnection site and escaping outward (or inwards) along field lines. They are called as the type III storm if they occur in groups over an extended interval. The type IV burst represents a wideband continuum on the dynamic spectrum, which can be further classified into two subgroups, including stationary ones and moving ones. The type V burst occurs immediately after the type III burst while occupying a wider spectral regime than the type III burst; it is generally attributed to energetic electrons that are strongly scattered by coronal waves.

FIGURE 1. Examples of type I–type V solar radio bursts observed in the metric decametric wavelengths (A–E). The spectra used in this study are obtained from the Australian Bureau of Meteorology’s Culgoora Observatory and Learmonth Observatory (http://www.sws.bom.gov.au/World_Data_Centre/1/9). The Culgoora Observatory monitors solar radio bursts in the frequency range 18–1800 MHz, and the Learmonth Observatory radio observatory monitors solar radio bursts in the range 25–180 MHz.
Radio spectral data with high temporal and spectral resolutions are important for scientific research of solar radio bursts. To demonstrate the present status of the field using such data, in the following, we just present two examples of studies on the temporal delay of solar spikes. Using the spectral data (with a temporal resolution of 10 ms and a spectral resolution of 100 kHz) from the Chashan Solar Observatory (CSO) operated by Shandong University, Feng et al. [5] found that the time delay between harmonics of solar radio spikes could be as small as the temporal resolution of the data (∼10 ms), while in an earlier study, Bouratzis et al. (2016) found that the duration of metric radio spikes is ∼60 ms according to an analysis of 12,000 events [6] (see Chernov et al. [7] for more studies on radio fine structures using high-resolution spectral data).
In addition to the increased resolution of the data, the number of solar radio observatories also increased around the world. For example, the Expanded Owens Valley Solar Array (EOVSA) [8] is operating in the frequency range of 1–18 GHz. Mingantu Spectral Radioheliograph (MUSER) [9] generates nearly 3.5 TB data per day. Chashan Solar Observatory (CSO) [6] operated by Shandong University obtains up to 300 GB of data per day. This results in a rapid increase of data volume waiting to be classified and analyzed.
Similar to many other data-intensive scientific research works, solar astronomy has benefited from interdisciplinary study with computer science and information technology. In particular, the rapid development of deep learning technology has provided new avenues in astronomical research.
The deep neural network (DNN) [10], as a functional unit of the deep learning technology, has been designed to learn how human beings think and recognize objects on the basis of hierarchical layer structures. It represents one of the most important advancements in the developments of machine-learning algorithms and has been applied to many research fields when processing a large amount of data. In the field of image processing and computer vision, the convolutional neural network (CNN) [11] becomes the most popular deep-learning method, which is composed of convolution filters to extract information from the input datasets automatically without any human intervention, while traditional machine-learning algorithms require researchers to manually select and construct these extractors [12]. This great advantage is very useful, especially when being applied to research problems without sufficient knowledge or the problems are just too complex to build a “good” simplified model.
Deep learning technology has been applied to the classification of solar radio bursts in the last decade. For example, Gu et al. [13] used a combination of principal component analysis (PCA) and support vector machine (SVM) for the mentioned purpose, yet the obtained accuracy of recognition needs to be improved. To do this, Chen et al. [14] applied the multimodal network to auto-classify types of radio bursts, and later, they also tried the method of the deep belief network (DBN) [15] and the convolutional neural network (CNN) [16]. In addition, Yu et al. [17] classified the solar radio data by using the long short-term memory network (LSTM) and obtained some improvement of the classification accuracy.
Nevertheless, to train a neural network model to a satisfactory level, a large amount of data is needed along with manual labeling and the input of the classifying information. This is usually very time-consuming. In addition, the occurrence numbers of different types of radio bursts are very different from each other. For example, the numbers of type IV and V bursts are significantly less than the other types of radio bursts. The main aim of this study is to utilize a proper deep learning algorithm to resolve the issue caused by an insufficient dataset. This is achieved by applying the method of the generative adversarial network (GAN) [18].
GAN has received a lot of attention since its emergence. It [11] introduces the idea of game theory into the training process, in which generator and discriminator are trained alternatively to learn the major characteristics of the data. Its neural network structure greatly enhances the capability in generating samples to provide more dataset when training the classification network.
GAN can be further extended to a conditional model (CGAN) if both the generator and discriminator are conditioned on some extra information (c). Condition c can be fed into both the discriminator and generator as additional input information [19]. In addition, the GAN model is further improved as the deep convolutional generative adversarial network (DCGAN) to increase the quality of image fitting through the confrontation learning of the generating model and the discriminating model [20]. This potentially increases the number of samples. These generated samples are then used together with the original dataset for training purpose.
In this study, we develop a novel machine-learning program, the conditional deep convolutional generative adversarial network (C-DCGAN) model, on the basis of the DCGAN model, to automatically classify solar radio bursts observed by the Culgoora Observatory from 1995 to 2015 and the Learmonth Observatory from 2001 to 2019. The model has been tested using the MNIST dataset. The results demonstrate that the C-DCGAN method can capture the major characteristics of each type of solar radio bursts and yield a satisfactory level of recognition accuracy of these bursts. The following section presents the details of the model and the dataset. Section Results of Automatic Identification of Solar Radio Bursts With C-DCGAN shows the classification results with the C-DCGAN method. The Discussion and Conclusions are given in the last section.
The C-DCGAN Model and the Dataset of Solar Radio Bursts
In this section, we present the technical details of the C-DCGAN model, the dataset of solar radio bursts, and how we use the data to train our model for the purpose of auto-recognition of the types of bursts.
C-DCGAN Model
The C-DCGAN model is a combination of two networks, CGAN and DCGAN. In comparison to the initial GAN model, CGAN performs better in generating categories of images, while DCGAN is better in generating artificial images. Specific conditions, for example, types of radio bursts of the sample spectra, are supplied to the C-DCGAN model during the training process. This allows the model to generate images representative of any type of radio bursts, which will be used in the deep learning process.
In Figure 2, we present the basic structure of the network. It can be seen that the C-DCGAN includes three major modules including the classifier which is a convolutional neural network used to classify and identify the different types of solar radio bursts, the generator (G), and the discriminator (D). G and D are trained in an adversarial manner; in other words, G is designed to generate artificial images as real as possible, while D tries to differentiate the real and fake inputs. And the classifier tries to classify all available datasets including real data and those generated by G, designed to get the most optimized outputs. Through their competition, D can proceed effectively, and the over-fitting issue caused by insufficient dataset can be largely avoided, while the classification accuracy can be improved, as shown by the following results.
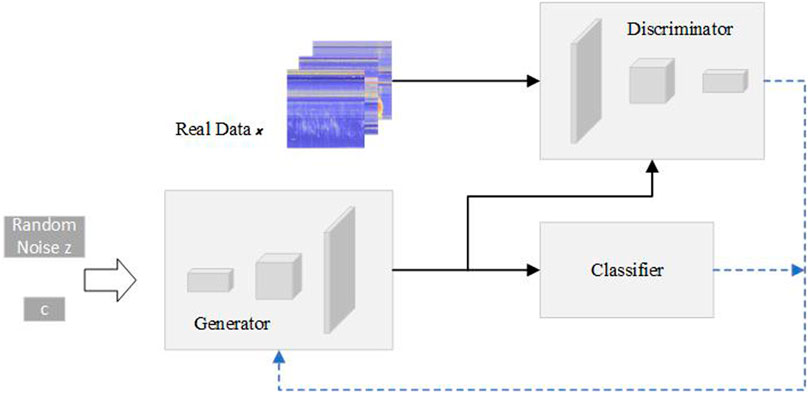
FIGURE 2. Structure of the C-DCGAN model, including three major modules: the classifier, the discriminator (D), and the generator (G) (see text for details).
The distribution of the real data (x) is taken to be
where V (D, G) represents the loss functions of G and D, and E represents the expected value. And x represents the real sample, D (
Dataset of Solar Radio Bursts
The dynamic spectral data of solar radio bursts recorded by the Culgoora Observatory from 1995 to 2015 and the Learmonth Observatory from 2001 to 2019 are used to train the C-DCGAN model. The horizontal axis and vertical axis of a map of the dynamic spectrum are time and frequency, respectively. The online data are represented with JPEG format of images with different dimensions in pixels that are 600 × 1750 for Culgoora and 300 × 1700 for Learmonth. These spectral data should be preprocessed before inputting them into the model.
First, we rebind both datasets into the resolution of 128 × 128. The event lasting longer than 60 min will be downsampled to 128 × 128, and the event shorter than 60 min will be upsampled to 128 × 128. This does not affect the statistical properties of the data significantly [16], according to Figure 3, which presents the comparison before and after the rebinding, in particular, the downsampling process. The comparison of the histogram of the original and the downsampled images indicates that the data preprocessing does not change their statistical properties significantly.
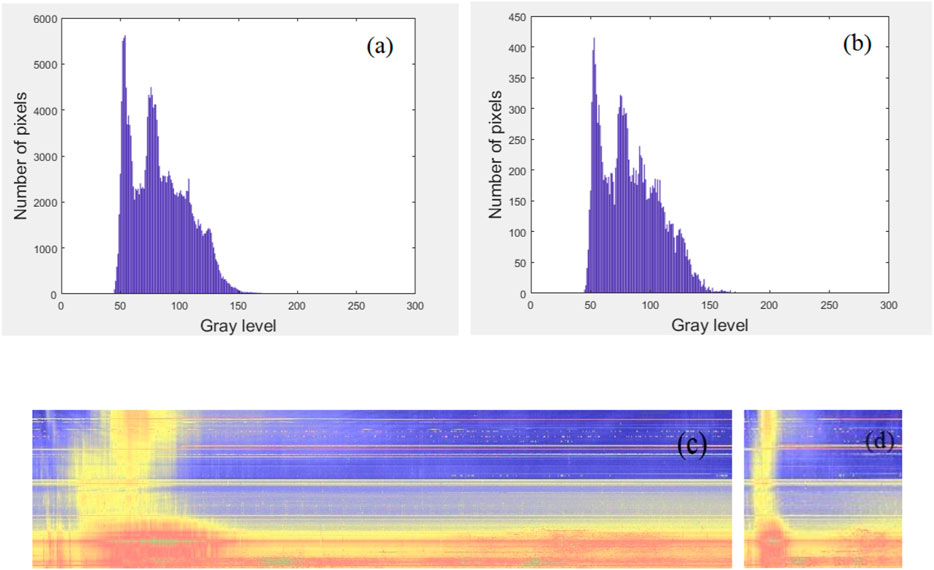
FIGURE 3. Solar radio spectrograms and histograms before and after downsampling for the event of 2005 August 22 observed by the Learmonth. (A) Histogram before downsampling, (B) histogram after downsampling, (C) original solar radio image, and (D) downsampled solar radio image.
To increase the recognition accuracy, we further remove events that are incomplete and with mixing types of bursts according to the online log files of the data. We end up with a data sample including 36,005 burst images, of which 7,201 are used in the testing process (see Table 1 for a list of the numbers of various types of radio bursts used here). It can be seen that type III burst has the largest sample numbers, while type I burst from Learmonth and type V burst from Culgoora have the least number of samples. Note that only 4 events are included for type V burst for Culgoora. This affects the performance of our model, as will be discussed later.
The Training Process
The model was run on GPU arrays of the NVIDIA GeForce quadro RTX 8000; the training process lasts up to 43 h. When the training data are not enough to provide a good estimate of the distribution of the entire data, in other words, the model is overtrained and leads to over-fitting of the data; we employ the dropout method. Typically, the outputs of neurons are set to zero with a probability of p in the training stage and multiplied with
We use the MNIST (Modified National Institute of Standards and Technology) dataset to evaluate the performance of the model, which is a large database of handwritten digits commonly used for similar training purpose. It has 60,000 training samples and 10,000 test samples. Figures 4A–D show the variation of the generated image samples with training epochs. Figure 4E shows the variety of the loss functions of both D and G. It can be seen that the original data image can be well replicated within 200 epochs, while at the earlier epochs (<100), the loss values show large oscillations. And the loss values after Epoch 100 remain below 0.5.
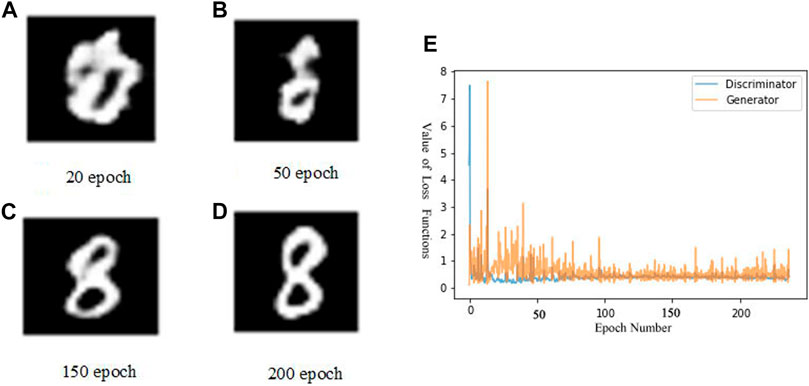
FIGURE 4. Testing the C-DCGAN model with the MNIST dataset. (A–D) shows the C-DCGAN generated data at Epochs 20, 50, 150, and 200. (E) The values of the loss functions versus epoch number for D and G.
The Recognition Process
The process of image recognition is done through the following steps: 1) we fix the parameters of G while keeping the accuracy of D as high as possible, 2) the parameters of D are fixed while optimizing the output of G so that the discrepancies between the generated data and the real data are sufficiently small, 3) the above two steps are conducted repeatedly until the model achieves high-enough accuracy of image recognition, and 4) the discriminator is extracted from the trained C-DCGAN model to form a new structure of recognition. Both the samples generated by G and the real samples are taken as inputs to the classifier.
Results of Automatic Identification of Solar Radio Bursts With C-DCGAN
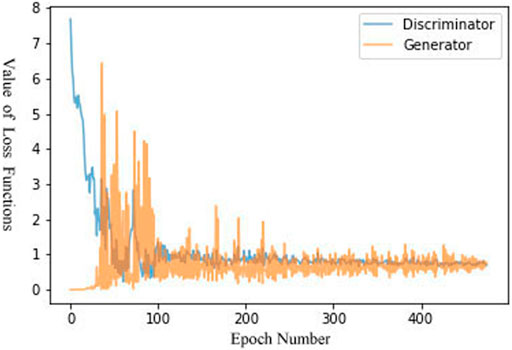
In total, 28,804 solar radio spectral data images were used as the “real part” of the training sample; those images of data generated by the generator were also used. The loss functions of both D (the discriminator) and G (the generator) are plotted in Figure 5 as a function of the epoch number of the training process. It can be seen that the value of the loss function of G is rather small at the start while that of D is rather large. With increasing the epoch number, say, after Epoch 30, the two values manifest strong oscillations, indicating the occurrence of confrontation. After Epoch 100, both values of loss function remain mostly below 1, indicating the gradual stabilization of the two networks. They remain largely below 0.8 after Epoch 250, indicating the data generated by G can be hardly discriminated from real data by D; in other words, these generated data contain most, if not all, essential features of the real data.
Examples of the generated data images, at different numbers of epochs from 50 to 300, for the five types of solar radio bursts observed in the metric decametric wavelengths are shown in Figure 6. At the early stage of the training (before Epoch 100), the generated images are rather blurred; with increasing numbers of epoch (after Epoch 200), the generated images become very similar to those observed for the same type of radio burst, indicating the success of the data-generating process. This mostly resolves the issue of insufficient data sample and the consequent over-fitting problem of earlier network models and improves the performance of our model as will be demonstrated soon.
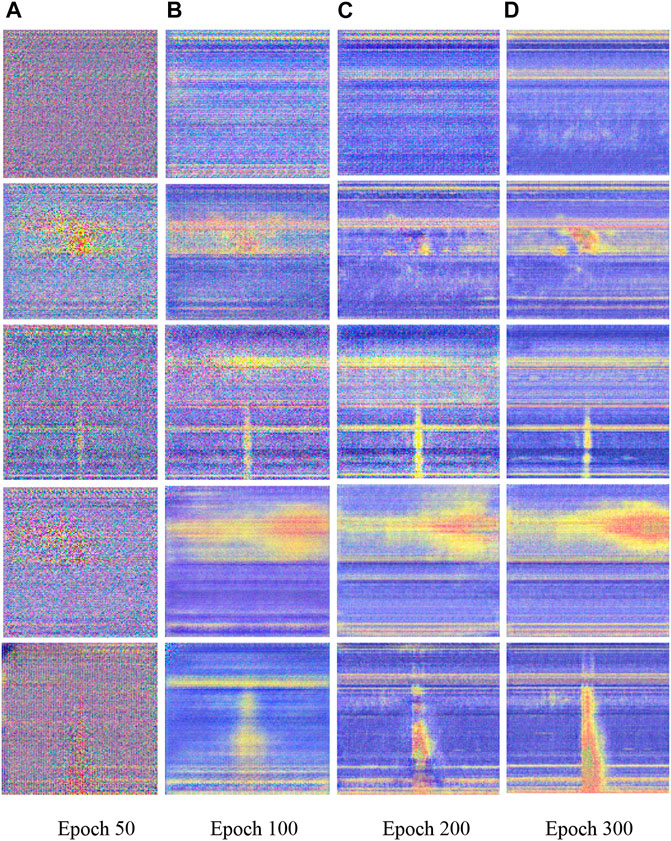
FIGURE 6. C-GCGAN generated data images of the five types of solar radio bursts at different epoch numbers (50–300). Panels from top to bottom correspond to type I to type V bursts.
Table 2 presents the identification accuracy of different types of metric decametric solar radio bursts. It can be seen that the accuracy of type III identification is the highest, reaching above 91% for both datasets (91.97% for Learmonth and 91.06% for Culgoora). The accuracy for type IV also has a high rate of 89.32% for Learmonth and 89.16% for Culgoora. This is likely due to the easy-to-identify features of the two bursts, in comparison to others. For example, type III is a very rapidly drifting feature with high brightness, while type IV is a long-duration wideband continuum. In addition, type III bursts usually last for less than 60 min; thus, they are not affected much by the downsampling preprocessing. The recognition accuracy of type I and type II bursts is relatively low, around 85%, while that for type V bursts are the lowest (84.79% for Learmonth and 81.43% for Culgoora). This is likely due to the smaller number of events in the sample for these bursts. Note that only 4 spectra are available for type V bursts from Culgoora; thus, C-DCGAN cannot catch the full features of the burst. This indicates that although C-DCGAN can largely resolve the inadequate data problem, its performance is yet to improve when the number of samples is too low. The average identification accuracy for the five types of radio bursts for Learmonth is higher than that for Culgoora, mainly because the sample data from Learmonth are more balanced among different types of bursts than those from Culgoora.

TABLE 2. Accuracy of identification of different types of radio bursts according to the C-DCGAN model.
To further look into the causes of false recognition, we present three such examples in Figure 7. They were all misidentified as type V bursts. The event in Figure 7A was classified as a type III event according to the online log file of the Learmonth Observatory (yet it could be classified as a type V event from our perspective); the event in Figure 7B was classified as a type II event, according to the online log file (yet it should be classified as a mixing-type event with both type III and type II bursts), and the last event is a type III burst (should be classified as a type III storm event). Since type V usually takes place after type III burst, in this case, they coexist as mixing events in one spectral data. In addition, due to their similar morphology, type V could be easily misidentified as type III, or the two bursts are not separable in many events. According to our method of data selection, we have removed the events of mixing types of bursts. This contributes to the insufficient number of type V bursts used in the training process and affects the accuracy of our model.
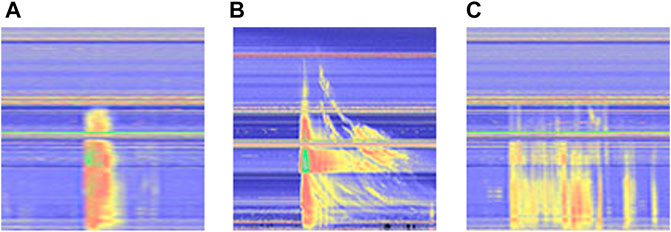
FIGURE 7. Three cases that have been misidentified as type V by C-GCGAN. According to the online data log file, (A) has been classified as type III, (B) as type III, and (C) as type III.
Conclusion and Discussion
Observations and studies of solar radio bursts are important to our understanding of the physics of solar activities and relevant space weather science as well as the physics of plasma radiation in both astrophysics and space science. With the increasing volume of data, it becomes timely and demanding to develop techniques that can classify various types of solar radio bursts automatically.
To do this, we developed a C-DCGAN model combining two networks including the conditional generative adversarial network (CGAN) and the deep convolutional generative adversarial network (DCGAN). The main motivation is to resolve the issue caused by inadequate numbers of data samples and the consequent over-fitting issue. The database of solar radio bursts recorded by the Learmonth and the Culggora observatories consists of 36,005 events. We concluded that the C-DCGAN performs well for type III and IV bursts, reaching identification accuracy as high as 89–92%; for type I and type II bursts, the accuracy reaches around 85%, while for type V burst, the accuracy is the lowest, being below 85%.
The results show that our C-DCGAN model can satisfactorily generate artificial data images from a small set of data and potentially expand the size of the data sample. This is important for the better performance of our model over others published earlier [16] and represents a novel way in the auto-classification of solar radio bursts using the deep learning technology.
There exist two major limitations of the present model that should be overcome in the future: 1) downsampling of the data may lose some critical information of the original data and thus affect the accuracy of the recognition; 2) the strong signal of radio interference may become the major features of a radio spectrum in some cases; thus, further studies should consider either to remove these signals from the spectra or learn their major characteristics so as to identify them.
Data Availability Statement
The original contributions presented in the study are included in the article/Supplementary Material; further inquiries can be directed to the corresponding author.
Author Contributions
WZ was the experimental designer and conductor of the experimental study, completed the data analysis, and wrote the first draft of the article. FH, RH, and EL were involved in the experimental design and analysis of the results. FY and YC were the conceptualizers and leaders of the project, directing the experimental design, and data analysis. WZ is responsible for the revision and improvement of the thesis. All authors have read and agreed to the final text.
Funding
This project was supported by the National Natural Science Foundation of China (41774180, 11803017), Shandong postdoctoral innovation project (202002004), the China Postdoctoral Science Foundation (2019M652385), and Young Scholars Program of Shandong University, Weihai (20820201005).
Conflict of Interest
The authors declare that the research was conducted in the absence of any commercial or financial relationships that could be construed as a potential conflict of interest.
Publisher’s Note
All claims expressed in this article are solely those of the authors and do not necessarily represent those of their affiliated organizations, or those of the publisher, the editors, and the reviewers. Any product that may be evaluated in this article, or claim that may be made by its manufacturer, is not guaranteed or endorsed by the publisher.
References
1. Bouratzis C, Hillaris A, Alissandrakis CE, Preka-Papadema P, Moussas X, Caroubalos C, et al. Fine Structure of Metric Type IV Radio Bursts Observed with the ARTEMIS-IV Radio-Spectrograph: Association with Flares and Coronal Mass Ejections. Sol Phys (2015) 290:219–86. doi:10.1007/s11207-014-0562-2
2. Chen Y. A Review of Recent Studies on Coronal Dynamics: Streamers, Coronal Mass Ejections, and Their Interactions. Chin Sci Bull (2013) 5(14):1599. doi:10.1007/s11434-013-5669-6
3. Chen Y, Du G, Feng L, Feng S, Kong X, Guo F, et al. A Solar Type Ii Radio Burst from Coronal Mass Ejection-Coronal Ray Interaction: Simultaneous Radio and Extreme Ultraviolet Imaging. Astrophysical. J. (2014) 787:59. doi:10.1088/0004-637x/787/1/59
4. Gary DE, Keller CU. Solar, and Space Weather Radiophysics―Current Status and Future Developments, 314. Dordrecht: Astrophysics and Space Science LibraryKluwer Academic (2004).
5. Feng SW, Chen Y, Kong XL, Li G, Song HQ, Feng XS, et al. Diagnostics on the Source Properties of a Type Ii Radio Burst with Spectral Bumps. Astrophysical. J. (2013) 767:29. doi:10.1088/0004-637x/767/1/29
6. Feng SW, Chen Y, Li CY. Harmonics of Solar Radio Spikes at Metric Wavelengths. Solar Phys (2018) 293:39. doi:10.1007/s11207-018-1263-z
7. Chernov PG. Fine Structure of Solar Radio Bursts. Springer Berlin Heidelberg (2011). doi:10.1007/978-3-642-20015-1
8. Gary D. E, Chen B, Dennis B. R. G. D, Hurford GJ, Krucker S, McTiernan JM, et al. Microwave and Hard X-Ray Observations of the 2017 September 10 Solar Limb Flare [J]. Astrophysical J 863:83. doi:10.3847/1538-4357/aad0ef
9. Yan Y, Chen L, Yu S. First Radio Burst Imaging Observation from Mingantu Ultrawide Spectral Radioheliograph. Proc IAU (2015) 11:427–35. doi:10.1017/s174392131600051x
10. Tang X-L, Yi-Ming D, Liu Y-W, Jia-Xin LI, Ma Y-W. Image Recognition with Conditional Deep Convolutional Generative Adversarial Networks. Acta Automatica. Sinica (2018) 44(5):855–64. doi:10.16383/j.aas.2018.c170470
11. He K, Zhang X, Ren S. “Deep Residual Learning for Image Recognition [J].” in 2016 IEEE Conference on Computer Vision and Pattern Recognition (CVPR) (2016) 770–8. doi:10.1109/CVPR.2016.90
12. Jin LW, Zhong ZY, Yang Z, Yang WX, Xie ZC, Sun J. Applications of Deep Learning for Handwritten Chinese Character Recognition [J]: a Review. Acta Automatica Sinica (2016) 42(8):1125–41. doi:10.16383/j.aas.2016.c150725
13. Gu B, Sheng VS, Tay KY, Romano W, Li S. Incremental Support Vector Learning for Ordinal Regression. IEEE Trans Neural Netw Learn Syst. (2015) 26(7):1403–16. doi:10.1109/tnnls.2014.2342533
14. Chen Z, Ma L, Xu L, Tan C, Yan Y. Imaging and Representation Learning of Solar Radio Spectrums for Classification. Multimed Tools Appl (2016) 75(5):2859–75. doi:10.1007/s11042-015-2528-2
15. Chen Z, Ma L, Xu L, Weng Y, Yan Y. Multimodal Learning for Classification of Solar Radio Spectrum [C]. IEEE Int Conf Syst Man, Cybernetics (2015) 1035–40. doi:10.1109/SMC.2015.187
16. Xu L, Yan Y-H, Yu X-X, Zhang W-Q, Chen J, Duan L-Y. LSTM Neural Network for Solar Radio Spectrum Classification. Res Astron Astrophys (2019) 19(9):135. doi:10.1088/1674–4527/19/9/135
17. Yu X, Xu L, Ma L. Solar Radio Spectrum Classification with LSTM [C]. IEEE International Conference on Multimedia & Expo Workshops. IEEE (2017). p. 519–24.
18. Goodfellow I, Pouget-Abadie J, Warde-Farley D, Ozair S, Courville A, Bengio Y. Generative Adversarial Nets [C]. Advances in Neural Information Processing Systems (2014). p. 2672–80.
19. Mirza M, Osindero S. Conditional Generative Adversarial Nets [J]. arXiv preprint arXiv:1411.1784 (2014). Available at: https://ui.adsabs.harvard.edu/abs/2014arXiv1411.1784M/abstract.
20. Radford A, Metz L, Chintala S. Unsupervised Representation Learning with Deep Convolutional Generative Adversarial Networks [J]. arXiv preprint arXiv:1511.06434 (2015). Available at: https://ui.adsabs.harvard.edu/abs/2015arXiv151106434R/abstract.
Keywords: deep learning, deep convolution generation confrontation network, image reconstruction, convolutional neural networks, space weather
Citation: Zhang W, Yan F, Han F, He R, Li E, Wu Z and Chen Y (2021) Auto Recognition of Solar Radio Bursts Using the C-DCGAN Method. Front. Phys. 9:646556. doi: 10.3389/fphy.2021.646556
Received: 27 December 2020; Accepted: 19 July 2021;
Published: 01 September 2021.
Edited by:
Qiang Hu, University of Alabama in Huntsville, United StatesReviewed by:
Jiajia Liu, Queen’s University Belfast, United KingdomSijie Yu, New Jersey Institute of Technology, United States
Copyright © 2021 Zhang, Yan, Han, He, Li, Wu and Chen. This is an open-access article distributed under the terms of the Creative Commons Attribution License (CC BY). The use, distribution or reproduction in other forums is permitted, provided the original author(s) and the copyright owner(s) are credited and that the original publication in this journal is cited, in accordance with accepted academic practice. No use, distribution or reproduction is permitted which does not comply with these terms.
*Correspondence: Fabao Yan, aGpjLTg1NTVAc2R1LmVkdS5jbg==
 Weidan Zhang1
 Fabao Yan
 Enze Li
 Yao Chen
