 Christopher A. Browne
 Daniel B. Amchin
 Joanna Schneider
 Sujit S. Datta
- Department of Chemical and Biological Engineering, Princeton University, Princeton, NJ, United States
Models of disease spreading are critical for predicting infection growth in a population and evaluating public health policies. However, standard models typically represent the dynamics of disease transmission between individuals using macroscopic parameters that do not accurately represent person-to-person variability. To address this issue, we present a dynamic network model that provides a straightforward way to incorporate both disease transmission dynamics at the individual scale as well as the full spatiotemporal history of infection at the population scale. We find that disease spreads through a social network as a traveling wave of infection, followed by a traveling wave of recovery, with the onset and dynamics of spreading determined by the interplay between disease transmission and recovery. We use these insights to develop a scaling theory that predicts the dynamics of infection for diverse diseases and populations. Furthermore, we show how spatial heterogeneities in susceptibility to infection can either exacerbate or quell the spread of disease, depending on its infectivity. Ultimately, our dynamic network approach provides a simple way to model disease spreading that unifies previous findings and can be generalized to diverse diseases, containment strategies, seasonal conditions, and community structures.
Introduction
Epidemic spreads—such as the 1918 flu, HIV/AIDS, and COVID-19 pandemics—highlight the critical importance of infectious disease modeling in our everyday lives. Mathematical models can provide key insights into the process by which disease is transmitted between individuals, help to forecast how a disease will continue to spread through a population, and assess the efficacy of different interventions. Developing accurate, computationally-tractable, and generally-applicable models of disease spreading is therefore of critical importance to public health.
The dynamics of infectious disease spreading are often modeled using compartmental models [1, 2] that employ the framework of reaction kinetics. For example, in one representation, members of a population are divided into three intermixed groups: those who are susceptible to infection (S), currently infected (I), or recovered from infection (R), with transitions from S → I and I → R occurring at prescribed rates. This standard model, known as the SIR model or the SI model in the absence of recovery, can successfully predict the initial exponential and eventual logistic dynamics of the total amount of infection in a population for many diseases [3–6]. Thus, the SIR model provides a useful approach for disease modeling that is well-established.
However, a notable omission of this model is that it does not consider the discrete, spatially-separated interactions between members of a population. Instead, it assumes a well-mixed population for which the crucial dynamics of disease transmission between individuals are lumped into the basic reproduction number R0, a macroscopic parameter describing the mean number of secondary transmissions from each infection. In practice, this quantity is used as a fitting parameter—limiting projection capabilities when the interactions between individuals change even slightly [7–12]. A recent example highlighting this deficiency is the spread of COVID-19 in China: containment policies imposing spatial barriers and suppressing individual interactions are thought to have hindered exponential growth of infection, yet this pivotal effect cannot be captured by the classic SIR model without invoking additional fitting parameters [13].
To address this issue, sophisticated extensions of this model have been developed to explicitly incorporate spatial variations in spreading [2, 14–35]. For example, in one approach, different subpopulations—each modeled using different SIR dynamics—are coupled together [2, 36–38]. While powerful, this approach still employs lumped parameters for each subpopulation that do not explicitly consider differences between discrete individuals. Percolation theory provides another powerful way to explore disease spreading throughout a social network composed of discrete, spatially-separated individuals, yielding insights into the onset of disease spreading and the size of disease outbreaks [16–35, 39]. Nevertheless, models based on this approach also suffer from limitations: they typically either do not consider the dynamics of disease spreading and only treat the final stage of infection, or they also describe the dynamics of disease transmission using an ad hoc macroscopic parameter that aggregates the influence of random and uncorrelated individual interactions. However, transmission is known to depend sensitively on the full history of infection, on specific individual behaviors [40] including social distancing [13, 23, 24, 32, 41, 42], and on interactions between different social networks [39]. Thus, the ability to accurately predict the temporal evolution of active infections in an overall population, as well as the full spatiotemporal features of disease spreading, remains limited.
Here, we build on this previous work to develop an infection percolation framework to model infectious disease spreading by applying SIR dynamics to discrete interactions between members of a population. Our framework explicitly considers the full spatiotemporal history of infection as well as individual interactions in describing the spatial variation and individual dynamics of disease transmission. Simulations employing this framework show that disease spreads through a social network as a traveling wave of infection, followed by a traveling wave of recovery—consistent with previous predictions obtained using analytical SIR modeling [19, 43, 44]. Analysis of these waves reveals general features of the total number of infections, maximal number of active infections, and the temporal evolution of active infections in a population, and clarifies how these features are determined by the interplay between disease transmission and recovery—consistent with the results of previous percolation simulations [45]. Our framework therefore provides a simple way to unify different findings previously obtained using disparate modeling approaches, and helps to clarify how disease spreading manifests for different diseases and containment strategies. Finally, as an example of how our framework can help to go beyond typical models of well-mixed populations that do not incorporate possible correlations in individual behavior, we demonstrate how disease spreading is strongly altered in a spatially heterogeneous social network.
Results
Development of the Dynamic Network Model
Our approach is inspired by dynamic network modeling of fluid-driven transport in heterogeneous media, which similarly seeks to predict spatiotemporal features of spreading in complex settings [46–57]. We represent members of a population, all of whom are initially susceptible to infection, by sites of a network that are connected by bonds representing pairwise interactions between them (section Methods). We describe the intrinsic infectivity of a given disease throughout this network by the parameter P*, where a high value of P* characterizes a highly infectious disease. Crucially, each interaction between individuals ij is characterized by its own barrier to disease transmission Pth,ij [58]; this threshold explicitly describes the propensity of individual i, if infected, to transmit the disease to the susceptible individual j, and depends on individual behaviors such as social distancing between i and j [13, 23, 32, 42]. Furthermore, if individuals i and j are infected and susceptible, respectively, the duration of disease transmission from i to j is given by Δτij; at the population scale, the mean of all the Δτij can be thought of as the inverse of a macroscopic disease transmission rate. However, in what follows, we will describe our results in terms of the time durations, since our model utilizes the time duration, not rate, in calculations of different transmission events between individuals.
Previous studies indicate that disease is transmitted between individuals more rapidly, with shorter Δτij, for stronger infections P* and reduced barriers to transmission Pth,ij [59–69]. We therefore propose the ansatz that disease is only transmitted if , with a transmission time , where f monotonically increases from 0 to 1 and τ0 is a characteristic minimal transmission time. This feature contrasts with previous percolation-based models, which often assume that the individual disease transmission times and barriers to disease transmission are either constant or drawn from two independent distributions. Instead, by explicit linking the individual Δτij and Pth,ij, our work provides a way to analyze the competing roles of individual disease infectivity and susceptibility in influencing population-scale disease spreading, as we show below.
Finally, as in the classic SIR model, we introduce the recovery duration τr,i after which individual i, if infected, transitions to a recovered state and can no longer infect other individuals. The mean of this quantity can be thought of as the inverse of a macroscopic infection recovery rate. However, in what follows, we will describe our results in terms of the recovery duration—again, because our model utilizes the time duration, not rate, in calculations of different recovery events.
In non-dimensional form, these control parameters—the infectivity, individual barriers to infection, disease transmission times, and recovery duration—are then represented by the parameters , , , and , respectively, where Pth,max is the maximal value of Pth,ij in the population. Thus, this framework parses the role of a macroscopic transmission rate or reproduction number R0 into appropriate parameters that are globally constant for a particular disease and parameters that vary by individual, providing a systematic way to incorporate measurable spreading parameters to model populations with spatial heterogeneities.
As a first step toward exploring the spatiotemporal features of disease spreading in this framework, we construct two-dimensional (2D) simulations implementing these deterministic rules. We represent the social network as a static square lattice with sites, though exploring more complex networks with small world and scale-free features [20, 70–72] will be an important direction for future work. The disease is introduced at the central site at time . For simplicity, we take the barriers to disease transmission to be undirected, with ; however, directed transmission is known to dramatically change disease spreading in some networks, and will be useful to explore in future implementations [40]. The have randomly assigned values that are chosen from a uniform distribution—and kept fixed for all computations performed for a given distribution—though we later test other distributions as well. We describe the individual dynamics of disease transmission using the simplest linear function, , and take recovery to be an intrinsic property of a given disease, with set to a constant value throughout the lattice network.
Infection Percolation in a Recovery-Free Population
We first investigate the recovery-free case with . For a disease with low infectivity, , only a small subset of individual interactions lead to transmission; thus, a large portion of the population becomes inaccessible to infection, and disease spreading is localized (Supplementary Movie 1)—reminiscent of subcritical bond percolation. For sufficiently high infectivity, however, a sufficient number of individual interactions permit transmission for the disease to spread throughout the population—reminiscent of supercritical bond percolation. The example of (Supplementary Movie 2) is shown at an intermediate time in Figure 1A. For this infectivity, the disease spreads in a spatially heterogeneous, ramified pattern, reminiscent of supercritical bond percolation near the percolation threshold. This heterogeneous spreading leads to the formation of discrete clusters of bypassed individuals who remain uninfected (white in Figure 1A). For diseases of higher infectivity, disease spreading is more compact: the leading front of the infected population becomes more smooth, resulting in fewer and smaller uninfected clusters, as shown for the example of in Figure 1B and Supplementary Movie 3. Clearly, disease infectivity strongly influences the spatiotemporal features of spreading.
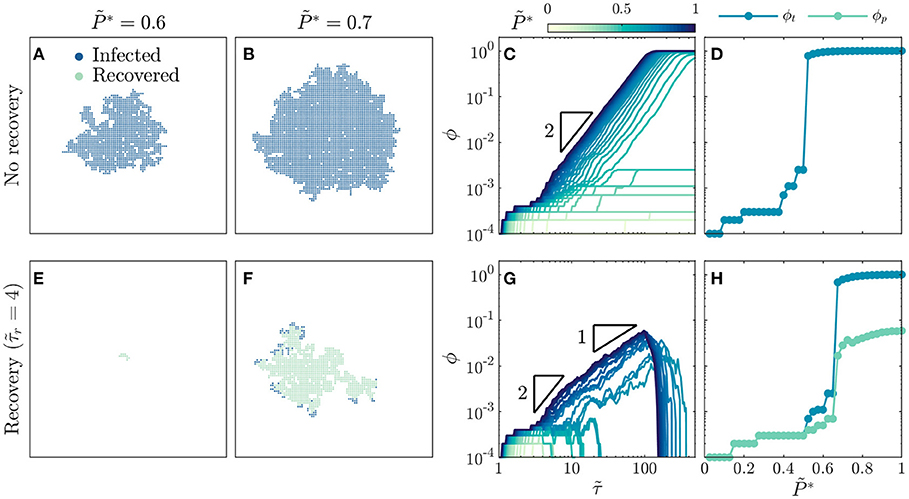
Figure 1. Recovery suppresses the onset and dynamics of disease spreading. For a population without recovery: (A) A disease with intermediate infectivity spreads in a spatially heterogeneous, ramified pattern, while (B) a disease with higher infectivity spreads in a more compact region. (C) Growth of infected fraction ϕ over time is hindered for diseases with low infectivity, but exhibits a generic quadratic scaling over time as indicated by the triangle, which eventually plateaus near unity for diseases with infectivity above a critical value. Infection growth is slower as decreases. (D) Total infected fraction ϕt exhibits an abrupt increase above a critical infectivity, , indicating a percolation transition to an epidemic. For a population with recovery after : (E) A disease with intermediate infectivity remains localized and does not spread, while (F) a disease with higher infectivity spreads in a spatially heterogeneous, ramified pattern. (G) Growth of infected fraction ϕ over time is hindered for diseases with low infectivity, but exhibits a generic quadratic scaling at intermediate times and linear scaling at longer times as indicated by the triangles, before reaching a peak value ϕp before dropping rapidly to zero for diseases with infectivity above a critical value. Infection growth is slower as decreases. (H) Total infected fraction ϕt and peak infected fraction ϕp, which represent the total infected fraction at the end of a given simulation and the maximal infected fraction during the simulation, respectively, both exhibit an abrupt increase above a critical infectivity, , that is larger than the recovery-free case—indicating that recovery suppresses the percolation transition to an epidemic. Images in (A,B,E,F) are for the same time . All data are for a uniform distribution of individual interaction barriers . Each curve in (C,G) and each point in (D,H) represents a separate simulation, all of which preserve the same lattice network structure of the and only vary and , enabling us to systematically test the influence of these two key parameters on disease spreading.
To gain further insight into disease spreading, we repeat these simulations for a broad range of , and characterize the infection growth dynamics by measuring the time-dependent infected fraction of the population, ϕ. We again observe a bifurcation in infection behavior. For low infectivity, the disease spreads slowly (light curves in Figure 1C), ultimately only infecting a total fraction ϕt ≪ 1 (points with in Figure 1D). By contrast, for sufficiently high infectivity, the disease spreads rapidly with (dark curves in Figure 1C), ultimately infecting nearly the entire population (points for in Figure 1D). The abrupt onset of rapid spreading throughout the population at a critical infectivity again suggests that disease spreading can be described as a dynamic process of percolation through infected bonds, consistent with previous calculations [17, 18, 20–35, 39]. This suggestion is further confirmed by the value of , which coincides with the critical probability of bond percolation on the 2D square lattice [34, 73, 74]. We find no discernible difference in these results when the simulations are performed with lattice networks that are up to two orders of magnitude larger (Supplementary Figure 1), suggesting that our results are not strongly sensitive to finite-size effects.
Why does infection growth show quadratic scaling in time for ? At the leading front of the infected population, new individuals are infected over a range of transmission times , leading to heterogeneous disease spreading. However, as increases, a greater proportion of disease transmission between individuals occurs in the shortest possible time τ0, corresponding to , resulting in more compact spreading (Figure 1B). Hence, the leading front of the infected population spreads radially outward on the 2D social network lattice at a maximal rate of 1 new individual per τ0, therefore spanning an overall region with a maximal radius of individuals. The maximal infected fraction of the population is then given directly by the area of this infected region: , consistent with a previous result in percolation theory [75] and yielding the quadratic scaling shown in Figure 1C. As this infected region spreads, it eventually reaches the boundary and spans the entire population at a shortest possible time of (SI text)—in good agreement with the onset of the plateau in ϕ at for the highest shown in Figure 1C. As decreases, we expect that the infected region spreads at a slower rate, as a greater proportion of disease transmission occurs at —also in good agreement with the variation of the curves in Figure 1C. The variability in these curves reflects the increasing importance of the variability in the individual barriers; different simulations employing different choices of the randomly-chosen would yield slightly different dynamics. However, in all cases, we expect that decreasing leads to slower transmission as a greater proportion of disease transmission occurs at .
Infection Percolation in a Population With Recovery
How do these results change when infected individuals can recover? To address this question, we perform the same simulations as in Figures 1A–D, but with . This modification markedly alters disease spreading. For , the spread of disease is quickly quenched by recovery [31], and only a few individuals are ever infected (Figure 1E, Supplementary Movie 4). Thus, even above the critical infectivity for percolation in the recovery-free case, , recovery gives rise to subcritical spreading behavior. For a higher infectivity of , the disease does continue to spread, eventually reaching the boundaries of the population as in supercritical bond percolation. However, unlike the recovery-free case, it does so in a spatially heterogeneous, ramified pattern (Figure 1F, Supplementary Movie 5). Close inspection of the spatiotemporal pattern of infection and recovery reveals the underlying cause: recovery of infected individuals before they can transmit the disease shields clusters of individuals who would have otherwise been infected, as exemplified by the large uninfected region in the top right of Figure 1F, which was heavily infected in the recovery-free case shown in Figure 1B. Together, these results hint that recovery suppresses infection percolation. The competition between infection and recovery also drastically alters the time evolution of the infected fraction ϕ. For low infectivity, recovery is sufficiently fast to quench the spread of disease (light curves in Figure 1G). As a result, the total fraction of the population ever infected ϕt ≪ 1 (points with in Figure 1H). By contrast, for sufficiently high infectivity, the disease initially spreads rapidly, first with as in the recovery-free case and then with (dark curves in Figure 1G). As time progresses ϕ eventually reaches a peak value ϕp before dropping rapidly to zero as the entire population recovers. Both ϕt and ϕp increase precipitously above the critical infectivity (Figure 1H), again indicating that recovery suppresses infection percolation. Again, the variability in the curves in Figure 1G reflects the variability in the individual barriers; different simulations employing different choices of the randomly-chosen would yield slightly different dynamics. However, in all cases, we expect that decreasing leads to slower transmission as a greater proportion of disease transmission occurs at .
To further explore the competition between infection and recovery, we inspect the spatiotemporal patterns of both using simulations performed at several different values of and , with snapshots all taken at shown in Figure 2. For a large value of , the critical infectivity for percolation is ; for slightly above this value, disease spreading is heterogeneous, with recovered individuals again shielding clusters of individuals who would have otherwise been infected (Figure 2A). For even higher , disease spreading becomes more compact (Figures 2B,C). Moreover, the leading front of the infected population is trailed by an inner compact region of recovery, leading to the formation of a wide circular pulse of infection that travels outward through the population (dark blue region in Figures 2B,C). This feature is notably similar to the traveling pulses of infection predicted by extensions of the classic SIR model [19, 43, 44]—highlighting the ability of our framework to reproduce previously-reported continuum-scale phenomena. We observe similar behavior at smaller values of , but shifted to increased values of (Figures 2D–I): recovery can increasingly quench the spread of disease as it becomes faster relative to infection transmission. As a result, the critical infectivity for percolation, , shifts to higher values (thick green line in Figure 2), further confirming that recovery suppresses infection percolation. Recovery also strongly impacts the number of infected individuals: as decreases, the thickness of the pulse of infected individuals decreases (compare Figures 2C,F,I).
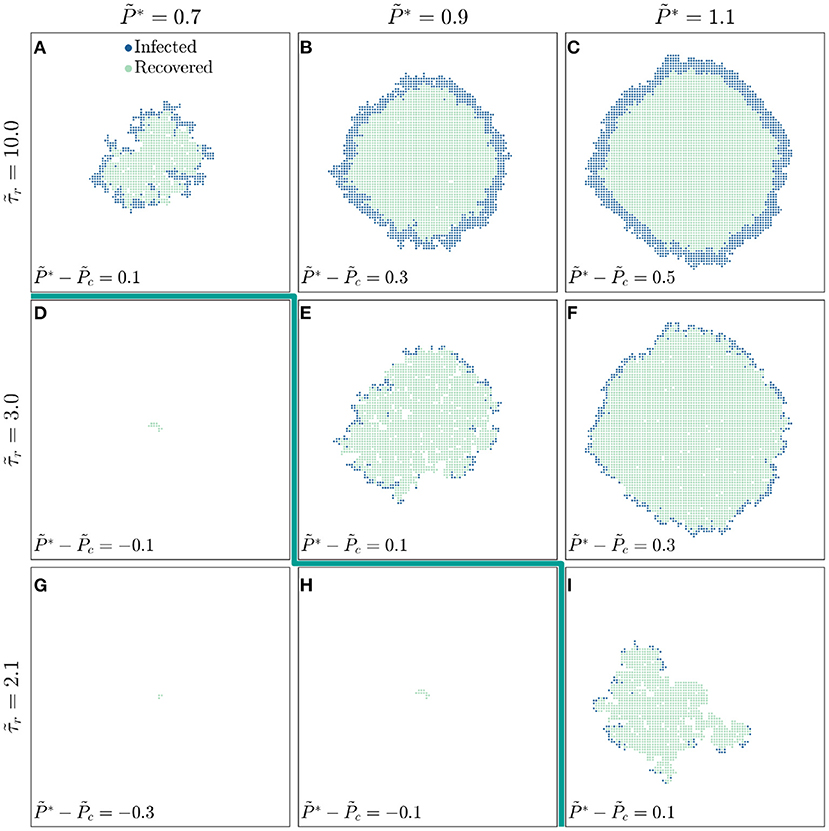
Figure 2. The competition between infection and recovery determines the onset and pattern of disease spreading. For a population with a longer recovery duration , (A) a disease with lower infectivity spreads in a ramified pattern, while diseases with higher infectivities and 1.1 (B,C) spread in a more compact manner. The leading front of the infected population is trailed by an inner region of recovery, leading to the formation of a circular traveling pulse of infection. For a shorter recovery duration of , (D,E) the threshold infectivity for appreciable disease spreading is larger, and (E,F) the pulse of infection is thinner. These effects are even more pronounced for the shortest recovery duration of , as shown in (G–I). The thick green line indicates the transition to infection percolation. All images are shown for the same time and all data are for a uniform distribution of individual interaction barriers preserving the same lattice network structure of the throughout, thus demonstrating how varying and influences disease spreading.
These results demonstrate the key influence of recovery on disease spreading; we therefore examine the underlying model further to develop and test analytical relations that confirm the internal consistency of our simulations. We first focus on the observation that faster recovery can quench the spread of disease. At the leading front of the infected population, new individuals are infected only when the infection transmission time is shorter than the recovery time ; otherwise, an infected individual recovers from the disease before they are able to transmit it to a neighbor. Thus, only individual interactions with can transmit disease. For a disease to continually spread throughout the population, a sufficient number of these interactions must permit disease transmission, as given by the critical probability of bond percolation ; that is, infection percolates only when . The critical infectivity in a population with recovery is then directly given by the relation
which increases with : faster recovery suppresses infection percolation. This dependence is in good agreement with the shift in the critical infectivity shown in Figures 1D,H and by the thick green line in Figure 2.
To further confirm the internal consistency of our simulations, we explore values of spanning nearly two orders of magnitude. For each simulation, we vary the disease infectivity and identify the critical infectivity at which the total fraction of the population ever infected ϕt abruptly increases, similar to the curves shown in Figures 1D,H. Consistent with our expectation, all the data for different show similar growth when plotted as a function of the shifted (Figure 3A). Moreover, the variation of the critical infectivity with shows excellent agreement with Equation 1 (dashed line, Figure 3A inset).
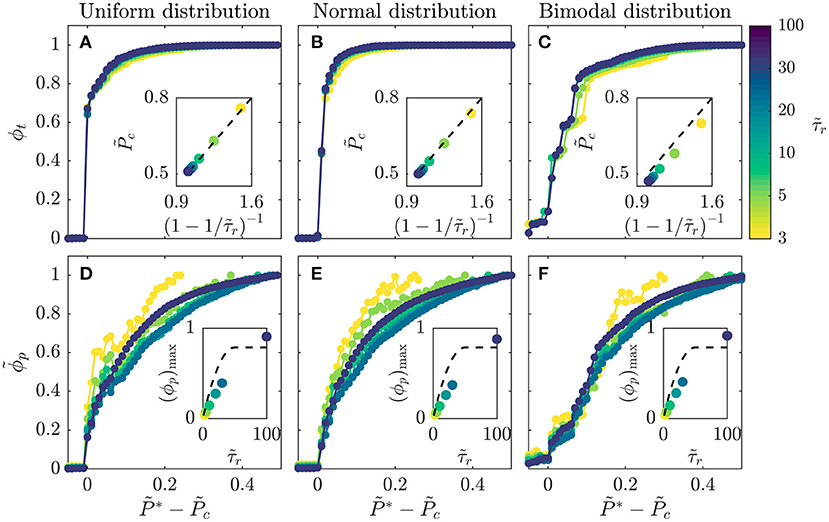
Figure 3. Amount of infection shows a general dependence on disease infectivity across populations with different recovery durations and distributions of individual interaction barriers. (A–C) Data for the total infected fraction ϕt align when plotted as a function of the shifted disease infectivity ; insets show that the critical infectivity is given by the relation in Equation (1) (dashed lines). (D–F) Data for the rescaled peak infected fraction show reasonable alignment when plotted as a function of the shifted disease infectivity ; insets show that the theoretical calculated using Equation (2) (dashed lines) provides a reasonable approximation to the maximal peak fraction (ϕp)max determined for . Intriguingly, all the datasets appear to approximately converge as increases. All three distributions span ; the normal distribution is centered at 0.5 and has standard deviation = 0.25, while the bimodal is constructed from two normal distributions centered at 0 and 1, both with standard deviation = 0.25. Each point represents a separate simulation, all of which preserve the same lattice network structure of the for a given distribution and only vary and , enabling us to systematically test the influence of these two key parameters on disease spreading.
Finally, we test the generality of this relation by exploring two other distributions of : a normal distribution, representing a population with random and uncorrelated interactions whose variation is distributed about a single mean value, and a bimodal distribution, representing a population with distinct high-risk and low-risk subpopulations arising from, for example, differences in compliance with public health interventions. Our central findings that the onset and dynamics of disease spreading are regulated by the interplay between disease transmission and recovery are consistent across the different distributions tested. Specifically, for all the distributions tested, we observe a similar abrupt increase in ϕt with above a critical infectivity , with excellent alignment of all the data for different (Figures 3A–C). In all cases, the value of determined shows close agreement with Equation (1) (Figures 3A–C insets). A bimodal population in which half of the contacts between members maintain high barriers to transmission while the other interspersed connections do not—such as through strong or weak social distancing, respectively—has slightly less than this relation, indicating that it is slightly more susceptible to infection.
General Scaling of Infection Growth Dynamics
We next focus on the observation that, for high , the leading front of the infected population is trailed by an inner region of recovery. At the leading front of the infected population, the shortest possible disease transmission time is again ; therefore, the leading front spans an overall region with a maximal radius of individuals, as in the recovery-free case. For short times , these individuals have not yet recovered; hence, we expect that again in this regime, in agreement with the short-time quadratic scaling shown in Figure 1G as well as the recovery-free quadratic scaling shown in Figure 1C. At longer times , infected individuals begin to recover, forming an inner region of recovery. The leading front of this region spreads at the same rate as the leading front of the infected population; however, it only spans a maximal radius of individuals. The maximal infected fraction of the population is then given by the area between the leading fronts of the infected and recovered populations: , yielding the measured intermediate-time linear scaling (Figure 1G). Furthermore, as the infected region spreads, it eventually reaches the boundary, followed by the growing region of recovery later. We therefore expect that the infected fraction ϕ will peak at a time before dropping rapidly and reaching zero at , corresponding to and , respectively, for (SI text)—in good agreement with the results shown in Figure 1G. Together, these calculations yield a general expression for the full time evolution of the infected fraction of a population in the limit of high well above the threshold Pc, in excellent agreement with the data shown in Figure 1G:
As decreases, we again expect that the infected region spreads at a slower rate, prolonging —also in good agreement with the different curves shown in Figure 1G.
Equation (2) also provides an approximation of the peak infected fraction, , in the limit of high ; for the case of , we estimate ϕp ≈ 0.1, consistent with the data shown in Figure 1G. To further examine this relation, we analyze the results of all the simulations described in Figure 3 with varying . For each simulation, we determine the maximal value of ϕp, (ϕp)max, at , the highest value tested. Consistent with our expectation, calculated using Equation (2) (dashed line, Figure 3D inset), provides a reasonable approximation to the measured (ϕp)max (data points, Figure 3D inset). Furthermore, all the data for show reasonable alignment when plotted as a function of the shifted (Figure 3D), with some deviation for the smallest likely arising from geometric effects not taken into account in our simple estimate of . We again test the generality of these results by exploring their applicability to a normal distribution and a bimodal distribution of ; the results are closely similar in all three cases (Figures 3D–F). Taken together, all of the results shown in Figures 1–3 support the validity of our scaling relations.
As a final exploration of these relations, we use all of our simulations to directly test the general expression for the infected fraction ϕ given by Equation (2). All of the data collapse onto this scaling curve for all values of and distributions of tested (Figures 4A–C). Furthermore, the peak in ϕ and its eventual drop to zero occur at values of close to the predicted values and , respectively. Thus, the close agreement between all the data and the theoretical prediction confirm the internal consistency of our simulations with the scaling relations. We note that the analytical expression represents the solution for the high infectivity limit with high ; however, as indicated by the data in Figures 1G, 4A–C, it provides a good approximation for the spreading dynamics of a broad range of diseases with . Intriguingly, similar quadratic power-law scalings have been reported for the initial regional epidemic spreads of COVID-19 [13], though explaining the full dynamics of this pandemic involves additional complexities that we do not consider here.
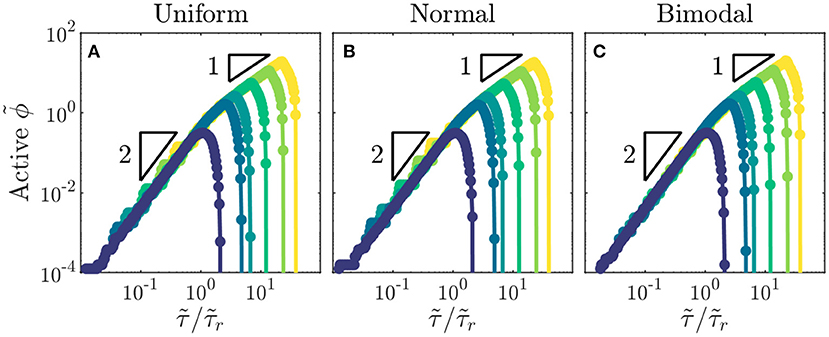
Figure 4. Total fraction of active infections in a population shows general dynamics across populations with different recovery durations and distributions of individual interaction barriers. (A–C) Growth of rescaled infected fraction with rescaled time shows general quadratic to linear scaling as indicated by the triangles, followed by a drop to zero at . Data shown are for the largest disease infectivity tested, . Distributions of individual interaction barriers and colors indicating different recovery durations are the same as in Figure 3. Each point represents a separate simulation, all of which preserve the same lattice network structure of the for a given distribution and only vary .
Extension to Spatially Heterogeneous Networks
While our simple implementation thus far considered distributions of that were homogeneously mixed over the social network lattice, our framework allows for spatially heterogeneous networks to be constructed to model disease spreading in specific community structures [8, 9, 76]. As an example of this idea, we test disease spreading from the boundary between two stratified subpopulations, each on a separate lattice with a different mean , representing differences in susceptibility to infection that can arise from differences in containment strategies or in socioeconomic factors [3, 8–10]. Depending on the viral infectivity , we find that stratification can either markedly exacerbate or hinder the overall amount of infection, and the total amount of infection in each subpopulation, compared to the homogeneously-mixed case (Figure 5). Specifically, for diseases of intermediate infectivity, disease spreading is stronger in the stratified population—the total infected fraction ϕt is two orders of magnitude larger than in the homogeneously-mixed case—due to the earlier onset of infection percolation in the more susceptible subpopulation. However, for diseases of higher infectivity, disease spreading is slightly stronger in the homogeneously-mixed population; in the stratified case, the less susceptible subpopulation buffers against continued spread of disease. These results exemplify how our framework provides a way to directly assess the critical role played by community structure in the spread of disease. More extreme forms of heterogeneity—for example with small-world connections between subpopulations, or power law distributions in susceptibility—can easily be incorporated within this framework, and will be an interesting direction for future research. For example, as suggested in previous work [44], we anticipate that long-range connections between regions with disparate susceptibilities will increasingly fragment traveling waves of infection.
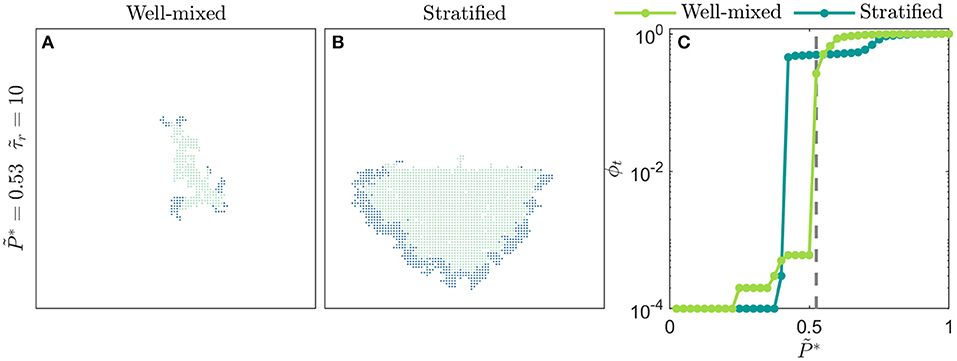
Figure 5. Spatial heterogeneity strongly alters disease spreading. (A) Homogeneously-mixed population i.e., the distribution of is bimodal, constructed from two normal distributions centered at 0 and 1, both with standard deviation = 0.25, and with values randomly distributed through the lattice network. In this case, the disease slowly spreads through the population in a spatially heterogeneous manner. (B) Stratified population with the exact same overall distribution of , but with the individuals comprising the normal distributions centered at 0 (more susceptible) and 1 (less susceptible) isolated to the bottom and top halves of the lattice network, respectively. In this case, disease spreading is dramatically worsened; the total amount of infection is larger than the homogeneously-mixed case. Moreover, disease spreading is stronger in the more susceptible subpopulation and is weaker in the less susceptible subpopulation. Images show the case of a disease with infectivity , a population with recovery duration =10, and time . (C) Variation of the total infected fraction ϕt with the disease infectivity for both populations. For diseases of intermediate infectivity, to 0.55, disease spreading is stronger in the stratified population. For diseases of higher infectivity, to 0.85, disease spreading is stronger in the homogeneously-mixed population. Each point represents a separate simulation, all of which preserve the same lattice network structure of the for either the homogeneously-mixed or stratified case and only vary . Dashed line indicates , corresponding to the images in (A,B).
Discussion
The framework presented here provides a direct way to merge the temporal dynamics underlying the classic SIR model with a network representation of all the discrete interactions between members of a population. We demonstrate this principle using 2D lattice simulations implementing a simplified form of this framework. Our simulations reveal that, for diverse diseases and populations, disease spreading can be understood as a process of infection percolation through a social network. By testing different recovery durations and distributions of individual interaction parameters, we find that the onset and dynamics of spreading are determined by the interplay between disease transmission and recovery at the scale of individual interactions. This finding thus builds on the rich body of previous work exploring disease spreading through the lens of percolation theory [16–35].
Guided by these insights, we develop a scaling theory that yields general predictions for the total number of infections, maximal number of active infections, and the temporal evolution of active infections in a population. Importantly, our scaling theory clarifies how these predictions can be applied to different diseases, with varying infectivities and recovery durations , and different populations, with varying distributions of the individual barriers to interaction e.g., due to different implementations of containment strategies like social distancing.
Our simulations represent a first step toward implementing this framework. Thus, we have necessarily made a number of simplifying assumptions that can be relaxed in future extensions of this work. For example, our simulations consider a social network represented by a static, 2D, square lattice—while in reality, social networks are dynamic and have more complex structures. While previous work suggests that the assumption of a static network may not greatly alter disease spreading [34], our framework can be implemented on dynamically-changing networks using a time-dependent matrix of individual interactions . Furthermore, while previous work suggests that disease spreading is well-approximated by spreading on a 2D network covering the Earth's surface [22, 77, 78], networks of different dimensionality d can also be implemented—which would result in a more general form of Equation (2) with at short times and at longer times. Previous work also suggests that social networks can have broadly-distributed degree distributions [20, 72], small world connections [70, 71], or multiple layers [39] unlike the fixed 2D connectivity of our lattice; moreover, disease transmission can occur among groups, not just pairs of individuals, which would require consideration of a network with higher-order interactions [79]. Incorporating these features into our framework will be a valuable direction for future work. Indeed, the random long-range connections that arise in small-world networks could disrupt the traveling waves of infection and recovery we observed in our simple network, or even seed new traveling waves of infection and recovery, potentially leading to richer dynamics. Our treatment of individual interactions can also be extended in future work. For example, the barriers to disease transmission need not be undirected, and the recovery durations need not be constant throughout the network. Furthermore, our representation of the disease transmission function represents the simplest linear function, and can instead be replaced by a more complex form that incorporates the sophisticated dynamics of transmission specific to different diseases [80].
Our framework could also enable straightforward assessment of the efficacy of different public health policies. For example, the implementation of strong social distancing results in an increase in Pth,max, leading to a reduction in and hence a reduction in the peak infected fraction of the population, ϕp (Figures 3D–F)—consistent with previous work [10, 13, 81]. Alternatively, the development of better treatments shortening the recovery duration also leads to a reduction in the maximal peak infected fraction of the population, (ϕp)max (Figures 3D–F, insets); it also hastens the transition to slow linear scaling and eventual decline of infection growth (Figures 4A–C)—again consistent with previous work [41, 82]. The influence of other factors that are documented to impact disease spreading—e.g., seasonality of infectivity [11, 12, 83–87], heterogeneity in community susceptibility [8, 9], and targeted vaccination [10]—can also be evaluated through appropriate modifications to and . For example, targeted vaccination yielding perfect immunity is typically implemented by removing nodes from the network [10, 88]; in our framework, this could equivalently be accomplished by setting , therefore preventing further infection of a node, while imperfect immunization [89, 90] could alternatively be implemented through smaller increases in Pth,ij.
Methods
Implementation of the Network Model
We implement the dynamic network model in MATLAB. To define each 2D square lattice of 100 by 100 individuals (“nodes”), we specify node locations and an adjacency matrix characterizing the connectivity of the network. To ensure only one horizontally-oriented border between the two subpopulations in the stratified population shown in Figure 5, we employ a periodic boundary condition in the horizontal direction by connecting the first and last nodes in each row for all simulations; the nodes at the top and bottom boundaries do not have such conditions, ensuring that the vertical direction is non-periodic. For the bonds between nodes (“edges”), we randomly assign the values of the interaction barrier from a given distribution, as specified in the main text. Each simulation has a specified disease infectivity and recovery duration . From the values of and , we compute the discrete infection transmission times for each edge. The simulations shown in Figures 1, 2, 3A,D, 4A are for the exact same lattice with the exact same configuration of taken from a uniform distribution. Similarly, the simulations shown in Figures 3B,E, 4B are for the exact same lattice with the exact same configuration of taken from a normal distribution, and the simulations shown in Figures 3C,F, 4C are for the exact same lattice with the exact same configuration of taken from a bimodal distribution.
To perform each simulation, we use a modified invasion percolation algorithm based on the method described by Masson et al. [91]. We start at by introducing the disease at the central node of the lattice, with all the other nodes specified as being susceptible (S). Then, for the next and each successive time step of the simulation, we use a binary tree structure to sort all edges in contact with infected nodes and find the most susceptible edge ij—the edge with the minimal infection transmission time . The next node to become infected, j, is then the node that is connected to the infected region through this most susceptible edge. This target node is then specified as being infected (I), and its time of infection is specified by adding the time increment to the overall elapsed time . We also decrease the remaining transmission times for all edges in contact with infected nodes by this time increment. New edges made available for infection by node j are added to the binary tree; because the tree was mostly sorted in the last step, subsequent sorts are time-efficient. We incorporate recovery by identifying all infected nodes for which at least has elapsed since infection, setting its infection transmission time to all nodes connected to it as being equal to ∞, and specifying the node as being recovered (R).
Data Availability Statement
The original contributions presented in the study are included in the article/Supplementary Material, further inquiries can be directed to the corresponding author/s.
Author Contributions
CB, DA, and JS initiated the project. DA designed simulations. CB and JS performed all simulations. SD designed and performed the theoretical analysis and supervised the overall project. All authors designed the overall project, analyzed the data, discussed the results and implications, and wrote the manuscript.
Funding
This material is based upon work partially supported by the National Science Foundation Graduate Research Fellowship Program (to CB) under Grant No. DGE1656466. This publication was supported by the Princeton University Library Open Access Fund.
Disclaimer
Any opinions, findings, and conclusions or recommendations expressed in this material are those of the authors and do not necessarily reflect the views of the National Science Foundation.
Conflict of Interest
The authors declare that the research was conducted in the absence of any commercial or financial relationships that could be construed as a potential conflict of interest.
Acknowledgments
It is a pleasure to acknowledge Navid C.P.D. Bizmark for stimulating discussions.
Supplementary Material
The Supplementary Material for this article can be found online at: https://www.frontiersin.org/articles/10.3389/fphy.2021.645954/full#supplementary-material
References
1. Brauer F, Castillo-Chavez C, Feng Z. Simple compartmental models for disease transmission. Math Models Epidemiol. (2019) 69:21–61. doi: 10.1007/978-1-4939-9828-9_2
2. Brauer F, Castillo-Chavez C, Castillo-Chavez C. Mathematical Models in Population Biology and Epidemiology. Vol. 2. New York, NY: Springer-Verlag (2012).
3. Grassly NC, Fraser C. Mathematical models of infectious disease transmission. Nat Rev Microbiol. (2008) 6:477–87. doi: 10.1038/nrmicro1845
4. Ross R. An application of the theory of probabilities to the study of a priori pathometry.—Part I. Proc R Soc Lond Ser A. (1916) 92:204–30. doi: 10.1098/rspa.1916.0007
5. Kermack WO, McKendrick AG. A contribution to the mathematical theory of epidemics. Proc R Soc Lond Ser A. (1927) 115:700–21. doi: 10.1098/rspa.1927.0118
6. Okyere E, Oduro FT, Amponsah SK, Dontwi IK, Frempong NK. Fractional order SIR model with constant population. J Adv Math Comput Sci. (2016) 54:1–12. doi: 10.9734/BJMCS/2016/23017
7. Eckalbar JC, Eckalbar WL. Dynamics of an SIR model with vaccination dependent on past prevalence with high-order distributed delay. Biosystems. (2015) 129:50–65. doi: 10.1016/j.biosystems.2014.12.004
8. Glass K, Kappey J, Grenfell BT. The effect of heterogeneity in measles vaccination on population immunity. Epidemiol Infect. (2004) 132:675–83. doi: 10.1017/S0950268804002080
9. van den Hof S, Meffre C, Conyn-van Spaendonck M, Woonink F, de Melker HE, van Binnendijk RS. Measles outbreak in a community with very low vaccine coverage, the Netherlands. Emerg Infect Dis. (2001) 7(3 Suppl.):593. doi: 10.3201/eid0703.010343
10. Ball F, Lyne O. Optimal vaccination schemes for epidemics among a population of households, with application to variola minor in Brazil. Stat Methods Med Res. (2006) 15:481–97. doi: 10.1177/0962280206071643
11. Viboud C, Grais RF, Lafont ABA, Miller MA, Simonsen L. Multinational Influenza Seasonal Mortality Study Group: multinational impact of the 1968 Hong Kong influenza pandemic: evidence for a smoldering pandemic. J Infect Dis. (2005) 192:233–48. doi: 10.1086/431150
12. Kilbourne ED. Influenza pandemics of the 20th century. Emerg Infect Dis. (2006) 12:9. doi: 10.3201/eid1201.051254
13. Maier BF, Brockmann D. Effective containment explains subexponential growth in recent confirmed COVID-19 cases in China. Science. (2020) 368:742–6. doi: 10.1126/science.abb4557
14. Bailey NT. The Mathematical Theory of Infectious Diseases and Its Applications. High Wycombe: Bucks (1975).
15. Mollison D. Spatial contact models for ecological and epidemic spread. J R Stat Soc Ser B Methodol. (1977) 39:283–313. doi: 10.1111/j.2517-6161.1977.tb01627.x
16. Grassberger P. On the critical behavior of the general epidemic process and dynamical percolation. Math Biosci. (1983) 63:157–72. doi: 10.1016/0025-5564(82)90036-0
17. Bunde A, Herrmann HJ, Margolina A, Stanley HE. Universality classes for spreading phenomena: a new model with fixed static but continuously tunable kinetic exponents. Phys Rev Lett. (1985) 55:653. doi: 10.1103/PhysRevLett.55.653
18. Herrmann HJ. Geometrical cluster growth models and kinetic gelation. Phys Rep. (1986) 136:153–224. doi: 10.1016/0370-1573(86)90047-5
19. Grenfell BT, Bjørnstad ON, Kappey J. Travelling waves and spatial hierarchies in measles epidemics. Nature. (2001) 414:716–23. doi: 10.1038/414716a
20. May RM, Lloyd AL. Infection dynamics on scale-free networks. Phys Rev E. (2001) 64:066112. doi: 10.1103/PhysRevE.64.066112
21. Moreno Y, Pastor-Satorras R, Vespignani A. Epidemic outbreaks in complex heterogeneous networks. Eur Phys J B Condens Matter Complex Syst. (2002) 26:521–9. doi: 10.1140/epjb/e20020122
22. Newman ME, Jensen I, Ziff R. Percolation and epidemics in a two-dimensional small world. Phys Rev E. (2002) 65:021904. doi: 10.1103/PhysRevE.65.021904
23. Newman ME. Spread of epidemic disease on networks. Phys Rev E. (2002) 66:016128. doi: 10.1103/PhysRevE.66.016128
24. Lloyd-Smith JO, Schreiber SJ, Kopp PE, Getz WM. Superspreading and the effect of individual variation on disease emergence. Nature. (2005) 438:355–9. doi: 10.1038/nature04153
25. Miller JC. Epidemic size and probability in populations with heterogeneous infectivity and susceptibility. Phys Rev E. (2007) 76:010101. doi: 10.1103/PhysRevE.76.010101
26. Kenah E, Robins JM. Second look at the spread of epidemics on networks. Phys Rev E. (2007) 76:036113. doi: 10.1103/PhysRevE.76.036113
27. Trapman P. On analytical approaches to epidemics on networks. Theor Popul Biol. (2007) 71:160–73. doi: 10.1016/j.tpb.2006.11.002
28. Davis S, Trapman P, Leirs H, Begon M, Heesterbeek J. The abundance threshold for plague as a critical percolation phenomenon. Nature. (2008) 454:634–7. doi: 10.1038/nature07053
29. Lagorio C, Migueles M, Braunstein L, López E, Macri P. Effects of epidemic threshold definition on disease spread statistics. Phys A Stat Mech Appl. (2009) 388:755–63. doi: 10.1016/j.physa.2008.10.045
30. Parshani R, Carmi S, Havlin S. Epidemic threshold for the susceptible-infectious-susceptible model on random networks. Phys Rev Lett. (2010) 104:258701. doi: 10.1103/PhysRevLett.104.258701
31. Karrer B, Newman ME. Message passing approach for general epidemic models. Phys Rev E. (2010) 82:016101. doi: 10.1103/PhysRevE.82.016101
32. Neri FM, Bates A, Füchtbauer WS, Pérez-Reche FJ, Taraskin SN, Otten W, et al. The effect of heterogeneity on invasion in spatial epidemics: from theory to experimental evidence in a model system. PLoS Comput Biol. (2011) 7:e1002174. doi: 10.1371/journal.pcbi.1002174
33. Neri FM, Pérez-Reche FJ, Taraskin SN, Gilligan CA. Heterogeneity in susceptible–infected–removed (SIR) epidemics on lattices. J R Soc Interface. (2011) 8:201–9. doi: 10.1098/rsif.2010.0325
34. Ochab J, Góra P. Shift of percolation thresholds for epidemic spread between static and dynamic small-world networks. Eur Phys J B. (2011) 81:373. doi: 10.1140/epjb/e2011-10975-6
35. Wang W, Tang M, Stanley HE, Braunstein LA. Unification of theoretical approaches for epidemic spreading on complex networks. Rep Prog Phys. (2017) 80:036603. doi: 10.1088/1361-6633/aa5398
36. He D, Stone L. Spatio-temporal synchronization of recurrent epidemics. Proc R Soc Lond Ser B Biol Sci. (2003) 270:1519–26. doi: 10.1098/rspb.2003.2366
37. Arenas A, Cota W, Gómez-Gardeñes J, Gómez S, Granell C, Matamalas JT, et al. Modeling the spatiotemporal epidemic spreading of COVID-19 and the impact of mobility and social distancing interventions. Phys Rev X. (2020) 10:041055. doi: 10.1103/PhysRevX.10.041055
38. Brauer F, Castillo-Chavez C, Feng Z. Spatial structure in disease transmission models. Math Models Epidemiol. (2019) 69:457–76. doi: 10.1007/978-1-4939-9828-9_14
39. Zuzek LA, Stanley HE, Braunstein LA. Epidemic model with isolation in multilayer networks. Sci Rep. (2015) 5:12151. doi: 10.1038/srep12151
40. Olinky R, Stone L. Unexpected epidemic thresholds in heterogeneous networks: The role of disease transmission. Phys Rev E. (2004) 70:030902. doi: 10.1103/PhysRevE.70.030902
41. Peak CM, Childs LM, Grad YH, Buckee CO. Comparing nonpharmaceutical interventions for containing emerging epidemics. Proc Natl Acad Sci USA. (2017) 114:4023–8. doi: 10.1073/pnas.1616438114
42. Scherer C, Radchuk V, Franz M, Thulke HH, Lange M, Grimm V, et al. Moving infections: individual movement decisions drive disease persistence in spatially structured landscapes. Oikos. (2020) 129:651–67. doi: 10.1111/oik.07002
43. Ruan S. Spatial-temporal dynamics in nonlocal epidemiological models. In: Takeuchi Y, Iwasa Y, Sato K, eds Mathematics for Life Science and Medicine. Berlin, Heidelberg: Springer (2007). p. 97–122.
44. Lang JC, De Sterck H, Kaiser JL, Miller JC. Analytic models for SIR disease spread on random spatial networks. J Complex Netw. (2018) 6:948–70. doi: 10.1093/comnet/cny004
45. Capała K, Dybiec B. Epidemics spread in heterogeneous populations. Eur Phys J B. (2017) 90:85. doi: 10.1140/epjb/e2017-70723-6
47. Masson Y. A fast two-step algorithm for invasion percolation with trapping. Comput Geosci. (2016) 90:41–8. doi: 10.1016/j.cageo.2016.02.003
48. Lu NB, Browne CA, Amchin DB, Nunes JK, Datta SS. Controlling capillary fingering using pore size gradients in disordered media. Phys Rev Fluids. (2019) 4:084303. doi: 10.1103/PhysRevFluids.4.084303
49. Furuberg L, Feder J, Aharony A, Jøssang T. Dynamics of invasion percolation. Phys Rev Lett. (1988) 61:2117. doi: 10.1103/PhysRevLett.61.2117
50. Roux S, Guyon E. Temporal development of invasion percolation. J Phys A Math Gen. (1989) 22:3693. doi: 10.1088/0305-4470/22/17/034
51. Pietronero L, Schneider W, Stella A. Percolation and invasion percolation as fractal growth problems. Phys Rev A. (1990) 42:7496. doi: 10.1103/PhysRevA.42.7496
52. Moore C, Newman ME. Epidemics and percolation in small-world networks. Phys Rev E. (2000) 61:5678. doi: 10.1103/PhysRevE.61.5678
53. Warren C, Sander L, Sokolov I. Firewalls, disorder, and percolation in epidemics. arXiv preprint cond-mat/0106450 (2001).
54. Sander L, Warren C, Sokolov I, Simon C, Koopman J. Percolation on heterogeneous networks as a model for epidemics. Math Biosci. (2002) 180:293–305. doi: 10.1016/S0025-5564(02)00117-7
55. Sander L, Warren C, Sokolov I. Epidemics, disorder, and percolation. Phys A Stat Mech Appl. (2003) 325:1–8. doi: 10.1016/S0378-4371(03)00176-6
56. Miller JC. Percolation and epidemics in random clustered networks. Phys Rev E. (2009) 80:020901. doi: 10.1103/PhysRevE.80.020901
57. Massaro E, Bagnoli F. Epidemic spreading and risk perception in multiplex networks: a self-organized percolation method. Phys Rev E. (2014) 90:052817. doi: 10.1103/PhysRevE.90.052817
58. Cardy JL, Grassberger P. Epidemic models and percolation. J Phys A Math Gen. (1985) 18:L267. doi: 10.1088/0305-4470/18/6/001
59. Crepey P, Alvarez FP, Barthélemy M. Epidemic variability in complex networks. Phys Rev E. (2006) 73:046131. doi: 10.1103/PhysRevE.73.046131
60. Wearing HJ, Rohani P, Keeling MJ. Appropriate models for the management of infectious diseases. PLoS Med. (2005) 2:e174. doi: 10.1371/journal.pmed.0020174
61. Van Mieghem P, Van de Bovenkamp R. Non-Markovian infection spread dramatically alters the susceptible-infected-susceptible epidemic threshold in networks. Phys Rev Lett. (2013) 110:108701. doi: 10.1103/PhysRevLett.110.108701
62. Gómez G, Lagakos SW. Estimation of the infection time and latency distribution of AIDS with doubly censored data. Biometrics. (1994) 50:204–12. doi: 10.2307/2533210
63. Degruttola V, Lange N, Dafni U. Modeling the progression of HIV infection. J Am Stat Assoc. (1991) 86:569–77. doi: 10.1080/01621459.1991.10475081
64. Aldrin M, Storvik B, Frigessi A, Viljugrein H, Jansen PA. A stochastic model for the assessment of the transmission pathways of heart and skeleton muscle inflammation, pancreas disease and infectious salmon anaemia in marine fish farms in Norway. Prev Vet Med. (2010) 93:51–61. doi: 10.1016/j.prevetmed.2009.09.010
65. Kristoffersen A, Viljugrein H, Kongtorp R, Brun E, Jansen P. Risk factors for pancreas disease (PD) outbreaks in farmed atlantic salmon and rainbow trout in Norway during 2003–2007. Prev Vet Med. (2009) 90:127–36. doi: 10.1016/j.prevetmed.2009.04.003
66. Stene A, Viljugrein H, Yndestad H, Tavornpanich S, Skjerve E. Transmission dynamics of pancreas disease (PD) in a Norwegian fjord: aspects of water transport, contact networks and infection pressure among salmon farms. J Fish Dis. (2014) 37:123–34. doi: 10.1111/jfd.12090
67. Tran V, Moser LA, Poole DS, Mehle A. Highly sensitive real-time in vivo imaging of an influenza reporter virus reveals dynamics of replication and spread. J Virol. (2013) 87:13321–9. doi: 10.1128/JVI.02381-13
68. Yun T, Park A, Hill TE, Pernet O, Beaty SM, Juelich TL, et al. Efficient reverse genetics reveals genetic determinants of budding and fusogenic differences between Nipah and Hendra viruses and enables real-time monitoring of viral spread in small animal models of henipavirus infection. J Virol. (2015) 89:1242–53. doi: 10.1128/JVI.02583-14
69. Karlsson EA, Meliopoulos VA, Savage C, Livingston B, Mehle A, Schultz-Cherry S. Visualizing real-time influenza virus infection, transmission and protection in ferrets. Nat Commun. (2015) 6:1–10. doi: 10.1038/ncomms7378
70. Watts DJ, Strogatz SH. Collective dynamics of ‘small-world' networks. Nature. (1998) 393:440–2. doi: 10.1038/30918
72. Barabási AL. Scale-free networks: a decade and beyond. Science. (2009)325:412–3. doi: 10.1126/science.1173299
73. Kesten H, et al. The critical probability of bond percolation on the square lattice equals 1/2. Commun Math Phys. (1980) 74:41–59. doi: 10.1007/BF01197577
74. McCarthy J. Invasion percolation on a random lattice. J Phys A Math Gen. (1987) 20:3465. doi: 10.1088/0305-4470/20/11/047
76. Guimera R, Danon L, Diaz-Guilera A, Giralt F, Arenas A. Self-similar community structure in a network of human interactions. Phys Rev E. (2003) 68:065103. doi: 10.1103/PhysRevE.68.065103
77. Bailey DJ, Otten W, Gilligan CA. Saprotrophic invasion by the soil-borne fungal plant pathogen Rhizoctonia solani and percolation thresholds. New Phytol. (2000) 146:535–44. doi: 10.1046/j.1469-8137.2000.00660.x
78. Otten W, Bailey DJ, Gilligan CA. Empirical evidence of spatial thresholds to control invasion of fungal parasites and saprotrophs. New Phytol. (2004) 163:125–32. doi: 10.1111/j.1469-8137.2004.01086.x
79. Matamalas JT, Gómez S, Arenas A. Abrupt phase transition of epidemic spreading in simplicial complexes. Phys Rev Res. (2020) 2:012049. doi: 10.1103/PhysRevResearch.2.012049
80. Woolhouse M, Shaw D, Matthews L, Liu WC, Mellor D, Thomas M. Epidemiological implications of the contact network structure for cattle farms and the 20–80 rule. Biol Lett. (2005) 1:350–2. doi: 10.1098/rsbl.2005.0331
81. Valdez LD, Buono C, Macri PA, Braunstein L. Social distancing strategies against disease spreading. Fractals. (2013) 21:1350019. doi: 10.1142/S0218348X13500199
82. Chen L, Xiong J, Bao L, Shi Y. Convalescent plasma as a potential therapy for COVID-19. Lancet Infect Dis. (2020) 20:398–400. doi: 10.1016/S1473-3099(20)30141-9
83. Koelle K, Pascual M, Yunus M. Pathogen adaptation to seasonal forcing and climate change. Proc R Soc B Biol Sci. (2005) 272:971–7. doi: 10.1098/rspb.2004.3043
84. Shaman J, Pitzer VE, Viboud C, Grenfell BT, Lipsitch M. Absolute humidity and the seasonal onset of influenza in the continental United States. PLoS Biol. (2010) 8:e1000316. doi: 10.1371/journal.pbio.1000316
85. Moore SM, Monaghan A, Griffith KS, Apangu T, Mead PS, Eisen RJ. Improvement of disease prediction and modeling through the use of meteorological ensembles: human plague in Uganda. PLoS ONE. (2012) 7:e44431. doi: 10.1371/journal.pone.0044431
86. Kissler SM, Tedijanto C, Goldstein E, Grad YH, Lipsitch M. Projecting the transmission dynamics of SARS-CoV-2 through the postpandemic period. Science. (2020) 368:860–8. doi: 10.1126/science.abb5793
87. Stone L, Olinky R, Huppert A. Seasonal dynamics of recurrent epidemics. Nature. (2007) 446:533–6. doi: 10.1038/nature05638
88. Wang Z, Bauch CT, Bhattacharyya S, d'Onofrio A, Manfredi P, Perc M, et al. Statistical physics of vaccination. Phys Rep. (2016) 664:1–113. doi: 10.1016/j.physrep.2016.10.006
89. McLean AR, Blower SM. Imperfect vaccines and herd immunity to HIV. Proc R Soc Lond Ser B Biol Sci. (1993) 253:9–13. doi: 10.1098/rspb.1993.0075
90. Halloran ME, Struchiner CJ, Spielman A. Modeling malaria vaccines II: population effects of stage-specific malaria vaccines dependent on natural boosting. Math Biosci. (1989) 94:115–49. doi: 10.1016/0025-5564(89)90074-6
Keywords: percolation, epidemic, network model, scaling, susceptible-infected-recovered model
Citation: Browne CA, Amchin DB, Schneider J and Datta SS (2021) Infection Percolation: A Dynamic Network Model of Disease Spreading. Front. Phys. 9:645954. doi: 10.3389/fphy.2021.645954
Received: 24 December 2020; Accepted: 17 March 2021;
Published: 16 April 2021.
Edited by:
Naoki Masuda, University at Buffalo, United StatesReviewed by:
Homayoun Hamedmoghadam, Monash University, AustraliaMatteo Beccaria, University of Salento, Italy
Copyright © 2021 Browne, Amchin, Schneider and Datta. This is an open-access article distributed under the terms of the Creative Commons Attribution License (CC BY). The use, distribution or reproduction in other forums is permitted, provided the original author(s) and the copyright owner(s) are credited and that the original publication in this journal is cited, in accordance with accepted academic practice. No use, distribution or reproduction is permitted which does not comply with these terms.
*Correspondence: Sujit S. Datta, c3NkYXR0YUBwcmluY2V0b24uZWR1
†These authors have contributed equally to this work