- Prokhorov General Physics Institute of the Russian Academy of Sciences, Moscow, Russia
In this work, a technique for comparing refractive indices for solutions of low concentrations has been developed. The method of direct spectral detection developed by the authors has been using. The solutions of low and ultra-low NaCl concentrations were compared with each other, as well as with the respective water controls. The solutions were prepared using the method of serial dilution with different types of mixing at each step: conventional stirring or intensive shaking. Measurements were made for water solutions of NaCl subjected to 6–12 and 30 hundredfold dilution, as well as for water controls, i.e. water subjected to the same technological procedure as the tested salt solutions.
Introduction
It is known that the properties of low-concentration aqueous solutions have attracted great interest in recent years [1–3]. These studies require the use of modern spectroscopic or mass spectroscopic equipment. This is a rather laborious and costly procedure. There are no such disadvantages in an interferometric fiber-optic sensor, which combines a simple design, small dimensions and high sensitivity. The measured value of the interferometer optical path difference is proportional to the refractive index of the medium. One of the necessary conditions for the use of such systems is the development of a precise and reliable algorithm for processing signals. In this work, we develop the algorithm proposed before [4–6 and others] for the interferometer length measurement to measure the small variations of aqueous solutions refractive index.
In this work the highly diluted NaCl solutions were investigated. It was shown that their refractive index varies by values of (1…5) × 10−5 depending on the method of their preparation (using stirring or shaking). Differences were established between solutions of low and ultra-low NaCl concentrations prepared using shaking, and the respective water controls. The differences were observed between the refractive indices of water and water controls. Moreover, differences were shown between different samples of water controls prepared using shaking, i.e., water subjected to different numbers of serial dilutions.
Methods
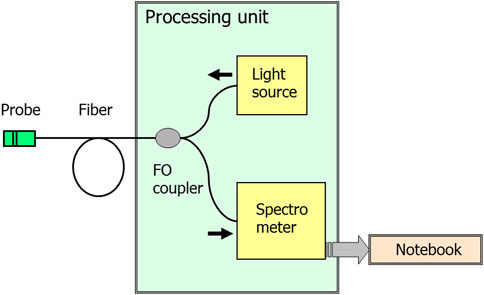
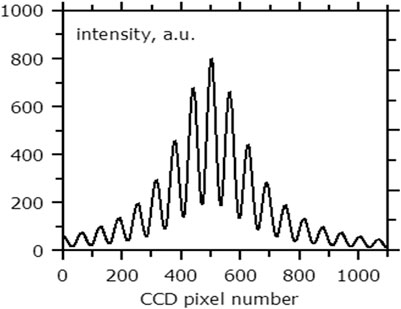
The experimental setup is shown in Figure 1. Broadband radiation from a source (superluminescent diode from www.superlumdiodes.com) with a central wavelength of ∼800 nm and a spectral width of ∼35 nm is introduced into a single-mode fiber optic coupler (made of Corning HI-780 fiber) and enters the probe, reflecting from which it is fed to the spectrometer through the other arm of the coupler. The probe is a Fabry–Perot interferometer formed by two ends of the same fiber waveguide. The fiber ends were Ag sputtered to increase the interferometry visibility. The frequency dependence of the interferometer reflection coefficient was sinusoidal, and this fact is used in the signal processing algorithm. The measured spectrum (Figure 2) is an oscillating function with a smooth envelope, which repeats the shape of the spectrum of the radiation source; the period of oscillations and their position determine the optical thickness of the interferometer (the product of the refractive index of the medium and the interferometer length).
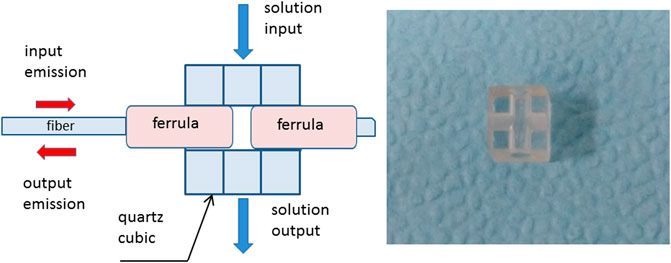
For highly accurate determination of the refractive index of liquid media, a specific measuring cell was developed. It is presented at Figure 3.
The cell is a quartz cube with an edge length of 9 mm with two holes—one is horizontal with a diameter of 2.5 mm, the other is vertical with a diameter of 3 mm. The horizontal hole is intended for gluing the ends of optical fibers in ceramic ferrules (2.5 mm diameter), the gap between which formed a Fabry–Perot interferometer. The typical interferometer length was 50 µm. Vertical holes are designed to supply and drain the investigated liquid. To minimize the effect of temperature drift on the gap between the ends of the fibers, quartz was chosen as a cube material having a small thermal expansion.
Processing of the Measured Spectra
The processing algorithm for the measured spectra is mostly based on [4, 6] and illustrated in Figure 4 (for clarity, discrete signals are shown as continuous).
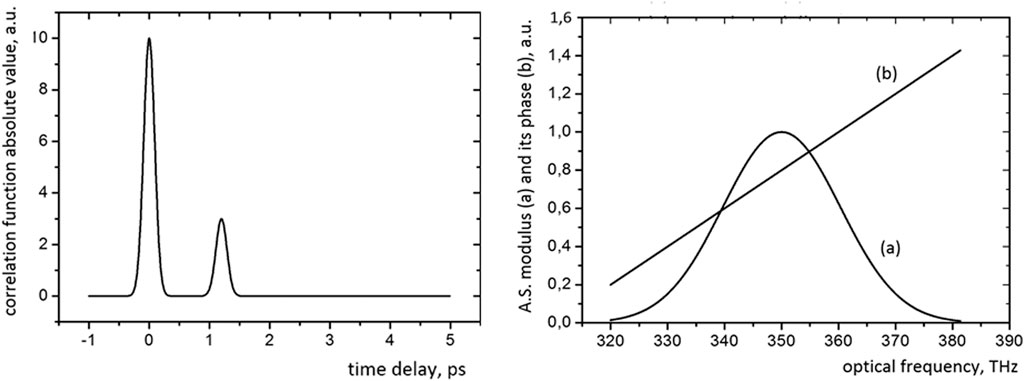
FIGURE 4. The illustration of the processing algorithm. 1) The modulus of the correlation function (Fourier transform of the measured spectrum). 2) The modulus (A) and the phase (B) of the analytical signal frequency dependence.
The processing algorithm for the measured spectrum includes the Fourier transform, adaptive filtering (rectangular windowing is used for necessary correlation peak selection) in the time domain and the next Fourier transform, which gives the so-called “analytical signal”, the modulus of which coincides with the spectrum of the radiation source, and its phase gives the dependence of the phase difference of interfering waves on the frequency [4].
But in this work, we measured the increment of the refractive index of the medium filling the Fabry–Perot interferometer with unchanged interferometer length. In this case, we do not need the "phase unwrapping" procedure usually used for determining the optical thickness of the interferometer. As is known in interferometry, this procedure results in the problem of uncontrolled phase jumps caused by errors in the measurement of phase readings and the discrete nature of calculations. Thus, in our case, this problem is absent. The measurement results is a change (δn) in the refractive index of the medium caused by the replacement of the "reference" solution with the “sample” investigated.
The phase difference φ(k) of interfering waves at the frequency ν(k) (k = kmin,…., kmax) is determined by the relation:
where k = kmin, …., kmax–optical frequency number, L–the interferometer length, n(k)–the refractive index at the frequency ν(k), c–velocity of light in vacuum, α–the initial phase difference. As in [4, 6], the spectrum processing algorithm allows calculating an array of phase factors
where k = kmin,…., kmax. which we denoted by µ(k), here i is the imaginary unit.
For small (compared to unity) phase increments δφ(k) from (2), we obtain:
this implies
In turn, for the phase increments δφ(k) formula (1) gives
where
By eliminating the values of
where k = kmin,…., kmax.
And, finally, we find the required value (δn)—the change in the refractive index caused by the medium change averaged over the considered optical frequency range:
where the values ρ(k) of the analytical signal modulus are taken as the most natural coefficients for spectral data weighting.
Each measurement of the difference between the refractive indices of the two media
where
The root-mean-square error σ(n) of measuring the difference in refractive indices was determined using the standard formula:
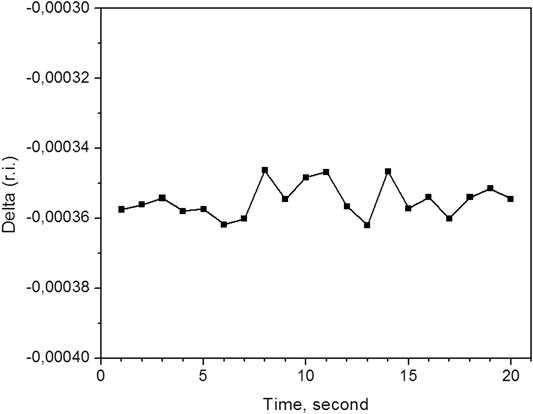
Typical example of the measured (δn) time series under static conditions for some sample is shown in Figure 5. It allows us to estimate the accuracy of the method. The result is
In the experiment, we used aqueous NaCl solutions subjected to hundredfold dilution from 0 to 30 times. Note that the preparation of the solutions included vigorous shaking at each stage of dilution.
Results
In the experiment, the difference between the refractive index of the corresponding sample and the refractive index of the initial water was measured. The results of measurements for samples with pure water and aqueous NaCl solutions are presented for various degrees of their hundredfold dilution. The results were obtained by averaging over six measurements. Each measurement is a 100-point average.
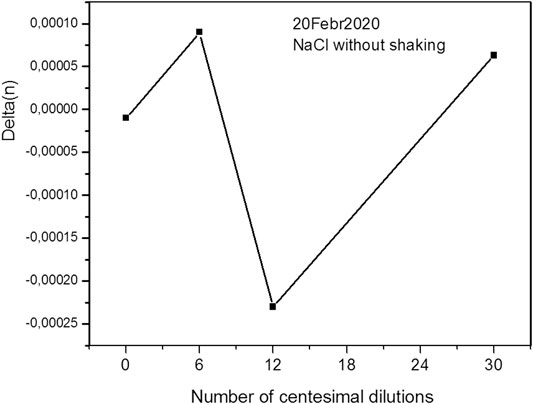
The figures show the results of measuring the difference between the refractive index of a sample of the corresponding dilution and the refractive index of deionized water. As one can see from the figures, the refractive index of the solution changes nonlinearly and increase with the number of dilutions. In the case of pure water (Figures 6, 7), at the beginning, we see the sameness of the original water and water without dilutions. And it is natural to assume that water diluted and just water should have the same properties. However, we see the difference appears after 6 hundredfold dilution between water with shaking and without. That is, there is some feature at 6-fold dilution that leads to a sharp difference between the properties of the solution and those of solutions with a higher or lower concentration.
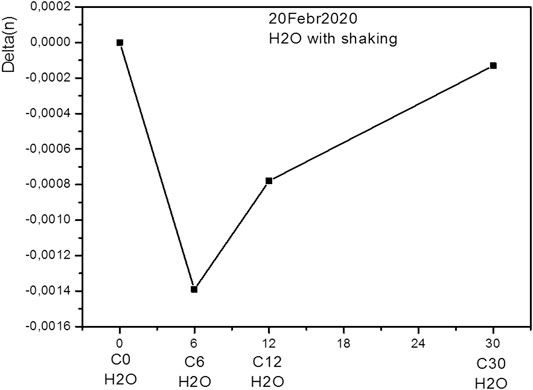
FIGURE 6. Relative refractive index of the deionized water subjected to shaking for different number of dilutions.
We observe a similar picture for an aqueous solution of NaCl (Figures 8, 9), but here the characteristic dip corresponds to a 12-fold dilution.
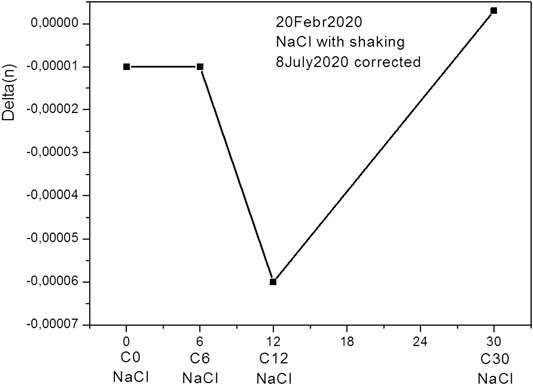
FIGURE 8. Relative refractive index of the NaCl water dilution subjected to shaking for different number of dilutions.
It should be remembered that these points were obtained by averaging 100 measurements and are highly reliable. Thus, our results show that the amount of dilution affects the physical properties of the solution.
Certainly, the obtained results cannot be interpreted as a measurement of NaCl concentration. With such dilutions, there should not be any amount of a substance left in the solution. However, we see changes in the signal. This may indicate the effect of the solution preparation procedure on the properties of the medium. As shown in [7], mechanical action on an aqueous solution can change its molecular composition and, consequently, the refractive index. However, it is not clear why the maximum change occurs at any particular amount of dilution. The purpose of further research should be to study the properties of the environment itself by various methods and under various external influences. In this case, one of the most essential requirements is increasing the sensitivity. In this technique, an increase in the measurement accuracy can be achieved by optimizing the reflection coefficients of the interferometer mirrors and its base, by increasing the spectrum width of the radiation source (superluminescent diode), and also by improving the resolution of the spectrometer used.
Discussion
The properties of high diluted aqua solutions have been investigated. Certainly, the obtained results cannot be interpreted as a measurement of NaCl concentration. With such dilutions, there should not be any amount of a substance left in the solution. However, we see changes in the refractive index. This may indicate the effect of the solution preparation procedure on the properties of the medium. As shown in [7], mechanical action on an aqueous solution can change its molecular composition and, consequently, the refractive index. However, it is not clear why the maximum change occurs at any particular amount of dilutions. The purpose of further research should be to study the properties of the environment itself by various methods and under various external influences. In this case, one of the most essential requirements is increasing the sensitivity. In this technique, an increase in the measurement accuracy can be achieved by optimizing the reflection coefficients of the interferometer mirrors and its length, by increasing the spectrum width of the radiation source, and also by improving the resolution of the spectrometer used.
Conclusion
A high-precision technique has been developed for comparing the refractive indices of solutions, one of which is considered to be a "reference". The results of the performed measurements show that the procedure for preparing aqueous solutions affects their physical properties.
The experiments have shown that the proposed technique can be used to assess changes in the optical properties of aqueous solutions of ultra-low concentrations. To increase the reliability of the results, it is necessary to conduct further research with an increase in the accuracy of measurements and an increase in the amount of statistical data.
Data Availability Statement
The original contributions presented in the study are included in the article/Supplementary Material, further inquiries can be directed to the corresponding author.
Author Contributions
IL and BU conducted experiments. IL and VP participated in the processing of the results and their discussion. IL and VP participated in writing the text of the manuscript.
Funding
This work was supported by a grant of the Ministry of Science and Higher Education of the Russian Federation for large scientific projects in priority areas of scientific and technological development (Grant Number 075-15-2020-774).
Conflict of Interest
The authors declare that the research was conducted in the absence of any commercial or financial relationships that could be construed as a potential conflict of interest.
Acknowledgments
The authors wish to express their gratitude to Igor Ershov of the Center of Laser Technology and Material Science for his assistance for sample preparing.
References
1. Gorji A, Bowler N. Static permittivity of environmentally relevant low-concentration aqueous solutions of NaCl, NaNO3, and Na2SO4. J Chem Phys (2020) 153(1):014503. doi:10.1063/1.5144301
2. Lin T, Gu S, Lasri T, Highly sensitive characterization of glucose aqueous solution with low concentration: application to broadband dielectric spectroscopy. Sens Actuators A Phys (2017) 267:318–26. doi:10.1016/j.sna.2017.10.029
3. Kononov MA, Pustovoy VI, Svetikov VV. Specific features of the excitation of surface plasmons at the interface between metal and aqueous solution of extremely low concentration. Phys Wave Phenom (2020) 28(2):94–7. doi:10.3103/s1541308x20020089
4. Egorov SA, Mamaev AN, Likhachiev IG. High reliable, self calibrated signal processing method for interferometric fiber-optic sensors. SPIE (1996) 2594:193–7. doi:10.1117/12.229231
5. Miridonov SV, Shlyagin MG, Khomenko AV, Spirin VV. Digital demodulation algorithm for white-light fiber-optic interferometric sensors. Proc SPIE (2002) 4777:136–42. doi:10.1117/12.472213
6. Likhachev IG, Pustovoy VI, Krasovskiy VI. Measurement of the nanoscale roughness using white light interferometry. J Opt Technol (2017) 8(12)–822. doi:10.1364/jot.84.000822
Keywords: interferometry, spectral coding, aqueous solution, refractive index, NaCl
Citation: Likhachev IG, Pustovoy VI and Usievich BA (2021) Spectrally Resolved White Light Interferometry for NaCl Aqueous Solutions Refractive Index Measurement. Front. Phys. 9:642096. doi: 10.3389/fphy.2021.642096
Received: 30 December 2020; Accepted: 29 January 2021;
Published: 09 March 2021.
Edited by:
Nikolai F. Bunkin, Bauman Moscow State Technical University, RussiaReviewed by:
Tong Guo, Tianjin University, ChinaVladimir Ivanov, Institute of Theoretical and Experimental Biophysics (RAS), Russia
Copyright © 2021 Likhachev, Pustovoy and Usievich. This is an open-access article distributed under the terms of the Creative Commons Attribution License (CC BY). The use, distribution or reproduction in other forums is permitted, provided the original author(s) and the copyright owner(s) are credited and that the original publication in this journal is cited, in accordance with accepted academic practice. No use, distribution or reproduction is permitted which does not comply with these terms.
*Correspondence: Igor G. Likhachev, aWdsaWtoYWNoZXZAZ21haWwuY29t
 Igor G. Likhachev
 Vladimir I. Pustovoy
 Boris A. Usievich