- 1Department of Biophysics, Faculty of Biology, Lomonosov Moscow State University, Moscow, Russia
- 2Prokhorov General Physics Institute of the Russian Academy of Sciences, Moscow, Russia
- 3Institute of Cell Biophysics RAS, FRC PSCBR, Russian Academy of Sciences, Pushchino, Russia
This paper investigates the effects of europium acetate and intensive stirring on the intermolecular properties of water in solutions. To do this, we studied aqueous solutions of europium acetate in a wide range of concentrations, which were prepared by serial dilution using a microfluidic unit. Water and similarly prepared water dilutions were used as controls. Raman spectroscopy and infrared (IR) spectroscopy were applied to assess the features of hydrogen bonds formed in the studied solutions. Using Raman spectroscopy, it was shown that intermolecular binding is stronger in solutions of europium acetate of 10–1 M and 10–3 M than in water controls. On the contrary, solutions of europium acetate at a concentration of 10–10 М and some lower concentrations demonstrate weaker hydrogen bonding than in the respective water dilutions, which was shown by both methods. Such differences were observed even in solutions with a calculated concentration of europium acetate below 10–24 M. When comparing water with control dilutions of water, it was established that intermolecular binding is different (stronger or weaker) in high dilutions of water than in water not subjected to the dilution procedure. This indicates that the dilution process itself significantly influences the properties of water in solutions. Additionally, the paper discusses the energy state of water molecules in the studied solutions.
1 Introduction
It is known that the structuredness of water depends on external environmental conditions, the presence and concentration of impurities, and even mechanical effects thereon [1–7]. The effect of solutes on water structure is the most difficult factor to study. Many papers demonstrate that the properties of solutions change nonlinearly with changes in concentration. Even the content of substances in extremely small amounts leads to changes in the physical-chemical properties and biological activity of such water [8–11]. In addition, there is research which confirms that ultra-high dilutions of substances are systems different from both water used as a solvent and similarly prepared water dilutions [12]. In particular, such systems are characterized by structuredness associated with the formation of special diverse heterogeneities: nanoassociates, nanobubbles, bubstons, water domains or submillimeter density inhomogeneities [5, 13–17].
Currently, the properties of water and aqueous solutions are being considered from new angles, and new unexpected patterns are being discovered due to modern research methods. Such research is now becoming particularly relevant in the fields of both fundamental and applied sciences.
Lanthanides are an object of research with great prospects for implementation in various fields of science and technology. They are used in molecular optical electronics, information display systems, and energy saving technologies, and also in the development of solar panels, displays, and lasers. Lanthanides are also used in sensorics, biosensors, biomedicine, in the study of biological functions of molecules, the conformation of proteins and nucleic acids, and also in biochemical research and biotechnology [18–27]. Such a wide application of use is related to lanthanides’ ability to form luminescent complexes with various ligands. Depending on the method of preparation, complexes can be formed either with or without covalent bonding [28]. Such complexes have a number of advantages, including characteristically narrow luminescent bands independent of the molecular environment, and long-life luminescence [3, 29–32]. This paper concerns the study of solutions of one such complex—europium acetate—in a wide range of concentrations.
Taking into account the prospects for lanthanides in various applications, it would seem relevant to study the potential special properties of aqueous solutions of europium acetate at different concentrations. Therefore, in this study we analyze the structuredness of aqueous solutions of europium acetate at a wide range of concentrations (including ultrahigh dilutions) compared to similarly prepared dilutions of water or water used as a solvent. The analysis was performed using vibrational spectroscopy (infrared and Raman scattering methods), which are traditionally used in studies of intermolecular binding in water and aqueous solutions. We evaluated the intermolecular binding energy characteristics of the solutions using spectral parameters.
2 Methods
Materials
Europium (III) acetate hydrate (99.99%) (AcEu) (manufactured by LANHIT LLC, Russia) was used to prepare europium acetate solutions without further purification. The initial solution contained 0.1 M AcEu, from which a line of serial 100-fold dilutions was prepared. Water and a line of 100-fold water dilutions (from 1 to 30 times) were used as a control. The water used as a solvent for the preparation of each dilution was also analyzed. Each AcEu dilution was prepared on the same day as the respective water dilution. 3 series of each dilution line were prepared.
100-fold dilutions were prepared using an automated microfluidic system consisting of an Atlas syringe pump (Syrris Ltd., United Kingdom), a glass flow microreactor, and a personal computer with an installed solution preparation algorithm. Mixing of the two flows in a flow microreactor (microfluidic chip) was achieved on account of Dean vortices occurring in the bends of the channel trajectory. Detailed characteristics of the unit are provided in ref. 4.
Deionized Milli-Q water with an initial specific resistivity of 18 MΩ cm at 25°C was used in the work. All test samples were stored in sterile glass bottles with lids (Glastechnik Gräfenroda GmbH, Germany) for no more than a day before the measurements.
Methods
The study was carried out using Raman spectroscopy and infrared (IR) spectroscopy and measuring the attenuated total reflectance (ATR). These methods allow spectral characteristics to be obtained that reflect the properties of vibrations of OH groups related to the characteristics of H-bonds of solutions.
2.1.1 Raman Spectroscopy
To measure the Raman spectra, an EnSpectr (USA) RamMics M532 Raman spectrometer was used as part of a EnSpectrR532 Scientific Edition Raman analyser with an Olympus microscope. The measurements were made using an Olympus LMPlanFL N 50x/0.50 lens, with a measurement interval of 0.9 cm−1. The Raman spectra were excited at a wavelength of 532 nm (the 2nd harmonic of the Nd:YAG laser), and the exciting emission power was 30 mW. Spectral peaks associated with various types of intramolecular water vibrations were analyzed.
Pre-processing of the spectra consisted of subtracting the baseline in OriginPro (2017) using the interpolation method and normalizing it to the band intensity value with a maximum of 3420 cm−1. This spectral band is usually called the valence band. It has a rather complex structure that includes several component bands associated with the three different intramolecular vibrations: symmetric stretching vibrations, asymmetric stretching vibrations, and the first overtone of bending vibrations, the main band of which is located at 1640 cm−1. Each of the component bands is substantially broadened due to the wide range of intermolecular interaction energies in the liquid phase. As a result, one wide band without any obvious components (Figure 1) can be observed. However, depending on the intermolecular binding energy spectrum, the position and shape of this band may significantly change. It is well known that with a decrease in temperature or in the presence of additives with positive hydration, the valence band of water shifts toward smaller wavenumbers (and vice versa) [33–36]. This is due to an increase (and vice versa, a decrease) in the effective mass of the vibrational system (O-H bond) as a result of increased binding to adjacent molecules. Hence, it is possible to study intermolecular bonding in aqueous solutions based on the analysis of this band shape. A number of papers [37–39] provide examples of using such an approach. There is another approach, where the valence band is conditionally divided into components using the principle applied in the two-structure model [40, 41], according to which water consists of weakly bound and strongly bound water molecules. A third fraction is also often considered, namely free water molecules. This allows a more accurate decomposition of the spectrum to be conducted and, above all, provides a more realistic description of the structure of water that undoubtedly contains free molecules, as shown by other methods [42, 43].
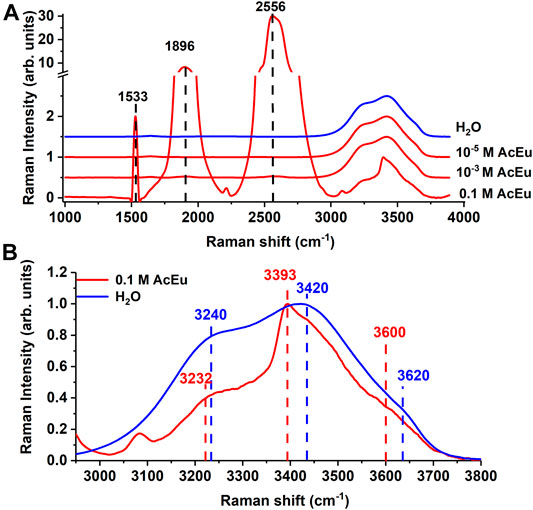
FIGURE 1. (A) Raman spectra of AcEu solutions (red) at different concentrations and water (blue). The spectra are shifted along the ordinate axis. (B) an enlarged section of the spectra in the 3000–3800 cm−1 region. The spectra overlap each other.
In this study, we analyzed the position of the maximum of the following bands: at 3240 cm−1 (due to the presence of strong hydrogen bonds), at 3420 cm−1 (due to weak hydrogen bonds), at 3620 cm−1 (due to free water molecules), as well as the ratio of band intensities I3240/I3420, which correlates to the average strength of intermolecular hydrogen binding in water, and the ratio I3620/I3420, which correlates to the number of free water molecules in the solution. The applicability of the analysis of intermolecular binding in aqueous solutions based on these relations was demonstrated, for example, in Refs. [34, 37–39]. To determine the positions of the maxima of the three bands that make up the valence band in the Raman spectra (namely, at 3240, 3420, and 3620 cm−1), a standard approach was used to search for the position of the maxima applying the built-in Origin2017 IntegratePeak function.
The number of replicates of measurements for each sample type was at least 12.
2.1.2 Infrared Spectroscopy
IR spectra were recorded using a FT-801 Fourier-transform spectrometer (NPF SIMEX LLC., Russia) with a ZnSe crystal attachment. The device was used with the following units: DTGS detector, standard source for medium IR, ZnSe beamsplitter, spectral resolution of 0.5 cm−1, triangular anodisation. Pre-processing of the spectra consisted of subtracting the baseline in OriginPro (2017) using the interpolation method and normalizing them to the value of the maximum band intensity at 3300 cm−1. This spectral band in the IR spectrum is associated with stretching vibrations of water molecules, the maximum position of which is shifted (compared to the band in the Raman spectrum) due to features of the ATR method. The peak position was determined using the built-in Origin2017 IntegratePeak function based on the second derivative. It is known that the position of the maximum of this band can be correlated with the average binding force of water molecules in solutions [35], and this was used to interpret the results in this work.
The number of replicates of measurements for each sample type was at least 6.
Statistical Analysis
Statistical data processing was performed using RStudio (Version 1.1.463 — © 2009–2018 RStudio, Inc.) with R package version 3.6.2. The normality of distribution was assessed using the Shapiro-Wilk test, and the homogeneity of variance using Bartlett's test. To compare the groups, the Kruskal-Wallis test was used; pairwise comparison was performed using Dunn’s test with the Holm correction. The null hypothesis was rejected at p < 0.05.
3 Results
Specific bands with maxima at 1533, 1896, and 2556 cm−1 were found in the Raman spectra of the AcEu (0.1 M) solution, which are obviously associated with AcEu luminescence [44]. There is also a Raman band of stretching vibrations of water in the region of 3000–3800 cm−1 (Figure 1A). The structure of this vibrational band overlapped with at least one more Eu (III) luminescence band at 3390 cm−1 [45] (Figure 1B). At the same time, AcEu luminescence bands are detected only in a 0.1 M solution, and they are not observed in solutions of lower concentrations (Figure 1A). In the 3000–3800 cm−1 region of the 0.1 M AcEu solution spectra, a shift of all the analyzed vibrational bands to the low-frequency region was detected compared to water (Figure 1B). Furthermore, an additional 3080 cm−1 peak was observed in the spectrum of the initial AcEu solution, which may be due to the stretching vibration of strong C-H bonds of the europium (III) complex [46].
The IR spectra (Figure 2) of the 0.1 M AcEu solution clearly show specific AcEu IR bands with maxima at 1411, 1453, and 1553 cm−1 [47, 48] which are no longer visible in the spectra of solutions with concentrations of 10–3 M and 10–5 M (Figure 2). In addition, the IR spectra of all AcEu solutions contain bands associated with intramolecular vibrations of water molecules: 1630 (bending vibrations), 2190 cm−1 (combined libration + bending vibrations), as well as a wide band of stretching vibrations with a maximum at 3300 cm−1.
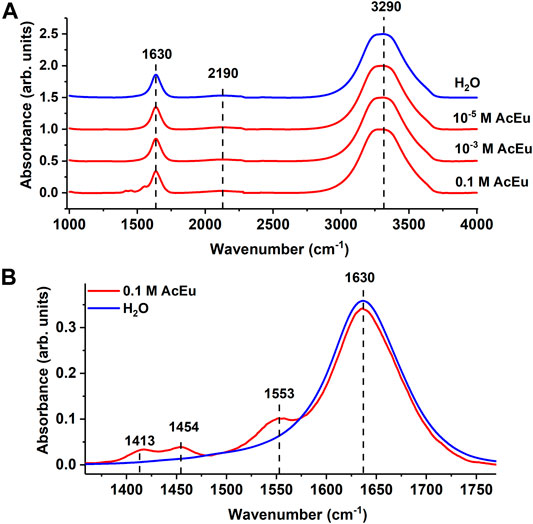
FIGURE 2. (A) IR spectra of AcEu solutions of different concentrations (red) and water (blue). The spectra are shifted along the ordinate axis. (B) an enlarged section of the spectra in the 1360–1770 cm−1region. The spectra overlap each other.
Table 1 shows the values of all the analyzed parameters of the spectral bands for the initial AcEu solution (0.1 M) and its dilutions up to concentrations of 10–3 and 10–5 M (the 1st and 2nd dilutions of the initial solution) compared to the water solvent. Figures 3–5 show the dependences of the values of all analyzed parameters of the spectral bands on the degree of dilution of the initial AcEu solution or water. In addition, the respective values are observed for the water used as a solvent in the dilution process. A discussion of the data obtained is provided in the ‘Discussion’ section.

TABLE 1. Characteristics of spectral bands of solutions associated with vibrations of bonds in water molecules (data are presented as mean ± se).
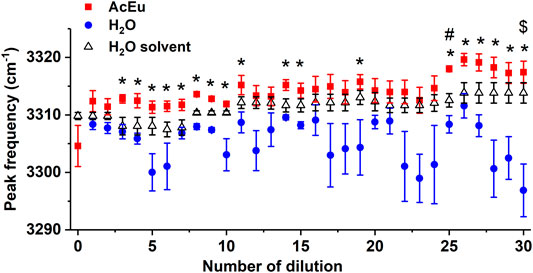
FIGURE 3. Dependence of the position of the IR band maximum of the OH groups’ stretching vibrations on the number of dilutions of the initial AcEu solution and water. Daily water monitoring is also shown. * — statistically significant difference between the AcEu dilution and the respective water dilution, # — statistically significant difference between the AcEu dilution and water, $ — statistically significant difference between water dilution and water. The data are presented as mean ± se.
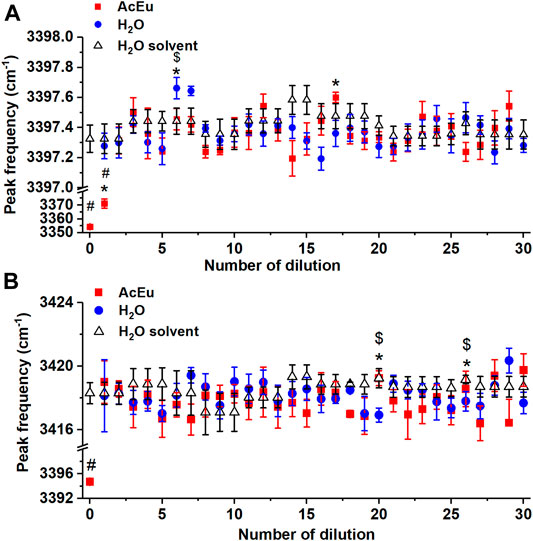
FIGURE 4. Dependence of the position of the maxima of Raman bands 3240 cm−1(A) and 3420 cm−1(B) on the number of dilutions of the initial AcEu solution and water. Daily water monitoring is also shown. * — statistically significant difference between AcEu dilution and the respective water dilution, # — statistically significant difference between AcEu dilution and water, $ — statistically significant difference between water dilution and water. The data are presented as mean ± se.
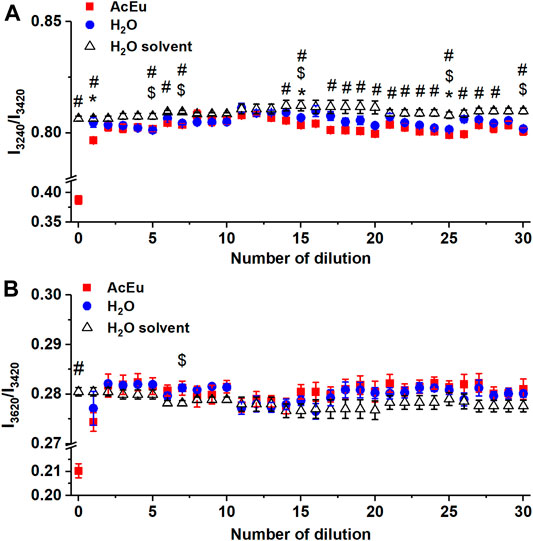
FIGURE 5. Dependence of the intensity ratio of the Raman bands I3240/I3420(A) and I3620/I3420(B) on the number of dilutions of the initial AcEu solution and water. Daily water monitoring is also shown (free water molecules). * — statistically significant difference between AcEu dilution and the respective water dilution, # — statistically significant difference between AcEu dilution and water, $ — statistically significant difference between water dilution and water. The data are presented as mean ± se.
4 Discussion
Based on the data in Table 1, the following patterns can be traced. The position of the 3240 cm−1 band maximum is shifted toward smaller wavenumbers compared to water in the spectra of the 0.1 M and 10–3 M solutions. Moreover, the peak shift is stronger for a more concentrated solution. This indicates a more strongly bound water structure in the presence of AcEu, which is quite natural since europium is an ion with a strong positive hydration, and acetate is able to form hydrogen bonds. We also have additional evidence of a stronger intermolecular bonding of the AcEu 0.1 M solution based on the IR spectrum (Table 1), which shows that the valence band in the analysis of this solution is shifted toward smaller wavenumbers compared to water. There is no reason to rely on data related to the 3420 cm−1 band from the Raman spectrum for a 0.1 M solution, since the vibrational spectrum in the region of this band overlaps with the AcEu luminescence band at 3390 cm−1, as indicated above. At the same time, for a solution of 10–3 M, the valence band no longer shows distortion and can be analyzed based on all the parameters of Table 1, including those related to the 3420 cm−1 band. A lower value of the I3620/I3420 parameter for a solution of 10–3 M compared to water indicates a lower proportion of free water molecules at this concentration. The latter conclusion is consistent with the previous conclusion of greater water bonding in the presence of AcEu at concentrations of 0.1 M and 10–3 M.
When considering the dependence of I3240/I3420 on the number of dilutions of the initial AcEu solution (Figure 5A), it was found that the value of I3240/I3420 was statistically significantly reduced compared to water in most samples obtained using multiple dilution of the initial AcEu solution (0.1 M) (namely, the 5th-7th, 14th-15th, 17th-28th and 30th). Hence, it could be concluded that the water molecules in the studied AcEu solutions are less bound than in water. This is also observed at a concentration calculated at below 10–24 M, i.e., in solutions where AcEu molecules are not expected to be present, although it is possible that they may remain there [49]. This conclusion is confirmed by the results obtained when analyzing the position of the IR band 3300 cm−1 maximum: most of the samples obtained by multiple dilution of the initial AcEu solution (0.1 M) (namely, the 4th-11th, 14th-15th, 19th, 25th-30th) were shown to be statistically significantly different from the respective water dilutions. Thus, although neither the Raman nor IR spectra of the low-concentration AcEu solutions contain specific bands of the substance and the shape of the spectra is visually indistinguishable from the spectrum of water (Figures 1, 2), in terms of the I3240/I3420 spectral characteristics (Figure 5A) and the position of the IR band 3300 cm−1 maximum (Figure 3) reflecting the structural state of water, the AcEu solutions clearly differ from the control dilutions of water and water solvent.
In addition, both according to the position of the IR band 3300 cm−1 maximum and the I3240/I3420 ratio, we noticed a more pronounced structuredness in all water dilutions compared to water, and such differences are statistically significant in a number of dilutions (this is true for the 5th, 7th, 15th, 25th and 30th dilutions—I3240/I3420) (Figure 5A). Furthermore, the 7th water dilution is characterized by an increased content of free water molecules (according to the I3620/I3420 ratio) (Figure 5B), and the 6th water dilution also shows reduced bonding of water molecules at the peak position 3240 cm−1 (it is shifted toward the larger wavenumber region). However, analysis of the 3420 cm−1 peak position revealed reduced bonding of water molecules in the 20th and 26th dilutions of water. Thus, in a series of 100-fold dilutions of water, the properties of the obtained samples are not identical and may differ radically from each other. This confirms the ideas we expressed earlier of complex processes occurring in water during dilution with mechanical stress, as well as the significant impact of this process on the properties of water [4, 7].
5 Conclusion
Using Raman and IR spectroscopy methods, it has been shown that the addition of europium acetate (0.1 M) to water increases the bonding of its molecules and reduces the proportion of free water molecules in the solution—in other words it changes the structure of water. Differences were found between certain dilutions of europium acetate (AcEu) (including ultra-high dilutions) and the respective dilutions of water (or untreated water used as a solvent). This indicates the applicability of the methods used to finding qualitative differences between high dilutions of a substance and water, even at such high dilutions that theoretically no molecules of the initial substance should be present in them. Moreover, differences have been shown between certain dilutions of water and untreated solvent water, indicating that multiple serial dilution with mechanical stress leads to a significant change in the properties of the liquid which can be detected by Raman and IR spectroscopy.
Data Availability Statement
The raw data supporting the conclusions of this article will be made available by the authors, without undue reservation.
Author Contributions
YP, SF, and DG performed the experiments. YP, SF, DG, OS, and NP participated in processing the results and their subsequent discussion. OS and NP participated in writing the manuscript text.
Conflict of Interest
The authors declare that the research was conducted in the absence of any commercial or financial relationships that could be construed as a potential conflict of interest.
References
1. Burikov SA, Dolenko TA, Velikotnyi PA, Sugonyaev AV, Fadeev VV. The effect of hydration of ions of inorganic salts on the shape of the Raman stretching band of water. Opt Spectrosc (2005) 98(2):235–9. doi:10.1134/1.1870066
2. Cassone G, Sponer J, Trusso S, Saija F. Ab initio spectroscopy of water under electric fields. Phys Chem Chem Phys (2019) 21(38):21205–12. doi:10.1039/C9CP03101D
3. Dolenko TA, Burikov SA, Dolenko SA, Efitorov AO, Plastinin IV, Yuzhakov VI, et al. Raman spectroscopy of water-ethanol solutions: the estimation of hydrogen bonding energy and the appearance of clathrate-like structures in solutions. J Phys Chem A (2015) 119(44):10806–15. doi:10.1021/acs.jpca.5b06678
4. Gudkov SV, Penkov NV, Baimler IV, Lyakhov GA, Pustovoy VI, Simakin AV, et al. Effect of mechanical shaking on the physicochemical properties of aqueous solutions. Int J Mol Sci (2020) 21(21):8033. doi:10.3390/ijms21218033
5. Konovalov AI, Ryzhkina IS. Highly diluted aqueous solutions: formation of nano-sized molecular assemblies (nanoassociates). Geochem Int (2014b) 52(13):1207–26. doi:10.1134/S0016702914130072
6. Kraiskii AV, Mel’nik NN. Determining eigenfrequencies and homogeneous widths of lines of intermolecular vibrations in water and in aqueous solutions of hydrogen peroxide using Raman spectroscopy. Opt Spectrosc (2018) 124(5):660–7. doi:10.1134/S0030400X18050120
7. Penkov NV. Temporal dynamics of the scattering properties of deionized water. Phys Wave Phenomena (2020) 28(2):135–9. doi:10.3103/S1541308X20020132
8. Lobyshev VI, Tomkevich MS, Petrushanko II. [An experimental study of potentiated aqueous solutions]. Biofizika (2005) 50(3):464.
9. Miranda AR, Vannucci A, Pontuschka WM. Impedance spectroscopy of water in comparison with high dilutions of lithium chloride. Mater Res Innov (2011) 15(5):302–9. doi:10.1179/143307511X13109310554445
10. Ryzhkina IS, Sergeeva SY, Murtazina LI, Akhmetzyanova LR, Kuznetsova TV, Knyazev IV, et al. Features of self-organization and biological properties of solutions of citric and succinic acids in low concentrations. Russ Chem Bull (2019) 68(2):334–40. doi:10.1007/s11172-019-2389-3
11. Ryzhkina IS, Kiseleva YV, Murtazina LI, Kuznetsova TV, Zainulgabidinov ER, Knyazev IV, et al. Diclofenac sodium aqueous systems at low concentrations: interconnection between physicochemical properties and action on hydrobionts. J Environ Sci (2020) 88:177–86. doi:10.1016/j.jes.2019.08.013
12. Ryzhkina IS, Kiseleva YV, Murtazina LI, Mishina OA, Timosheva AP, Sergeeva SY, et al. Self-organization and chirality in the high dilution solutions of glycoluril enantiomers with (R)-and (S)-methionine moieties. Mendeleev Commun (2015) 25(1):72–4. doi:10.1016/j.mencom.2015.01.027
13. Konovalov AI, Ryzhkina IS. Formation of nanoassociates as a key to understanding of physicochemical and biological properties of highly dilute aqueous solutions. Russ Chem Bull (2014) 63(1):1–14. doi:10.1007/s11172-014-0388-y
14. Alheshibri M, Qian J, Jehannin M, Craig VS. A history of nanobubbles. Langmuir (2016) 32(43):11086–100. doi:10.1021/acs.langmuir.6b02489
15. Ho MW. Large supramolecular water clusters caught on camera-A review. Water (2014) 6:1–12. doi:10.14294/WATER.2014.3
16. Bunkin NF, Bunkin FV. Bubston structure of water and electrolyte aqueous solutions. Phys-Uspekhi (2016) 59(9):846–65. doi:10.3367/UFNe.2016.05.037796
17. Goncharuk VV, Syroeshkin AV, Pleteneva TV, Uspenskaya EV, Levitskaya OV, Tverdislov VA. On the possibility of chiral structure-density submillimeter inhomogeneities existing in water. J Water Chem Technol (2017) 39(6):319–24. doi:10.3103/S1063455X17060029
18. Binnemans K. Luminescence of metallomesogens in the liquid crystal state. Mater Chem (2009) 19(4):448–53. doi:10.1039/B811373D
19. de Bruin-Dickason CN, Boutland AJ, Dange D, Deacon GB, Jones C. Redox transmetallation approaches to the synthesis of extremely bulky amido-lanthanoid(ii) and -calcium(ii) complexes. Dalton Trans (2018) 47(28):9512–20. doi:10.1039/C8DT02138D
20. Dickins RS, Aime S, Batsanov AS, Beeby A, Botta M, Bruce JI, et al. Structural, luminescence, and NMR studies of the reversible binding of acetate, lactate, citrate, and selected amino acids to chiral diaqua ytterbium, gadolinium, and europium complexes. J Am Chem Soc (2002) 124(43):12697–705. doi:10.1021/ja020836x
21. Eliseeva SV, Bünzli JCG. Lanthanide luminescence for functional materials and bio-sciences. Chem Soc Rev (2010) 39(1):189–227. doi:10.1039/b905604c
22. Kataoka H, Kitano T, Takizawa T, Hirai Y, Nakanishi T, Hasegawa Y. Photo-and thermo-stable luminescent beads composed of Eu (III) complexes and PMMA for enhancement of silicon solar cell efficiency. J Alloys Compd (2014) 601:293–7. doi:10.1016/j.jallcom.2014.01.165
23. Katkova MA, Vitukhnovsky AG, Bochkarev MN. Coordination compounds of rare-earth metals with organic ligands for electroluminescent diodes. Russ Chem Rev (2005) 74(12):1089–109. doi:10.1070/RC2005v074n12ABEH002481
24. Poluektov NS, Kononenko LI, Efryushina NP, Beltyukova SV. Spectrophotometric and luminescent methods for determining lanthanides. Kiev: Naukova Dumka (1989). p. 255 [in Russ].
25. Syamchand SS, Sony G. Europium enabled luminescent nanoparticles for biomedical applications. J Lumin (2015) 165:190–215. doi:10.1016/j.jlumin.2015.04.042
26. Yano S, Otsuka M. Sugar-metal ion interactions. Metal Ions Biol Syst V.32. New York, NY: Marcel Dekker (1996) 826p.
27. Zherdeva VV, Savitsky AP. Using lanthanide-based resonance energy transfer for in vitro and in vivo studies of biological processes. Biochem Mosc (2012) 77(13):1553–74. doi:10.1134/S0006297912130111
28. Carlos LD, Ferreira RAS, de Zea Bermudez V, Ribeiro SJL. Lanthanide-containing light-emitting organic-inorganic hybrids: a bet on the future. Adv Mater (2009) 21(5):509–34. doi:10.1002/adma.200801635
29. Bünzli JCG, Piguet C. Taking advantage of luminescent lanthanide ions. Chem Soc Rev (2005) 34(12):1048–77. doi:10.1039/B406082M
30. Hanaoka K, Kikuchi K, Kojima H, Urano Y, Nagano T. Development of a zinc ion-selective luminescent lanthanide chemosensor for biological applications. J Am Chem Soc (2004) 126(39):12470–6. doi:10.1021/ja0469333
31. Mizukami S, Tonai K, Kaneko M, Kikuchi K. Lanthanide-based protease activity sensors for time-resolved fluorescence measurements. J Am Chem Soc (2008) 130(44):14376–7. doi:10.1021/ja800322b
32. Picot A, D'Aléo A, Baldeck PL, Grichine A, Duperray A, Andraud C, et al. Long-lived two-photon excited luminescence of water-soluble europium complex: applications in biological imaging using two-photon scanning microscopy. J Am Chem Soc (2008) 130(5):1532–3. doi:10.1021/ja076837c
33. Fadeev VV, Burikov SA, Volkov PA, Lapshin VB, Syroeshkin AV. Raman scattering and fluorescence spectra of water from the sea surface microlayer. Oceanology (2009) 49(2):205–10. doi:10.1134/S0001437009020052
34. Scherer JR, Go MK, Kint S. Raman spectra and structure of water from-10 to 90. deg. J Phys Chem (1974) 78(13):1304–13. doi:10.1021/j100606a013
35. Shi L, Gruenbaum SM, Skinner JL. Interpretation of IR and Raman line shapes for H2O and D2O ice Ih. J Phys Chem B (2012) 116(47):13821–30. doi:10.1021/jp3059239
36. Sommers GM, Calegari Andrade MF, Zhang L, Wang H, Car R. Raman spectrum and polarizability of liquid water from deep neural networks. Phys Chem Chem Phys (2020) 22(19):10592–602. doi:10.1039/D0CP01893G
37. Dolenko TY, Burikov SA, Patsaeva SV, Yuzhakov VI. Manifestation of hydrogen bonds of aqueous ethanol solutions in the Raman scattering spectra. Quantum Electron (2011) 41(3):267. doi:10.1070/QE2011v041n03ABEH014401
38. Vervald AM, Burikov SA, Shenderova OA, Nunn N, Podkopaev DO, Vlasov II, et al. Relationship between fluorescent and vibronic properties of detonation nanodiamonds and strength of hydrogen bonds in suspensions. J Phys Chem C (2016) 120(34):19375–83. doi:10.1021/acs.jpcc.6b03500
39. Zhang YJ, Su ZF, Li JF, Lipkowski J. What vibrational spectroscopy tells about water structure at the electrified palladium-water interface. J Phys Chem C (2020) 124(24):13240–8. doi:10.1021/acs.jpcc.0c03453
40. Walrafen GE, Hokmabadi MS, Yang WH. Raman isosbestic points from liquid water. J Chem Phys (1986) 85(12):6964–9. doi:10.1063/1.451383
41. Yakovenko AA, Yashin VA, Kovalev AE, Fesenko EE. Structure of the vibrational absorption spectra of water in the visible region. Biophysics (2002) 47:891–5.
42. Penkov NV, Shvirst NE, Yashin VA, Fesenko EE. [On singularities of molecular relaxation in water solutions]. Biofizika (2013) 58(6):933–41. doi:10.1134/S000635091306016X
43. Yada H, Nagai M, Tanaka K. Origin of the fast relaxation component of water and heavy water revealed by terahertz time-domain attenuated total reflection spectroscopy. Chem Phys Lett (2008) 464(4-6):166–70. doi:10.1016/j.cplett.2008.09.015
44. Yi CL, Tang Y, Liu WS, Tan MY. Assembly of a novel luminescent coordination polymer from europium nitrate and a new semirigid bridging podand. Inorg Chem Commun (2007) 10(12):1505–9. doi:10.1016/j.inoche.2007.09.026
45. Gallagher PK. Absorption and fluorescence of europium(III) in aqueous solutions. J Chem Phys (1964) 41(10):3061–9. doi:10.1063/1.1725678
46. Babij M, Mondry A. Synthesis, structure and spectroscopic studies of europium complex with S(+)-mandelic acid. J Rare Earths (2011) 29(12):1188–91. doi:10.1016/s1002-0721(10)60623-0
47. Martynova IA, Kardashev SV, Kuzmina NP. Features of interaction acetate and pivalate cerium (III) and europium (III) with monoethanolamine. Mosc Univ Chem Bull (2012) 53(1):24. doi:10.3103/S0027131412010063
48. Sarnit EА, Saidahmetova NN, Melnikova ЕD. Synthesis, structure and luminescence of europium(III) mixed-ligand complex based on n-dodecyliminodiacetic acid, acetylacetone and 1:10-phenanthroline. Sci Notes V.I Vernadsky Crimean Fed Univ Biol Chem (2019) 5:236–44.
Keywords: europium acetate, raman spectroscopy, infrared spectroscopy, solution structure, water structuredness, high dilutions
Citation: Slatinskaya OV, Pyrkov YN, Filatova SA, Guryev DA and Penkov NV (2021) Study of the Effect of Europium Acetate on the Intermolecular Properties of Water. Front. Phys. 9:641110. doi: 10.3389/fphy.2021.641110
Received: 14 December 2020; Accepted: 25 January 2021;
Published: 09 March 2021.
Edited by:
Nikolai F. Bunkin, Bauman Moscow State Technical University, RussiaReviewed by:
Fuminori Misaizu, Tohoku University, JapanKasibhatta Siva Kumar, Sri Venkateswara University, India
Copyright © 2021 Slatinskaya, Pyrkov, Filatova, Guryev and Penkov. This is an open-access article distributed under the terms of the Creative Commons Attribution License (CC BY). The use, distribution or reproduction in other forums is permitted, provided the original author(s) and the copyright owner(s) are credited and that the original publication in this journal is cited, in accordance with accepted academic practice. No use, distribution or reproduction is permitted which does not comply with these terms.
*Correspondence: O. V. Slatinskaya, c2xhdG9seWFAbWFpbC5ydQ==
 O. V. Slatinskaya
 Yu. N. Pyrkov
 S. A. Filatova
 D. A. Guryev
 N. V. Penkov