 José Ángel Picazo-Bueno
 Javier García
 Vicente Micó
- Department of Optics and Optometry and Vision Sciences, University of Valencia, Burjassot, Spain
Digital holographic microscopy (DHM) is a well-known microscopy technique using an interferometric architecture for quantitative phase imaging (QPI) and it has been already implemented utilizing a large number of interferometers. Among them, single-element interferometers are of particular interest due to its simplicity, stability, and low cost. Here, we present an extremely simple common-path interferometric layout based on the use of a single one-dimensional diffraction grating for both illuminating the sample in reflection and generating the digital holograms. The technique, named single-element reflective digital holographic microscopy (SER-DHM), enables QPI and topography analysis of reflective/opaque objects using a single-shot operation principle. SER-DHM is experimentally validated involving different reflective samples.
Introduction
Digital holographic microscopy (DHM) raises from the application of digital holography to microscopy. Thus, DHM merges high-quality imaging (microscopy), whole-object wavefront recovery (holography), and numerical processing capabilities (digital domain) [1–4]. In addition, DHM allows quantitative phase imaging (QPI) using a non-invasive, full-field, real-time, non-contact, and static working principle, at the same time that provides major advantages with respect to other microscopy techniques as the removal of the limited depth of focus in high NA lenses [5]. When DHM is implemented in a reflection modality, the phase delays of the light reflected or scattered by the sample are recovered. Those delays are directly related to the topography of the sample surface. The possibility of inspecting the topography of technical microscopic objects, which often are reflective or opaque, is of great significance in fields as important as science, technology, and industry.
In DHM, many different interferometric configurations have been implemented to work in reflection, such as modified Mach-Zehnder [6–9], Michelson [10–13], Linnik [14], Twyman-Green [15], Sagnac [16], and common-path interferometers [17–23], among others. Perhaps the modified Mach-Zehnder and Michelson interferometers are the most common used layouts. However, common-path interferometers (CPIs) enhance the performance in terms of robustness, simplicity, and stability. In CPIs, both imaging and reference beams pass through the same optical elements, thus minimizing both the required optical elements and the instabilities of the system (mechanical and thermal changes) allowing a more compact assembly. Inside CPIs category, we can find several types according to the way of generating the reference beam. For instance, such a beam can be created: (1) by the reflection of the light in a reference mirror inside a Mirau interferometric objective [18]; (2) by a spatial filtering at the Fourier plane in diffraction phase microscopy [17, 19]; by using the clear regions near to sparse samples in lateral shearing interferometry [24–27], (3) by spatially-multiplexing the field of view (FOV) [23], or (4) by using a modulator mask in single pixel phase imaging [21, 22].
Among all CPIs described in the literature, there are some of them that employ just one optical element to produce interferences, such as a Lloyd's mirror [28], a thick glass plate [26], a diffraction grating [29], a beam splitter cube [30], or a Fresnel's biprism [31–34]. Those reduce even more the price and the complexity of CPIs and present a very simple usability. Nevertheless, all those single-element CPIs were mostly implemented in a transmission modality, being therefore limited to the analysis of transmissive/transparent objects.
In order to expand the applicability of such single-element interferometers to the obtention of the topography of reflective/opaque samples, this contribution reports on a reflective interferometric configuration based on a single one-dimensional (1D) diffraction grating. The grating is used to simultaneously illuminate the sample in reflection mode and defines a single-element CPI architecture. In this configuration, the reference beam is generated by spatially multiplexing the FOV at the input plane as spatially multiplexed interferometric microscopy (SMIM) does [23, 35–38]. The technique, named single-element reflective DHM (SER-DHM), is presented as an extremely simple, highly-stable, and robust way to provide topography analysis in reflecting surfaces with a nanometric accuracy and in a non-invasive manner. The main difference with previously reported reflective SMIM technique [23] is that, now, we are using a single element to provide both illumination and interferometric recording in the layout as well as the proposed implementation is validated outside a microscope embodiment.
The paper is organized as follows. Experimental setup describes the technique including the setup implemented for validation. Results includes three experimental validations of SER-DHM involving different reflective objects (negative USAF test target, silicon wafer, and Ronchi grating). And finally, Discussion and conclusions provides a discussion of the contribution and concludes the paper.
Experimental Setup
The experimental setup of the proposed technique is depicted in Figure 1. The layout is a reflective CPI configuration assembled on an optical table at the lab. It utilizes a 1D diffraction grating for both illuminating the sample and producing interferences. For better understanding, we can divide the setup into illumination and interferometric/imaging arms.
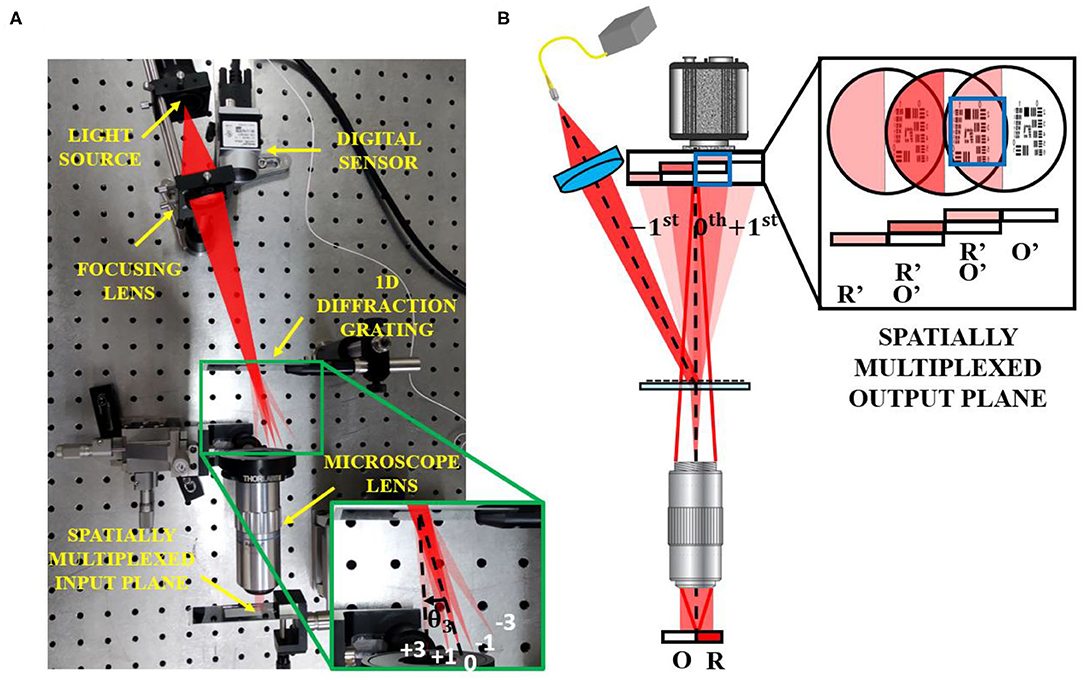
Figure 1. SER-DHM layout. (A) Picture of the experimental setup where the illumination arm is highlighted, and the green rectangle magnifies the diffraction order's direction for clarity. (B) Optical scheme and ray tracing of both illumination and interferometric arms, including a frame with the output plane (black rectangle) and the recording region (blue rectangle) where the digital sensor is placed.
The system is illuminated with a quasi-monochromatic point light source provided by a laser diode, whose wavefront curvature is properly modified by a focusing lens. Such a beam arrives to a 1D diffraction grating providing several beams diffracted at different directions according to the diffraction order. In such a way, we can take advantage of one of those diffraction orders to illuminate the sample in reflection after passing through the microscope lens (Figure 1A). Note that the focusing lens serves to focus the beam at the back focal plane of the objective in order to illuminate the sample with a collimated beam, thus optimizing the illuminated FOV at the input plane. It is also worthy to point out that the spatial frequency of the grating as well as the distance between such a grating and the microscope lens must be properly selected in order to have no additional diffraction orders passing through the objective lens. In that sense, Ronchi gratings are suitable for such a purpose since they present many odd orders that can be used for epi-illumination while their even orders have zero diffraction efficiency. Thus, in order to redirect the light toward the microscope lens, the illumination system must form an angle of incidence θi with respect to the optical axis of the objective, which is given by the diffraction grating equation,
where N is the spatial frequency of the grating, λ is the wavelength of the light source, and m is the diffraction order. θm is therefore the diffracted beam corresponding with the m diffraction order. In our case, interferometric recording needs the diffraction orders at angles coming from m = −1, 0, +1, so that the illumination angle must be coupled with higher diffraction orders (m = 3 in our case) to avoid overlap with the imaging scheme. In addition, assuming a Ronchi grating (+2nd and +4th orders efficiency equal to 0) and paraxial approximation [tan(θ) ≈ sin(θ) ≈ θ], only the +3rd order will pass through the microscope lens when the distance between the grating and the rear aperture of the objective d is higher than
being r the radius of the rear aperture of the microscope lens.
On the other hand, the interferometric arm is very similar to the one implemented in the recently proposed SMIM technique [23, 35–38]. Briefly, the FOV is spatially multiplexed into two regions, object (O) and reference (R) regions, and the diffraction grating provides an interference pattern coming from the coherent overlapping of such regions, coming from the 0th and +1st orders, respectively, at the recording plane (Figure 1B). Thus, an off-axis hologram is recorded by the digital sensor. As we can see at Figure 1B, the size of the imaged FOV exceeds the dimensions of the digital sensor at the output plane. That situation is common in microscopy and can be used in our system to optimize the recording process, that is, to only record the useful interferogram. It would nevertheless be worthwhile to mention that different technical aspects such as the spatial frequency of the grating, the magnification of the system, the pixel size of the digital sensor, and the axial distances between the grating, the microscope lens and the digital sensor must be properly adjusted when implementing the technique [29, 39, 40].
The key element for the design of the system layout is the diffraction grating, since it provides illumination of the sample in reflection mode as well as it allows the off-axis holographic recording. Perhaps more important is the second issue to finally achieve a proper image reconstruction. Hence, in order to allow off-axis holographic recording and leaving aside aliasing problems, the angle between overlapping beams (R' and O') at the output plane should be high enough to allow separation of the diffraction orders of the digital hologram at the Fourier domain. Assuming a perfectly-coherent imaging system, the cutoff frequency defined in the image spectral domain is given by fc = NA/λM, being NA and M the numerical aperture and the magnification, respectively, of the imaging layout [41]. Since in our system θ corresponds to the propagation angle of the +1st diffraction order given by Equation (1), we can therefore deduce a minimum frequency Nmin equal to 3 times such cutoff frequency:
In addition, there must be appropriate overlapping at the spatial domain between the FOV replicas provided by the diffraction grating to assure that the replicas are overlapping at FOV halves. Once the diffraction grating is properly selected, the shift between the different FOV replicas can be experimentally adjusted by displacing the camera in the axial direction, thus providing the needed shift to overlap FOV halves. This procedure will slightly modify the NA and M values of the imaging setup, but it will introduce minimal impact in the setup.
Regarding the reconstruction process, a Fourier filtering method is implemented in order to extract the complex amplitude information of the imaging beam (O') from the off-axis hologram. Briefly, this method can be summarized in the following steps: (1) Fourier transform of the off-axis hologram, (2) object spectrum filtering, (3) linear phase compensation, and (4) inverse Fourier transform [42].
Results
The experimental validation of the proposed SER-DHM consists of three steps involving different reflective/opaque targets. In those experiments, we use red (R) illumination (638 nm) provided by a fiber-optic coupled laser diode source (OSI Laser Diode, TCW RGBS-400R) focused by a lens with a focal length of 60 mm. In addition, a 50X microscope lens (Mitutoyo Plan Apo, 0.55NA), a Ronchi ruling glass slides (120 lp/mm spatial frequency), and a complementary metal-oxide-semiconductor (CMOS) sensor (Basler acA1300-200uc, 1280 × 1024 px, 4.8 μm px size, 10 bits/px, 203 fps) are used to provide image plane off-axis digital holograms. We utilize the light coming from the +3rd diffraction order to illuminate the sample in reflection because the +1st order does not present a big enough angle to arrange the illumination (close proximity with the digital sensor) and to save central order for the interferometric recording. Thus, according to Equation (1), the illumination forms an angle of θi = 13.3° with respect to the optical axis of the imaging system. Notice that, in all the included experiments, we do not have included any mirrored surface to generate the R region, but we benefit from the reflecting areas present in the surroundings of the object regions for such a purpose.
Validation of the SER-DHM Operation Principle
In order to show full reconstruction process and to provide an analysis of the system performance, results coming from a negative USAF resolution test target are included through Figure 2: the recorded hologram is shown in Figure 2A, including a magnified region (yellow rectangle) to clearly show the fringes, the Fourier transform of the off-axis hologram at Figure 2B, the amplitude (Figure 2C), and phase (Figure 2D) of the recovered complex amplitude distribution after Fourier filtering method (white circle at Figure 2B). Note that if the imaging system does not operate in telecentric mode, then there is a spherical wavefront distorting the reconstructed phase that must be canceled out (see Figure 2D). Once compensated, the resulting phase distribution is shown at Figure 2E, whose three-dimensional (3D) visualization is included at Figure 2F.
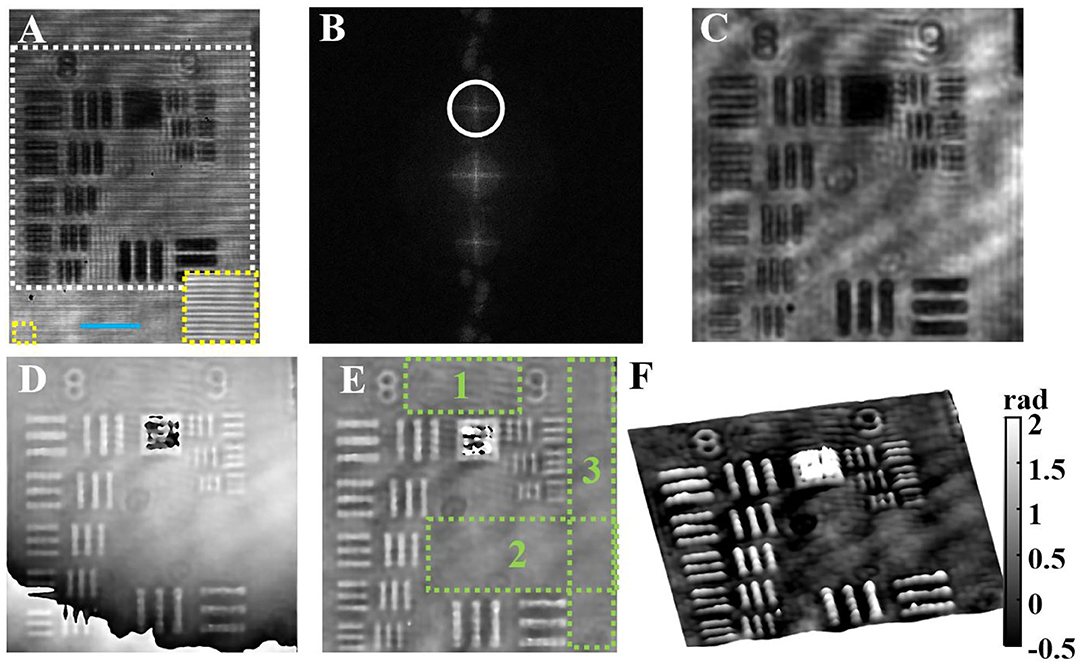
Figure 2. Experimental validation of SER-DHM involving a negative USAF test target. (A) Off-axis digital hologram. (B) Fourier transform of (A) including the filter applied for Fourier filtering. (C) Retrieved amplitude distribution. (D) Retrieved phase distribution. (E) Phase map after spherical wavefront compensation. (F) 3D phase visualization. Blue scale bar in (A) means 20 μm.
In order to measure the magnification and imaged FOV set in the experimental validations, let us consider the Element 1 of Group 8 (G8-E1) of the USAF test (period of 3.91 μm). The image of G8-E1 spreads over 48 pixels or, equivalently, 230 μm, thus defining a lateral magnification of M = 58.8 X, which is higher than the nominal magnification of the microscope objective. This is because we had to move the sensor away from the microscope lens for practical reasons (the presence of the focusing lens). Thus, since the length and width of the CMOS area are [6.14, 4.92] mm, the FOV imaged at the output plane will be [104.5, 83.6] μm.
As we can see in the reconstructions, all elements of the high-resolution USAF test target are well-resolved. In fact, the theoretical resolution of the system is ρ = kλ/NA ≈ 1μm, being k = 0.82 for coherent imaging systems with circular apertures [43]. On the other hand, in order to quantify the accuracy in the phase values, that is, the phase resolution, we compute the standard deviation (STD) values in the three regions enclosed in green rectangles in Figure 2E. The values obtained in regions 1, 2, and 3 are, respectively, 0.23, 0.24, and 0.21 rad, thus providing a phase estimation error of 0.23 rad. The fact that these values are really close one another demonstrates that the phase error does not depend on the location in the FOV, so that the system is shift-invariant after spherical wavefront compensation. Note that the presence of noise in the phase images comes from speckle noise and coherent artifacts due to the use of a coherent light source.
Inspection of Microelectronic Components
As second target, SER-DHM is used for the inspection of different regions in a semiconductor silicon wafer containing a matrix of microchips. Figure 3 includes the results for two different regions of a microchip, where Figures 3A,D depict the off-axis holograms, Figures 3B,E show the retrieved phase maps, and Figures 3C,F illustrate the 3D phase distributions of the microchip in such areas.
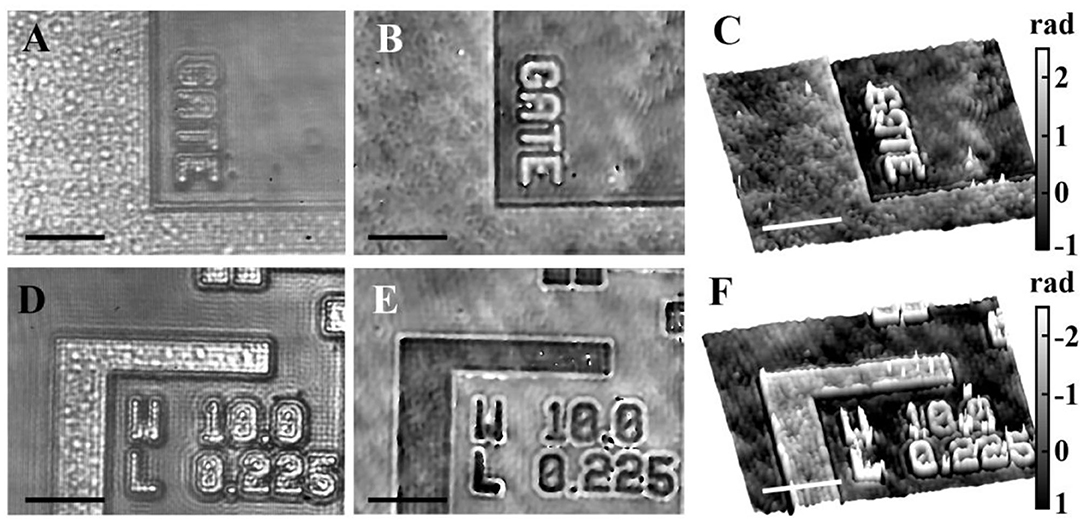
Figure 3. Inspection of a microchip silicon wafer using SER-DHM. (A,D) Off-axis digital holograms involving two different areas. (B,E) Retrieved phase distributions. (C,F) 3D phase distributions. Scale bars in images are 20 μm.
Single-Shot Topography Validation
Finally, the capability of SER-DHM to provide topography analysis in real-time is demonstrated by making a scanning of an object. The object is a 1D Ronchi grating with a spatial frequency of 20 lp/mm. Thus, the scanning process is performed along one of its borders by moving the object using a motorized linear translation stage (Newport, model ESP300). In this case, we characterize 1 mm of the grating by recording 330 images in a time of 30 s. That means we perform the scanning with a grating motion step of 3 μm to analyze a total of 20 grating periods. Figure 4 includes the results concerning this characterization. We first record a set of off-axis digital holograms (Supplementary Video 1), from which we extract the complex amplitude of the light reflected by the object by applying Fourier filtering. Then, the recovered information is properly relocated and averaged (by performing correlation between contiguous images and averaging them) in order to increase the signal-to-noise ratio (SNR) of the phase images. The resulting phase distributions are presented in Supplementary Video 2 from which we can directly obtain the information of the thickness distribution t(x, y) of the coating chromium layer of the grating (C) (Supplementary Video 3), using the following expression defined in Picazo-Bueno and Micó [23].
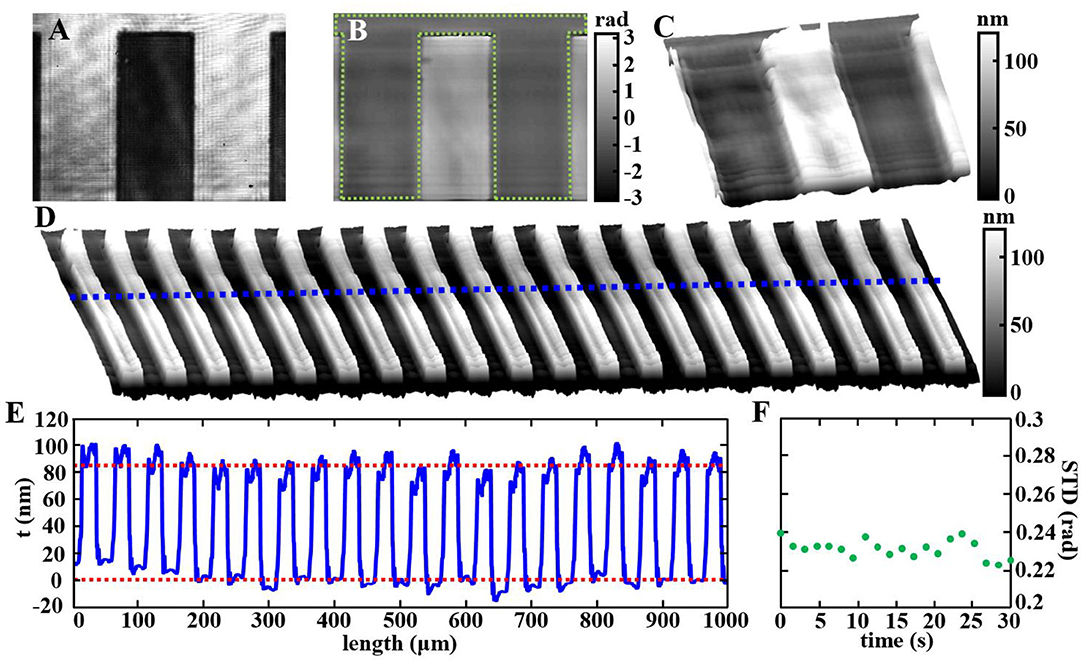
Figure 4. Experimental results of SER-DHM for the case of a 20 lp/mm Ronchi grating. (A) Off-axis digital holograms (Supplementary Video 1). (B) Averaged phase distributions (Supplementary Video 2). (C) 3D thickness distributions (Supplementary Video 3). (D) Total scanned thickness distribution along 20 grating periods. (E) Height profile along blue line included in (D). (F) STD values of the green region included in (B) before phase averaging.
In this expression, △ φ(x, y) is the phase distribution, ϕt is the phase change introduced by the reflection in the chromium layer, and the π rad value corresponds to the phase step in reflected light at dielectric interfaces (air-glass in our case). The ϕt value is obtained from the website www.refractiveindex.info which is based on Johnsonand and Christy [44]: ϕt = −161.507° = 3.4644 rad.
The thickness distribution of the entire scanned region of the grating is included in Figure 4D. In order to quantitatively validate our approach for topography analysis, we have analyzed the average value of the thickness of the chromium layer by computing a plot of the height profile (Figure 4E) considering the average thickness values computed along the dashed blue line included in Figure 4D. Subsequently, we estimate the average thickness difference in each period of the grating considering a total of 20 grating periods, achieving a thickness value of tmean= 84 nm. On the other hand, we quantitatively assess the robustness (stability in time) of our system by studying the phase stability during the scanning process. For such purpose, we have computed the STD values of the phase images (after spherical wavefront compensation) in the mirrored chromium region of the grating (dotted green area in Figure 4B) for every period which is reconstructed during the scanning. That is, a similar area of the grating is reconstructed every 1.5 s and we have extracted the STD values of the retrieved phase distribution for a total of 20 periods, meaning a total analysis time of 30 s. STD values before phase averaging are shown at Figure 4F where the computed mean value is 0.23 rad. As it can be seen, the system behaves in a very stable way providing STD phase values that perfectly matches with the obtained in Validation of the SER-DHM operation principle for the case of the negative USAF test target. In addition, the averaging process performed to the phase images during the scanning process drops such value until 0.13 rad. From this value, we can obtain a thickness estimation uncertainty by simply error propagation with the expression δt(x, y) = δ△φ(x, y)λ/4π = 6.6 nm. Hence, the experimental thickness is tmean = 84 ± 7 nm, so that the SNR is 12.
Finally, we compare this value against the thickness values provided by the characterization of such a grating performed in Picazo-Bueno and Micó [23]. There, the AFM characterization of one of those grating profiles provided a thickness value of around 85 nm, whereas the holographic setup presented at Picazo-Bueno and Micó [23] provides a value of 82 nm for the thickness of the chromium layer. As we can see, these values are in the interval defined by the experimental error, so that the values in good agreement one another, thus validating our SER-DHM approach for topography measurements.
Discussion and Conclusions
We have proposed SER-DHM as a valid technique for QPI and topography analysis in reflective objects. SER-DHM uses a single 1D diffraction grating for both illuminating the sample in a reflection mode and providing holographic imaging needed for the quantitative analysis. The technique implements a CPI architecture in which: (1) the different diffraction orders of the grating are utilized for different purposes (+3rd order for reflective illumination, and 0th and +1st orders for off-axis holographic recording), and (2) the input plane is spatially multiplexed into two regions (O + R regions), using a flat uniform region to generate the back reflected reference beam. SER-DHM has been successfully validated for a 50X/0.50NA microscope objective using different reflective objects (negative USAF test target, microchip silicon wafer, and Ronchi grating). Note that, despite being the technique successfully validated for a single microscope lens, our approach can be nonetheless implemented using other microscope objectives.
The strong point of SER-DHM comes from the use of a single optical element—a 1D Ronchi grating—to simultaneously illuminate the sample and define a CPI layout. That makes the proposed interferometric configuration be inherently more stable with respect to mechanical or thermal changes than the standard ones, e.g., Michelson, because the imaging and reference beams follow nearly the same optical path. This fact also gives the possibility to illuminate the sample using light sources with low coherence lengths, in order to reduce the coherent noise present in phase images. In addition, as SER-DHM only involves a single element, both the complexity and price of the system become significantly reduced when compared to conventional interferometers, since those usually employ a larger number of optical elements.
The proposed SER-DHM can be seen as an evolution of previous SMIM approach working in reflection mode [23], evolution in the sense of simplification because the beam splitter cube at Picazo-Bueno and Micó [23] is no longer needed in the actual configuration. However, SER-DHM has been validated on optical table instead of using the microscope embodiment where SMIM approaches were validated [23, 35–38] because it was not possible to integrate the laser source at the specific illumination angle at the same microscope body.
As main drawback, the use of diffraction gratings for such purposes means to lose a significant amount of light since we only consider the light coming from one diffraction order (+3rd order is not the most efficient one) as illumination beam as well as just two diffraction orders (0th and +1st orders) for the generation of the digital holograms. Nevertheless, this is not a big issue because illumination sources are nowadays powerful enough to perform the experiments. In addition, part of the light that arrives to the grating is reflected back and may fall into the sensor area, thus strongly deteriorating or even destroying the quality of the recorded holograms. To avoid that, we can slightly tilt the Ronchi grating in the other direction (vertical) than the multiplexing is performed; thus, all reflected light will fall out of the sensor area. Finally, the proposed SER-DHM approach also becomes restricted by the main limitation of SMIM methods the reduction of the useful FOV to one half of the available one as payment for reference beam generation. However, the FOV defined by the microscope lens is normally larger than the recorded one by the digital sensor, and we can therefore use a region outside of the recorded area as reference region.
In conclusion, our proposed SER-DHM is presented as a very simple, cost-effective, and robust technique that enables the study of the topography of reflective objects with a nanometric accuracy, in a non-invasive way, and using a single-shot operation principle. To the best knowledge, this is the first time that only a single element is used in DHM to provide both reflective illumination and holographic detection. SER-DHM could be specifically useful in, for instance, microelectronic applications, where topography measurements of the microchips (or integrated circuits) could provide extremely helpful information such as manufacturing defects.
Data Availability Statement
The raw data supporting the conclusions of this article will be made available by the authors, without undue reservation.
Author Contributions
JP-B, JG, and VM conceived and designed the research. JP-B performed the experiments. JG and VM supervised the project. All the authors wrote the manuscript and revised the results.
Funding
This work was supported by the Spanish Ministerio de Economía y Competitividad and the Fondo Europeo de Desarrollo Regional (FIS2017-89748-P).
Conflict of Interest
The authors declare that the research was conducted in the absence of any commercial or financial relationships that could be construed as a potential conflict of interest.
Supplementary Material
The Supplementary Material for this article can be found online at: https://www.frontiersin.org/articles/10.3389/fphy.2021.639607/full#supplementary-material
Supplementary Video 1. Set of recorded off-axis holograms for the scanning of the Ronchi grating.
Supplementary Video 2. Set of retrieved and averaged phase distributions in the scanning of the Ronchi grating.
Supplementary Video 3. Set of thickness distributions computed showing the topography of Ronchi grating.
References
1. Marquet P, Rappaz B, Magistretti PJ, Cuche E, Emery Y, Colomb T, et al. Digital holographic microscopy: a noninvasive contrast imaging technique allowing quantitative visualization of living cells with subwavelength axial accuracy. Opt Lett. (2005) 30:468. doi: 10.1364/OL.30.000468
2. Ferraro P, Grilli S, Alfieri D, De Nicola S, Finizio A, Pierattini G, et al. Extended focused image in microscopy by digital holography. Opt Express. (2005) 13:6738–49. doi: 10.1364/OPEX.13.006738
3. Charrière F, Marian A, Montfort F, Kuehn J, Colomb T, Cuche E, et al. Cell refractive index tomography by digital holographic microscopy. Opt Lett. (2006) 31:178–80. doi: 10.1364/OL.31.000178
4. Kemper B, von Bally G. Digital holographic microscopy for live cell applications and technical inspection. Appl Opt. (2008) 47:A52–61. doi: 10.1364/AO.47.000A52
5. Kim MK. Digitalholographic microscopy. In: Principles, Techniques, and Applications, Vol. 162. New York, NY: Springer (2011). p. 1–240. doi: 10.1007/978-1-4419-7793-9
6. Cuche E, Marquet P, Depeursinge C. Simultaneous amplitude-contrast and quantitative phase-contrast microscopy by numerical reconstruction of Fresnel off-axis holograms. Appl Opt. (1999) 38:6994–7001. doi: 10.1364/AO.38.006994
7. De Nicola S, Ferraro P, Finizio A, Grilli S, Coppola G, Iodice M, et al. Surface topography of microstructures in lithium niobate by digital holographic microscopy. Meas Sci Technol. (2004) 15:961–8. doi: 10.1088/0957-0233/15/5/026
8. Kühn J, Colomb T, Montfort F, Charrière F, Emery Y, Cuche E, et al. Real-time dual-wavelength digital holographic microscopy with a single hologram acquisition. Opt Express. (2007) 15:7231–42. doi: 10.1364/OE.15.007231
9. Castañeda R, Garcia-Sucerquia J. Single-shot 3D topography of reflective samples with digital holographic microscopy. Appl Opt. (2018) 57:A12. doi: 10.1364/AO.57.000A12
10. Cuche E, Bevilacqua F, Depeursinge C. Digital holography for quantitative phase-contrast imaging. Opt Lett. (1999) 24:291–3. doi: 10.1364/OL.24.000291
11. Iwai H, Fang-Yen C, Popescu G, Wax A, Badizadegan K, Dasari RR, et al. Quantitative phase imaging using actively stabilized phase-shifting low-coherence interferometry. Opt Lett. (2004) 29:2399. doi: 10.1364/OL.29.002399
12. Massatsch P, Charrière F, Cuche E, Marquat P, Depeursinge CD. Time-domain optical coherence tomography with digital holographic microscopy. Appl Opt. (2005) 44:1806–12. doi: 10.1364/AO.44.001806
13. Khmaladze A, Restrepo-Martínez A, Kim M, Castañeda R, Blandón A. Simultaneous dual-wavelength reflection digital holography applied to the study of the porous coal samples. Appl Opt. (2008) 47:3203–10. doi: 10.1364/AO.47.003203
14. Kemper B, Stürwald S, Remmersmann C, Langehanenberg P, von Bally G. Characterisation of light emitting diodes (LEDs) for application in digital holographic microscopy for inspection of micro and nanostructured surfaces. Opt Lasers Eng. (2008) 46:499–507. doi: 10.1016/j.optlaseng.2008.03.007
15. Reichelt S, Zappe H. Combined Twyman-Green and Mach-Zehnder interferometer for microlens testing. Appl Opt. (2005) 44:5786–92. doi: 10.1364/AO.44.005786
16. Běhal J. Quantitative phase imaging in common-path cross-referenced holographic microscopy using double-exposure method. Sci Rep. (2019) 9:1–7. doi: 10.1038/s41598-019-46348-9
17. Edwards C, Arbabi A, Popescu G, Goddard LL. Optically monitoring and controlling nanoscale topography during semiconductor etching. Light Sci Appl. (2012) 1:e30. doi: 10.1038/lsa.2012.30
18. León-Rodríguez M, Rodríguez-Vera R, Rayas JA, Calixto S. Digital holographic microscopy through a Mirau interferometric objective. Opt Lasers Eng. (2013) 51:240–5. doi: 10.1016/j.optlaseng.2012.10.006
19. Edwards C, Zhou R, Hwang S-W, McKeown SJ, Wang K, Bhaduri B, et al. Diffraction phase microscopy: monitoring nanoscale dynamics in materials science [Invited]. Appl Opt. (2014) 53:G33–43. doi: 10.1364/AO.53.000G33
20. Finkeldey M, Göring L, Brenner C, Hofmann M, Gerhardt NC. Depth-filtering in common-path digital holographic microscopy. Opt Express. (2017) 25:1939–8. doi: 10.1364/OE.25.019398
21. Stockton PA, Field JJ, Bartels RA. Single pixel quantitative phase imaging with spatial frequency projections. Methods. (2018) 136:24–34. doi: 10.1016/j.ymeth.2017.10.007
22. Worts N, Field J, Bartels R, Jones J, Broderick J, Squier J. Interferometric spatial frequency modulation imaging. Opt Lett. (2018) 43:5351–4. doi: 10.1364/OL.43.005351
23. Picazo-Bueno JA, Micó V. Opposed-view spatially multiplexed interferometric microscopy. J Opt. (2019) 21:3570–1. doi: 10.1088/2040-8986/ab000e
24. Bon P, Maucort G, Wattellier B, Monneret S. Quadriwave lateral shearing interferometry for quantitative phase microscopy of living cells. Opt Express. (2009) 17:1308–0. doi: 10.1364/OE.17.013080
25. Singh ASG, Anand A, Leitgeb RA, Javidi B. Lateral shearing digital holographic imaging of small biological specimens. Opt Express. (2012) 20:2361–7. doi: 10.1364/OE.20.023617
26. Di J, Li Y, Xie M, Zhang J, Ma C, Xi T, et al. Dual-wavelength common-path digital holographic microscopy for quantitative phase imaging based on lateral shearing interferometry. Appl Opt. (2016) 55:7287–93. doi: 10.1364/AO.55.007287
27. Ma C, Li Y, Zhang J, Li P, Xi T, Di J, et al. Lateral shearing common-path digital holographic microscopy based on a slightly trapezoid Sagnac interferometer. Opt Express. (2017) 25:1365–9. doi: 10.1364/OE.25.013659
28. Chhaniwal V, Singh ASG, Leitgeb RA, Javidi B, Anand A. Quantitative phase-contrast imaging with compact digital holographic microscope employing Lloyd's mirror. Opt Lett. (2012) 37:5127–9. doi: 10.1364/OL.37.005127
29. Mico V, Zalevsky Z, García J. Superresolution optical system by common-path interferometry. Opt Express. (2006) 14:5168–77. doi: 10.1364/OE.14.005168
30. Ferrari JA, Frins EM. Single-element interferometer. Opt Commun. (2007) 279:235–9. doi: 10.1016/j.optcom.2007.07.038
31. Ebrahimi S, Dashtdar M, Sánchez-Ortiga E, Martínez-Corral M, Javidi B. Stable and simple quantitative phase-contrast imaging by Fresnel biprism. Appl Phys Lett. (2018) 112:1–5. doi: 10.1063/1.5021008
32. Singh V, Tayal S, Mehta DS. Highly stable wide-field common path digital holographic microscope based on a Fresnel biprism interferometer. OSA Contin. (2018) 1:48–55. doi: 10.1364/OSAC.1.000048
33. Singh V, Joshi R, Tayal S, Mehta DS. Speckle-free common-path quantitative phase imaging with high temporal phase stability using a partially spatially coherent multi-spectral light source. Laser Phys Lett. (2019) 16:256–01. doi: 10.1088/1612-202X/aaf179
34. Hayes-Rounds C, Bogue-Jimenez B, Garcia-Sucerquia J, Skalli O, Doblas A. Advantages of Fresnel biprism-based digital holographic microscopy in quantitative phase imaging. J Biomed Opt. (2020) 25:865–01. doi: 10.1117/1.JBO.25.8.086501
35. Mico V, Ferreira C, Zalevsky Z, García J. Spatially-multiplexed interferometric microscopy (SMIM): converting a standard microscope into a holographic one. Opt Express. (2014) 22:1492–9. doi: 10.1364/OE.22.014929
36. Picazo-Bueno JÁ, Zalevsky Z, García J, Ferreira C, Micó V. Spatially multiplexed interferometric microscopy with partially coherent illumination. J Biomed Opt. (2016) 21:1060–07. doi: 10.1117/1.JBO.21.10.106007
37. Picazo-Bueno JÁ, Zalevsky Z, García J, Micó V. Superresolved spatially multiplexed interferometric microscopy. Opt Lett. (2017) 42:927. doi: 10.1364/OL.42.000927
38. Picazo-Bueno JÁ, Trusiak M, García J, Patorski K, Micó V. Hilbert–Huang single-shot spatially multiplexed interferometric microscopy. Opt Lett. (2018) 43:1007. doi: 10.1364/OL.43.001007
39. Mico V, Zalevsky Z, García J. Common-path phase-shifting digital holographic microscopy: a way to quantitative phase imaging and superresolution. Opt Commun. (2008) 281:4273–81. doi: 10.1016/j.optcom.2008.04.079
40. Mico V. Quantitative phase imaging by common-path interferometric microscopy: application to super-resolved imaging and nanophotonics. J Nanophotonics. (2009) 3:317–80. doi: 10.1117/1.3155822
42. Kim MK. Principles and techniques of digital holographic microscopy. SPIE Rev. (2010) 1:018005. doi: 10.1117/6.0000006
43. Born M, Wolf E. Principles of optics 7th edition. Principles of Optics Electromagnetic Theory of Propagation Interference and Diffraction of Light. (1999). p. 1–95.
Keywords: digital holographic microscopy, quantitative phase imaging (QPI), interference microscopy, reflective microscopy, diffraction grating, phase measurememnt, nanometric topography
Citation: Picazo-Bueno JÁ, García J and Micó V (2021) Single-Element Reflective Digital Holographic Microscopy. Front. Phys. 9:639607. doi: 10.3389/fphy.2021.639607
Received: 09 December 2020; Accepted: 22 February 2021;
Published: 22 March 2021.
Edited by:
Xinping Zhang, Beijing University of Technology, ChinaReviewed by:
Ana Doblas, University of Memphis, United StatesRandy Bartels, Colorado State University, United States
Copyright © 2021 Picazo-Bueno, García and Micó. This is an open-access article distributed under the terms of the Creative Commons Attribution License (CC BY). The use, distribution or reproduction in other forums is permitted, provided the original author(s) and the copyright owner(s) are credited and that the original publication in this journal is cited, in accordance with accepted academic practice. No use, distribution or reproduction is permitted which does not comply with these terms.
*Correspondence: José Ángel Picazo-Bueno, ai5hbmdlbC5waWNhem9AdXYuZXM=