- 1Univ. Lille, CNRS, UMR 8523-PhLAM–Physique Des Lasers Atomes Et Molécules, Lille, France
- 2Alcatel Submarine Networks, Calais, France
- 3Department of Engineering, University of Ferrara, Ferrara, Italy
- 4Optical Sciences Group, Department of Theoretical Physics, Research School of Physics, The Australian National University, Canberra, ACT, Australia
We report recent results obtained with a novel optical fiber experimental setup based on a heterodyne optical time-domain reflectometer in the context of FPU recurrence process. Moreover, we actively compensate the dissipation of the system. We show that we can observe several FPU recurrences by monitoring the power and relative phase evolutions of the main discrete frequency components involved in the process.
1 Introduction
The Fermi-Pasta-Ulam (FPU) recurrence process describes the ability of a multimodal nonlinear system to come back to its initial state after its energy had been distributed over its modes during the evolution. It had been discovered in the 50s by Fermi and co-workers who were studying the dynamics of a chain of nonlinearly coupled oscillators [1]. The problem has been extensively studied and led to the development of a theory allowing to explain the formation of solitons by Zabusky and Kruskal in 1965 [2]. Since then, the FPU recurrence process has been especially investigated for its role in chaos [3] and for its relation with the nonlinear stage of modulation instability (MI), in the framework of nonlinear systems which can be described by the nonlinear Schrödinger equation (NLSE). In particular, it led to the development of breathers theory [4], which plays an important role in the description of rogue waves formation [5–10]. Experimentally, FPU had been observed in several fields of physics such as hydrodynamics [11] and electric transmission lines [12].
The first observation of FPU recurrence in optics has been achieved in 2001 by Van Simaeys et al. [13]. The main issue was to monitor the longitudinal evolution of the optical power along the fiber to confirm that the system indeed came back to its initial state. Van Simaeys et al. [13] succeeded via an indirect measurement method. These results attracted a lot of attention from the nonlinear scientific community with the publication of a short editorial in the prestigious Nature journal [14]. Indeed, optical fibers constitute a fantastic test bed for investigations of such complex nonlinear processes as they offer an easy tuning of initial conditions, an accurate control of fiber parameters and an accurate characterization of the output field with sub-ten femtosecond resolution. For those reasons, this pioneering result has motivated numerous studies of FPU, breathers or rogue wave formation in fiber optics [8, 10, 15–21]. This non-exhaustive list of works highlights the strong interest for this experimental system. However, there are two main limitations in fiber optics systems. Firstly, the monitoring of the longitudinal evolution of the field is not straightforward while it is crucial in FPU recurrence investigations to unambiguously prove that the systems evolved before coming back to its initial state. Van Simaens et al. exploited the invariant properties of the NLSE. They used a fiber of fixed length and performed indirect distributed measurements by varying the optical power
In this paper we present a review of recent results obtained with a novel optical fiber experimental setup allowing a non-invasive distributed characterization of the amplitude and phase of the main frequency components of a laser pulse train based on a heterodyne optical time domain reflectometer (HOTDR) [31]. Moreover, we implemented an active loss compensation scheme by exploiting the Raman amplification effect to get an almost fully transparent fiber [31]. Note that other groups took benefit of a recirculating loop to observe two recurrences as it was originally done in telecommunications applications to emulate long-haul fiber systems [32].
The paper is organized as follows. In the first part, we present the experimental setup. We provide detailed information on the HOTDR technique and on the active loss compensation compared to already published papers. Then we review various striking results that we recently published [33–38]. We first show a detailed characterization of the FPU recurrence, highlighting the symmetry breaking of the process [33, 35], demonstrate a record of 4 recurrences in an ultra-low loss fiber [37] and reveal the observation of A- and B-type solutions of the NLSE [36]. Then we show that a spatio-temporal evolution of the whole electrical field can be extracted from HOTDR recordings [34]. We illustrate this with the fine characterization of first and second order breathers with sub-ps resolution.
2 Basic Concepts
MI results from the amplification of weak sidebands by a strong pump wave. A numerical example is provided in Figure 1. As initial conditions, we used a strong pump (

FIGURE 1. (A) Parametric gain. (B) Spatio-spectral and (C) spatio-temporal evolutions of a modulationally unstable wave. Parameters:
This behaviour is a manifestation of the FPU recurrence process. By further propagating in the fiber, the process can be repeated several times. In experiments we will aim at monitoring the evolution of the pump and sideband power evolution as well as their relative phase to characterize in detail the FPU recurrence process.
3 Experimental Setup
The full experimental setup of the HOTDR we have developed is shown in Figure 2A. It is relatively complex and cumbersome as seen in the laboratory picture in Figure 2B. In the following, we will explain each element step by step.
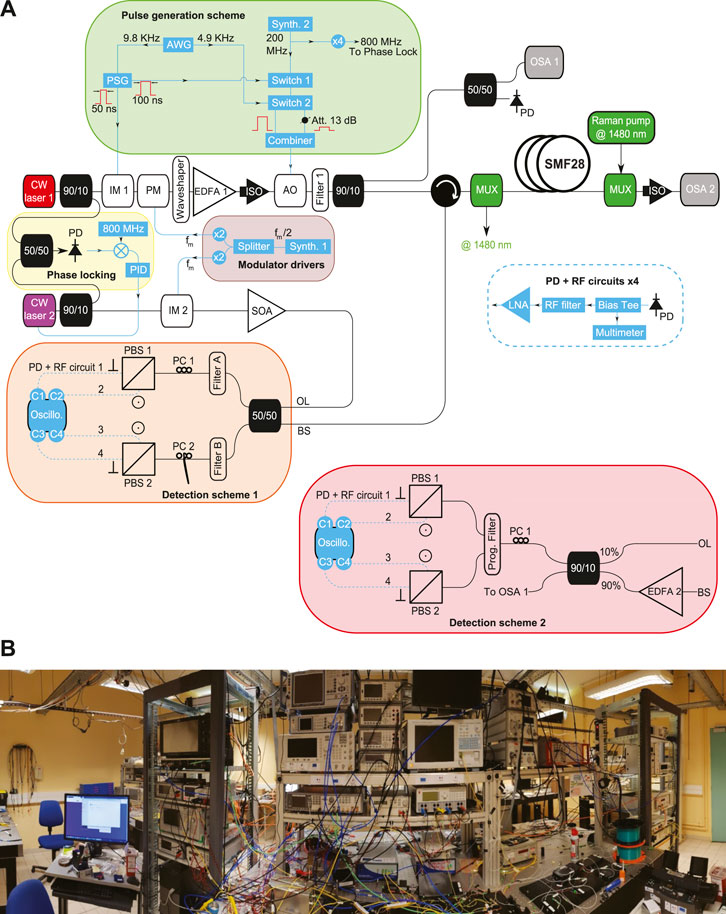
FIGURE 2. (A) Experimental setup. Laser 1 is a narrow linewidth (100 Hz at FWHM) CW laser and laser 2 is a continuous distributed feedback laser diode. IM (1,2): intensity modulator, PM, phase modulator; AWG, arbitrary waveform generator; EDFA (1,2), erbium-doped fiber amplifier; ISO, isolator; AO, acousto-optic modulator; MUX, multiplexer or de-multiplexer; SOA, semiconductor optical amplifier; PID, proportional, integral, derivative controller; PD, photo-detector; PC, polarization controller; PBS, polarization beam splitter; RF, radio frequency; LNA, low-noize radio frequency amplifier. All instruments of the setup (including the oscilloscope) are referenced to the same 10 MHz clock. (B) Picture of the experiment.
3.1 Initial Conditions
The initial conditions we use to observe the FPU process consist of a pump and a pair of sidebands. To generate such a three-wave input, we first modulate the intensity of the CW beam delivered by laser 1 in order to get 50 ns square-shaped pulses (Figure 3A) at a 9.8 KHz (
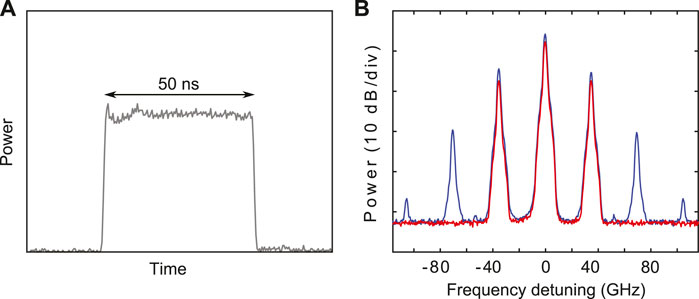
FIGURE 3. (A) Temporal profile of the pulse. (B) Spectral profile of the pulses at the output of the waveshaper without any correction filter applied (blue) and with a filter applied (red).
3.2 Local Oscillator and Phase-Locking
In order to perform phase measurements via heterodyning, the local oscillator (laser 2) has to be initially phase-locked with laser 1. To do so, we used the method described in ref. 39 based on laser difference-frequency. A 5 GHz bandwidth photodiode receives the beat note of laser 1 and 2 which is then mixed with a 800 MHz RF reference signal provided by a stable synthesizer. In order to have a beat note close to 800 MHz, the frequency of laser 2 can be coarsely tuned via its power supply. The resulting intermediate frequency goes then through a PID controller (with a response time less than 15 ns) which drives the phase of the local oscillator. The efficiency of the phase-locking can be monitored by looking at the beat signal of laser 1 and 2 on a signal analyser as shown in Figures 4A,B, which display the RF spectrum (with a 100 Hz resolution) of the beat signal when the locking is turned off and on, respectively. Once the lasers are phase-locked, the locking can last up to several hours. As we intend to perform measurements not only on the pump component but also on the signal/idler one, the laser 2 is modulated in intensity by IM2 to create sidebands spaced by 35 GHz so that each frequency component of interest has its own local oscillator. The RF signal driving IM2 is delivered by the same microwave source that is driving the previous phase modulator in order to ensure a fixed phase relation between them. The local oscillator is then amplified by a semiconductor optical amplifier (SOA) and the amplitude of its three main components is roughly equalized by tuning the DC bias voltage of IM2 to get similar local oscillators, as can be seen in Figure 4C, which shows the spectrum of the local oscillator after the SOA.
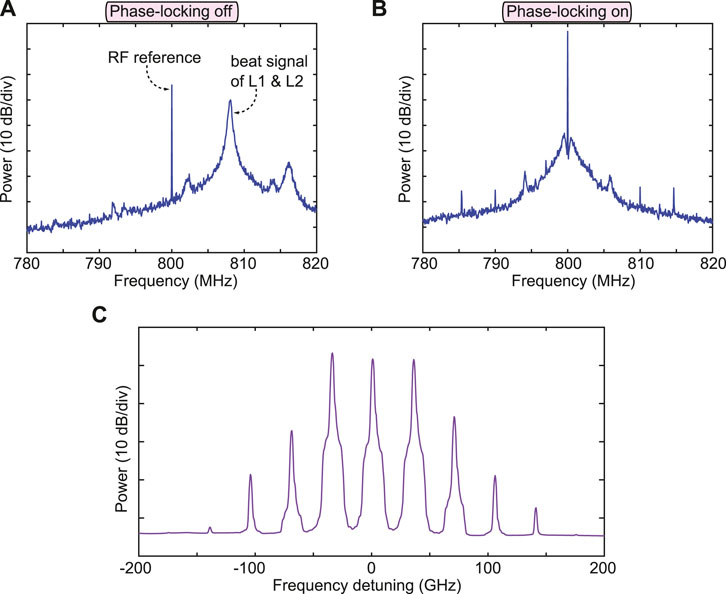
FIGURE 4. RF spectra of the mixing of the beat signal of L1 and L2 with the 800 MHz reference when the system is (A) not phase-locked and (B) phase-locked. (C) Optical spectrum of the local oscillator. These three phase-locked laser lines will be used to achieve three local oscillators to analyze the pump, idler and signal waves.
3.3 Active Loss Compensation
Linear losses have a strong influence on the FPU recurrence as illustrated in Figure 5. These figures display the pump and signal power evolutions for an initial signal to pump ratio of
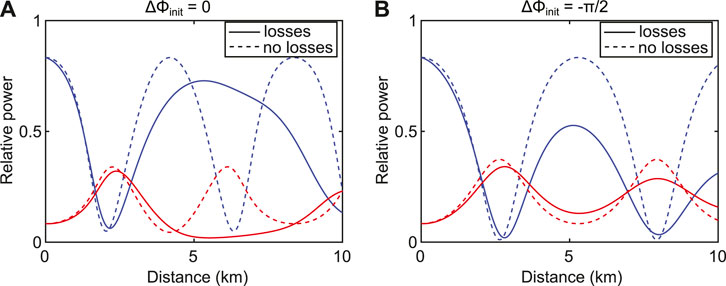
FIGURE 5. Influence of the linear attenuation on the recurrent process. (A) Pump (blue lines) and signal (red lines) power evolutions for
3.4 Fading Suppression Technique and Signal Processing
In OTDR, it is known that a random noise in amplitude and phase is superimposed on the backscattered signal [45]. This noise, which is detrimental as it leads to jagged measurements, finds its origins in the random state of polarization of the backscattered light and a speckle-like phenomenon due to huge number of scattered waves involved in the process and/or in the thermo-mechanical fluctuations of the propagating medium. In order to avoid it, many techniques have been developed such as averaging over a huge number of backscattered signal and polarization scrambling [46, 47]. However, none of these techniques have proven to be effective and compatible with accurate distributed phase measurements in our setup. Thus, we have developed a novel method which allows us to remove effectively this additional source of noise. We made two assumptions: 1) the fading phenomenon is a purely linear effect and 2) the thermo-mechanical fluctuations have a characteristic time of a few milliseconds. Therefore, we propose the following post-processing treatment to suppress the fading. We first launch a strong 50 ns pulse into the fiber which will experience both linear and nonlinear effects. Then, 102 μs later, a weak pulse, attenuated by 13 dB, follows experiencing mostly linear effects. The attenuation is obtained via the acousto-optic modulator which is driven at half-rate clock (4.9 KHz) so that one pulse over two is attenuated as it is displayed in the schematic in Figure 6A. Note that the 102 μs delay between two consecutive pulses is long enough to avoid any overlapping between two backscattered signals but very short compared to the response time of the thermo-mechanical fluctuations which ensures that the linear fading effects experienced by both backscattered waves (from the strong and weak pulses) are strongly correlated. The output spectra at the input and output of the fiber of weak and strong pulses are displayed in Figures 6B,C. We observe that for strong pulses (magenta lines), the spectrum is composed of 11 waves in this typical example corresponding to the broadest spectrum achievable by increasing the pump power to get the first maximum compression point at the output of the fiber. In the opposite case, we observe a spectrum made of 3 main waves (cyan lines) plus weak harmonics 25 dB lower than signal/idler wave. We can thus consider that these weak pulses mainly experience linear effects. Note that we analyze each state of polarization of backscattered signals independently (which are later recombined in post-processing) thanks to the use of polarization beam splitters, thus avoiding the need of polarization scrambling. Once the heterodyned signals are logged with the four channels of the oscilloscope (two channels for each polarization states of the pump and two for those of the signal), we proceed to the following data processing. We will refer to each traces observed on the oscilloscope as
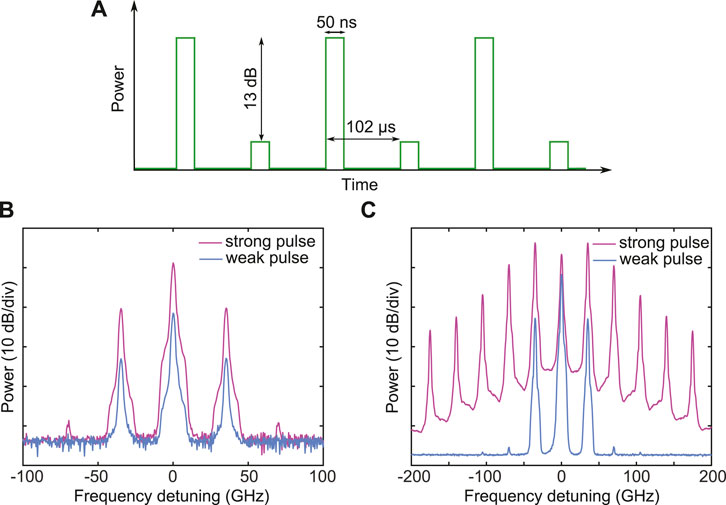
FIGURE 6. (A) Schematic of the sequence of pulses launched into the fiber. (B) Spectrum of the strong (magenta lines) and weak (cyan lines) pulses at the input of the fiber and (C) at the output of the fiber.
The performances of our measurement technique are illustrated in Figure 7. Figures 7A,E show a single-shot of the pump and signal power evolutions (normalized to their respective maxima) and their relative phase without calibration with the reference (weak pulse). One can distinguish the exchange of energy between the pump and the signal but the measurement is very noisy and the relative phase evolution does not agree at all with the one expected. Figures 7B,F show the same measurements but this time with the calibration (fading removed). Although the measurements are still very noisy, one can notice almost two recurrences by looking at the power evolutions and a specific relative phase evolution with jumps around 2 km and 6 km which are approximately the positions where the direction of the power flow between the pump and the sideband reverses. After averaging over one hundred shots, we observe a significant reduction of the noise as displayed in Figures 7C,G. We then obtain clean traces after applying a Savitzky–Golay filter as shown in Figures 7D,H. All results presented in this paper passed this data processing procedure. From this experimental setup and this data processing, we can record clean phase and intensity evolutions of pump and signal waves along the fiber length and to almost perfectly compensate attenuation. In the following, we are going to present a selection of results that we obtained with our HOTDR system, which were not accessible with other setups.
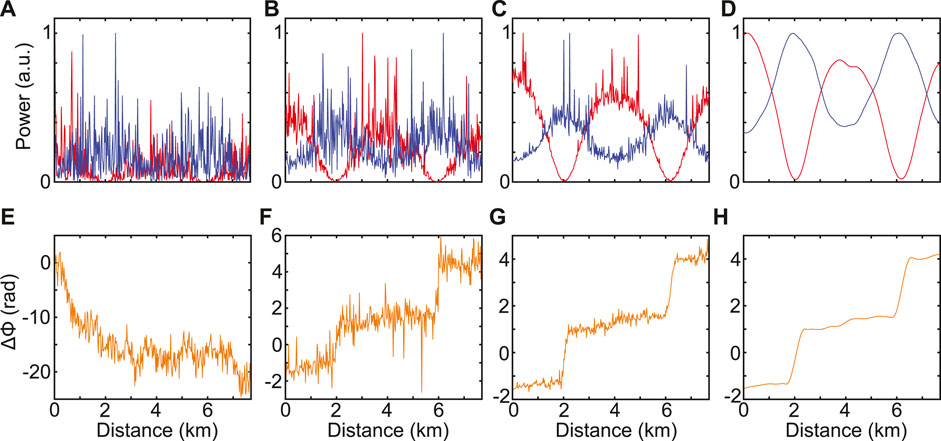
FIGURE 7. (A) Single-shot of the pump (red line) and signal (blue line) power evolutions along the fibre when the calibration is off and (B) when the calibration is on. (C) Averaging over a hundred shots of the pump and signal power evolution when the calibration is on and (D) same after filtering. (E,F,G,H) show the relative phase evolutions corresponding to (A–D) respectively. All powers plot are normalised to their respective maxima.
4 Fermi-Pasta-Ulam Recurrence Observation
4.1 Evolution as a Function of the Initial Relative Phase
We first present the impact of the initial relative phase value on the dynamics of the FPU recurrence process in Figure 8. The experimental parameters are detailed in Figure 8 caption. Firstly, we looked for the initial phase value allowing the system to evolve as close as possible to the separatrix (homoclinic orbit). This curve marks the border between the two main regimes of the system which consists of the inner or outer trajectories in the phase plane [29, 33, 48]. Theoretically, it corresponds to an input relative phase between the pump and the signal
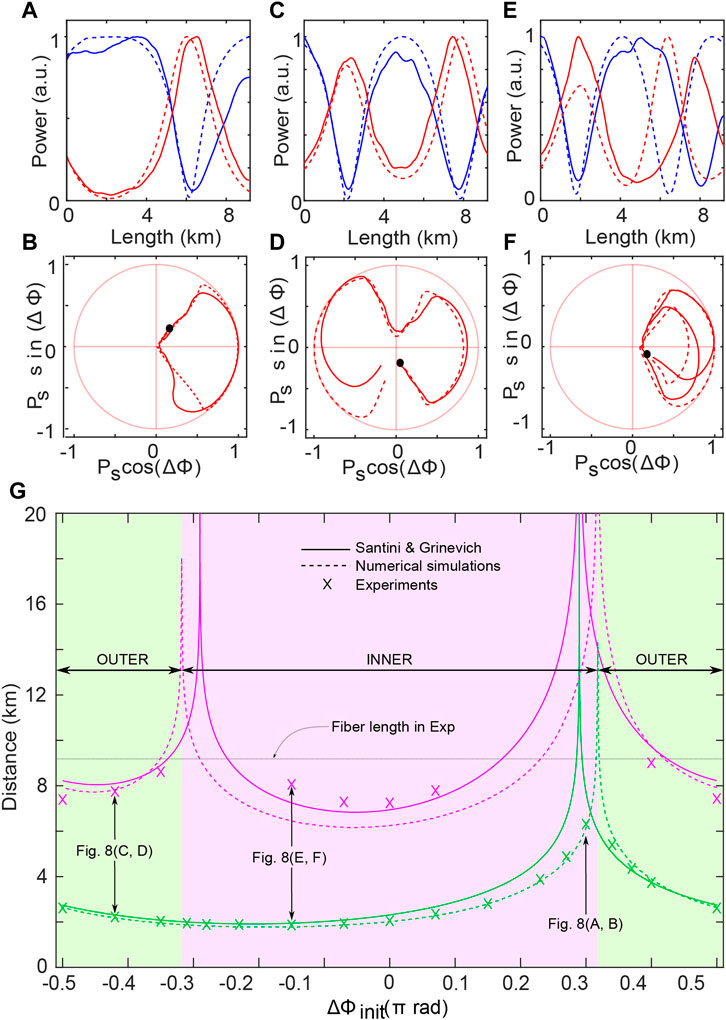
FIGURE 8. (A,C,E) Longitudinal evolution of the pump (blue) and signal (red) powers and (B,D,F) their corresponding phase plane trajectories, for
A single cycle of recurrence can be seen corresponding to a single loop in the right half side of the phase plane, as expected. Note that, a slight change of
The global evolution is summarized in Figure 8G. It shows the evolution of the position of the first and second maximum compression points as a function of the initial relative phase value
As we can see, the positions of the first and the second maximum compression points diverge both for
4.2 Record Observation of 4 Recurrences in an Ultra-Low Loss Optical Fiber
In the previous section, we reported the observation of two recurrences thanks to an active compensation of the loss using a counter-propagating Raman pump. Nonetheless, much remains to be done, since at present it is not clear how far one can go in observing a higher number of recurrences. This is a preliminary step for further studies on the onset of thermalization [50] for instance. The recirculating loop architecture reported by Goosens et al. [32] seems to be an other option, but reported results are still limited to two recurrences. Here we show that by improving our setup it is possible to observe more than 4 recurrences. To do so, we used an ultra-low loss optical fiber developed for ultra-long-haul submarine telecommunication systems [27] with 0.147 dB/km at 1550 nm (see details in ref. 37).
Figure 9 shows an example of recordings. We set the input phase to
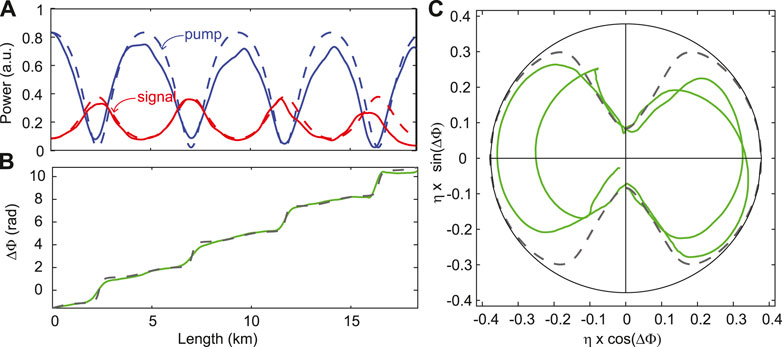
FIGURE 9. Longitudinal evolution of (A) the pump (blue line) and signal (red line) powers and (B) their relative phase for
4.3 Observation of Type-A and B Solutions of the Nonlinear Schrödinger Equation
Akhmediev breathers are exact solutions of NLSE that allow to predict for a single stage of growth to the apex and the asymptotic return to the initial state [4]. They do not allow to predict the formation of multiple FPU recurrences. Approximate solutions have been reported recently by means of finite-gap theory and asymptotic expansions to describe multiple recurrences [49]. Exact solutions have been derived by Akhmediev et al. and recently revisited to extract their Fourier coefficients [38]. There are two types of first-order solutions, termed type-A and type-B, according to their location in the infinite-dimensional phase space with respect to the homoclinic orbit corresponding to the Akhmediev breather trajectory [51, 52]. Here we show that they can be observed experimentally with our experimental setup for the first time. We triggered both type-A and type-B solutions by using three initial waves and setting their relative phases to
First we set
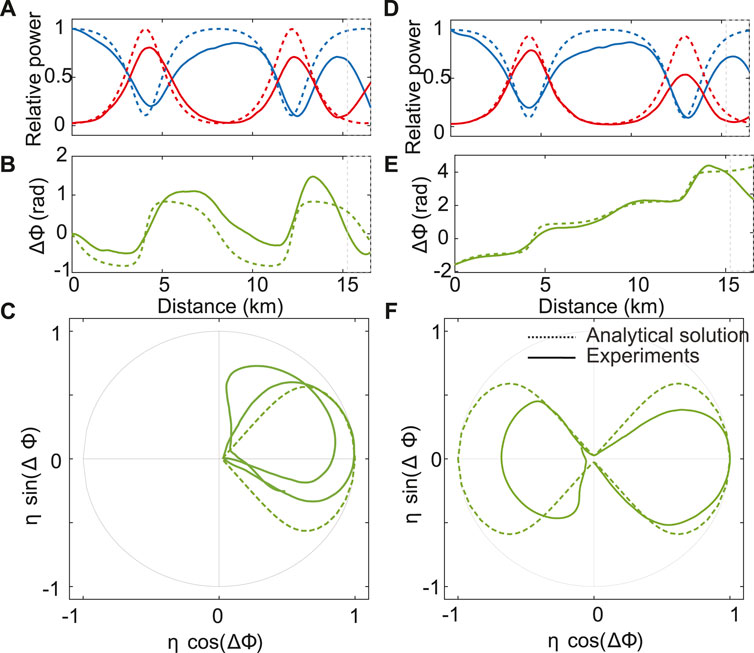
FIGURE 10. Evolution, along the fiber, of (A) the pump (blue lines) and the signal (red lines) powers, (B) the relative phase. (C) Phase-plane representation. Dotted lines correspond to the B-type first-order solution of the NLSE and solid lines to the experimental data. Each component is normalized with respect to the maximum value of the analytical solution. The initial relative phase is set to
4.4 Spatio-Temporal Characterization in Intensity and Phase
4.4.1 Principle
We saw that the measurement the phase and the intensity evolutions of different laser lines in the spectral domain was insightful and allowed the observation of new physical phenomena. However, getting the spatio-temporal evolution of the electric field would be more meaningful, providing an observation of FPU recurrence in space. This requires phase and intensity measurements with sub-picosecond resolution. Standard techniques such as frequency-resolved optical gating [54] and spectral phase interferometry for direct-electric field reconstruction [55] (a review can be found in ref. 56) provide these information with an excellent temporal resolution. Recently, new methods allowing real-time full-field characterization have been developed, based in particular on advanced time lens [21] and/or standard time lens combined with a dispersive Fourier transform technique [57] with typically sub-hundred’s femtosecond resolution. However, these techniques [21, 54–58] are limited to localized measurements. Note that Xu
4.4.2 First Order Breathers
We show here the spatio-temporal evolution of the FPU recurrence process presented in previous paragraphs. The detection of the five waves requires launching five waves at the fiber input in order to improve the signal-to-noize ratio in the heterodyne detection stage. So we launched two additional waves compared to previous experiments, but we checked numerically that they are so weak (20 dB lower than the pump), that they do not affect the dynamics of the system. We only record the evolution of the pump, signal and its first harmonic as displayed in Figures 11A,B. It shows the longitudinal power (Figure 11A) and phase evolutions (Figure 11B) in solid lines for experiments. The system exhibits two recurrences, in good agreement with numerical simulations depicted in dashed lines. We then calculate the spatio-temporal evolution of the field via the inverse Fourier transform from the five waves. The intensity plot is displayed in Figure 11C and exhibits two maximum compression points at about 1.5 km and 6 km, respectively, which are in phase, as expected (here
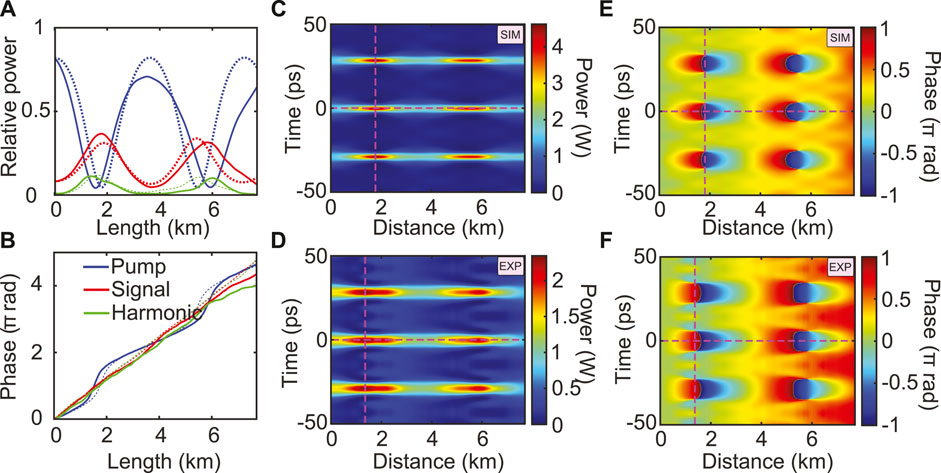
FIGURE 11. (A, B) Power and phase of the pump, signal and first harmonic (solid lines for experiments and dashed lines for numerics). Spatio-temporal evolutions of the power and phase, (C, E) from numerics and (D, F) from experiments calculated from the inverse Fourier transform of the whole spectrum in numerics and truncated to 5 waves in experiments. Parameters:
The spatio-temporal evolution of the phase of the field is displayed in Figures 11E,F. The experimental evolution is in very good agreement with numerical simulations, the impact of the truncation being less pronounced on the phase evolution. Noteworthy, in the temporal case (Figure 11G), we observe a phase jump close to π between the center of the pulses and their wings and equal to π in simulations which is one of the characteristic features of Akhmediev breathers and Peregrine soliton [8]. More details can be found in ref. 34 where we also reported the spatio-temporal evolution of the FPU recurrence when the symmetry is broken. Finally, we demonstrated that our HOTDR system enables non-invasive distributed measurements of the electric field in the temporal domain with a resolution lying in the picosecond scale with a 20 m spatial resolution.
4.4.3 Second Order Breathers
Second order breathers is a family of higher order solutions of the NLSE [60]. They have already been observed in fiber optics systems by Frisquet et al. [18]. They are known to experience sharper edges and higher maximum powers compared to first-order solutions (e.g., the maximal normalized intensity of a first order breather is 9 while it is 25 for a second-order one). Thus, they are of great interest because they could constitute good prototypes to model extremely rare and powerful rogue waves. We will show that it is possible to record the spatio-temporal evolution of their intensity and phase with our experimental setup. The solution of the field envelope of a second-order breather is reported in ref. 60. We use the same normalized parameters in the following. In order to design the experimental initial conditions to trigger second-order breathers, we started from the analytical expression of these breathers [60] and truncated this solution to the 5 central components. We then use these 5 waves to trigger the formation of second order breathers.
We checked numerically (not shown here) that these solutions are very robust and while being excited by a truncated initial condition, they remain quasi-unchanged. We set the phase and amplitude in experiments by using the waveshaper (Figure 2).
As an example, we choose a solution for which signal and harmonics experience the same linear MI gain:

FIGURE 12. (A) Spectrum at
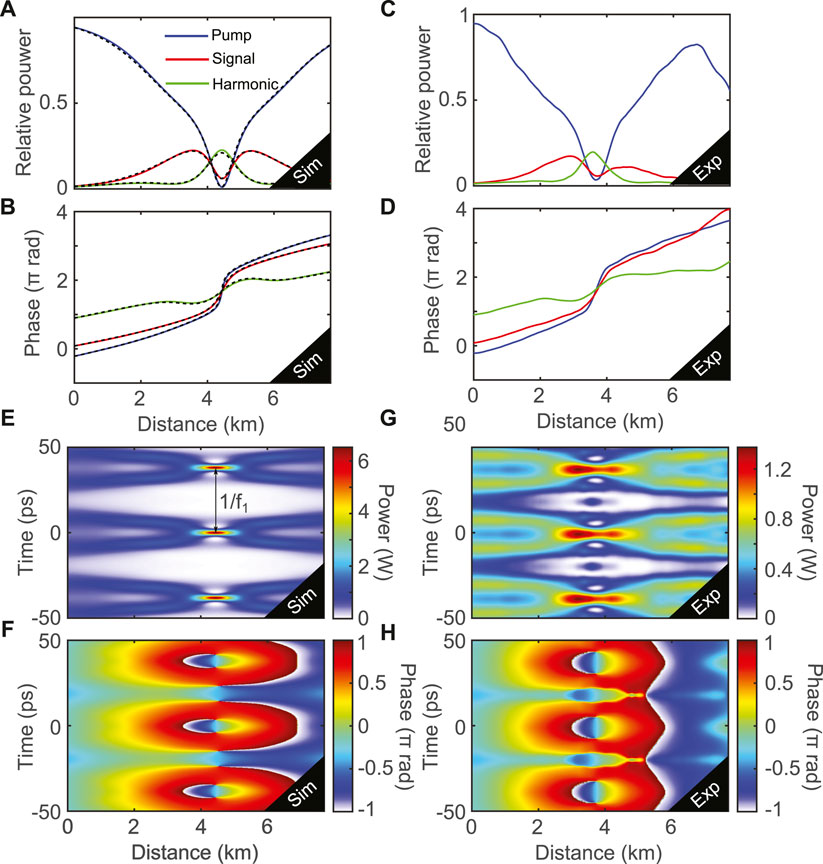
FIGURE 13. Relative pump, signal and harmonic power and phase evolutions, respectively, from (A,C) numerical simulations with a five-wave input and (B,D) from experiments. Blue lines correspond to the pump, red ones to the signal and green ones to the harmonic. Dashed black lines in (A,C) correspond to the analytical solution from Theory [61]. Spatio-temporal evolution of the field power and phase (E,G) from numerical simulations and (F,H) from experiments. The spatio-temporal plot of (F,H) are obtained through the inverse Fourier transform of fives waves. Parameters:
5 Conclusion
We have reviewed recent results obtained with a novel optical fiber experimental setup based on a heterodyne optical time-domain reflectometer allowing to monitor the power and relative phase evolution of the main discrete frequency components of a periodic laser pulse train. Moreover, we actively compensated fiber losses with a conter-propagating Raman pump leading to an almost fully transparent optical fiber which can be accurately modeled by the NLSE. We provided details about the experimental setup, notably about the multi-heterodyne detection technique, the phase-locking between the laser and the local oscillator, the solution we developed to suppress the fading effect, and the data processing. Then, we presented a selection of results recently obtained with this system in the context of the FPU recurrence process. It enabled the observation of several FPU recurrences for the first time, the study of their dynamics, and a direct comparison with analytical predictions from the pure NLSE. More precisely, the symmetry breaking of the FPU process has been observed by varying initial conditions, in excellent agreement with analytical predictions. Moreover, we showed by recording first harmonics in addition to the signal, idler, and pump waves it is possible to obtain the spatial evolution of the electric field of time-periodic pulses with a sub-ps resolution. We illustrated the performance of this technique by showing the power and phase evolution along the fiber of first and second-order breathers. All these results have been confirmed by numerical simulations, and remarkably with analytical solutions thanks to the efficient loss compensation scheme we developed. This original experimental setup combining dissipation compensation and non-invasive characterization of the electric field of a periodic laser pulse train is a powerful tool in nonlinear fiber optics experiments that could be implemented to investigate other nonlinear effects.
Author Contributions
CN and GV performed experiments and numerical simulations. PS and AM designed the experimental setup with AK and GM. MD provided optimized optical fibers. NA, MC, and ST developed theoretical/numerical tools. All authors analyzed results and participated in the writing of the paper.
Funding
This work was partly supported by the Agence Nationale de la Recherche through the Equipex Fibres optiques pour les hauts flux (FLUX)through the “Programme Investissements d’Avenir”, by the Ministry of Higher Education and Research, Hauts de France Council and European Regional Development Fund (ERDF) through the Contrat de Projets Etat-Region (CPER Photonics for Society, P4S), HEAFISY project and I-SITE through the FUHNKC, VERIFICO and EXAT projects and H2020 Marie Skodowska-Curie Actions (MSCA)(713694) and MEFISTA.
Conflict of Interest
The authors declare that the research was conducted in the absence of any commercial or financial relationships that could be construed as a potential conflict of interest.
Supplementary Material
The Supplementary Material for this article can be found online at: https://www.frontiersin.org/articles/10.3389/fphy.2021.637812/full#supplementary-material.
Footnotes
1Unfortunately, this removed also the linear phase due to the group velocity dispersion acquired during the propagation, which cannot be neglected as it directly impacts the dynamics of the system. The following phase term
References
1. Fermi E, Pasta P, Ulam S, Tsingou M. Studies of the nonlinear problems. In: Technical report. New Mexico: Los Alamos Scientific Lab. (1955).
2. Zabusky NJ, Kruskal MD. Interaction of "solitons" in a collisionless plasma and the recurrence of initial states. Phys Rev Lett (1965) 15(6):240. doi:10.1103/physrevlett.15.240
3. Zabusky NJ. Fermi-Pasta-Ulam, solitons and the fabric of nonlinear and computational science: history, synergetics, and visiometrics. Chaos (2005) 15(1):15102. doi:10.1063/1.1861554
4. Akhmediev NN, Eleonskii VM, Kulagin NE. Exact first-order solutions of the nonlinear Schrödinger equation. Theor Math Phys (1987) 72(2):809–18. doi:10.1007/bf01017105
5. Solli DR, Ropers C, Koonath P, Jalali B. Optical rogue waves. Nature (2007) 450(7172):1054–57. doi:10.1038/nature06402
6. Akhmediev N, Soto-Crespo JM, Ankiewicz A. Extreme waves that appear from nowhere: on the nature of rogue waves. Phys Lett (2009) 373(25):2137–45. doi:10.1016/j.physleta.2009.04.023
7. Akhmediev N, Dudley JM, Solli DR, Turitsyn SK. Recent progress in investigating optical rogue waves. J Optic (2013) 15(6):060201. doi:10.1088/2040-8978/15/6/060201
8. Dudley JM, Dias F, Erkintalo M, Genty G. Instabilities, breathers and rogue waves in optics. Nat Photon (2014) 8(10):755–64. doi:10.1038/nphoton.2014.220
9. Akhmediev N, Kibler B, Baronio F, Belić M, Zhong WP, Zhang Y, et al. Roadmap on optical rogue waves and extreme events. J Opt (2016) 18(6):063001. doi:10.1088/2040-8978/18/6/063001
10. Dudley JM, Genty G, Mussot A, Chabchoub A, Dias F. Rogue waves and analogies in optics and oceanography. Nat Rev Phys 1(11):675–89. doi:10.1038/s42254-019-0100-0
11. Lake BM, Yuen HC, Rungaldier H, Ferguson WE. Nonlinear deep-water waves: theory and experiment. part 2. evolution of a continuous wave train. J Fluid Mech (1977) 83(1):49–74. doi:10.1017/S0022112077001037
12. Jäger D. Soliton propagation along periodic-loaded transmission line. Appl Phys (1978) 16(1):35–8. doi:10.1007/bf00931418
13. Van Simaeys G, Emplit P, Haelterman M. Experimental demonstration of the Fermi-Pasta-Ulam recurrence in a modulationally unstable optical wave. Phys Rev Lett (2001) 87(3):033902. doi:10.1103/PhysRevLett.87.033902
14. Akhmediev NN. Nonlinear physics. Déjà vu in optics. Nature (2001) 413(6853):267–8. doi:10.1038/35095154
15. Mussot A, Kudlinski A, Droques M, Szriftgiser N, Akhmediev N. Fermi-Pasta-Ulam recurrence in nonlinear fiber optics: the role of reversible and irreversible losses. Phys Rev X (2014) 4(1):011054. doi:10.1103/physrevx.4.011054
16. Kibler B, Fatome J, Finot C, Millot G, Dias F, Genty G, et al. The Peregrine soliton in nonlinear fibre optics. Nat Phys (2010) 6(10):790–5. doi:10.1038/nphys1740
17. Kibler B, Fatome J, Finot C, Millot G, Genty G, Wetzel B, et al. Observation of Kuznetsov-Ma soliton dynamics in optical fibre. Sci Rep (2012) 2:463. doi:10.1038/srep00463
18. Frisquet B, Kibler B, Millot G. Collision of Akhmediev breathers in nonlinear fiber optics. Phys Rev X (2013) 3(4):041032. doi:10.1103/physrevx.3.041032
19. Hammani K, Wetzel B, Kibler B, Fatome J, Finot C, Millot G, et al. Spectral dynamics of modulation instability described using Akhmediev breather theory. Opt Lett (2011) 36(11):2140–2. doi:10.1364/OL.36.002140
20. Erkintalo M, Hammani K, Kibler B, Finot C, Akhmediev N, Dudley JM, et al. Higher-order modulation instability in nonlinear fiber optics. Phys Rev Lett (2011) 107(25):253901. doi:10.1103/PhysRevLett.107.253901
21. Tikan A, Bielawski S, Szwaj C, Randoux S, Suret P. Single-shot measurement of phase and amplitude by using a heterodyne time-lens system and ultrafast digital time-holography. Nat Photon (2018) 12(4):228–34. doi:10.1038/s41566-018-0113-8
22. Thévenaz L. Review and progress in distributed fiber sensing. In: Optical fiber sensors. Cancun, Mexico: Optical Society of America (2006). ThC1.
23. Armand V, Alasia D, Lantz E, Maillotte H, Thévenaz L, Gonzalez-Herraez M, et al. Brillouin optical time-domain analysis of fiber-optic parametric amplifiers. IEEE Photon Technol Lett (2007) 19(3):179–81. doi:10.1109/LPT.2006.890039
24. Alishahi F, Vedadi A, Shoaie MA, Soto MA, Denisov A, Mehrany K, et al. Power evolution along phase-sensitive parametric amplifiers: an experimental survey. Opt Lett (2014) 39(21):6114–7. doi:10.1364/OL.39.006114
25. Hu X, Chen W, Lu Y, Yu Z, Chen M, Meng Z. Distributed measurement of fermi-pasta-ulam recurrence in optical fibers. IEEE Photon Technol Lett (2018) 30(1):47–50. doi:10.1109/lpt.2017.2773615
26. Martins HF, Martin-Lopez S, Corredera P, Salgado P, Frazão O, González-Herráez M. Modulation instability-induced fading in phase-sensitive optical time-domain reflectometry. Opt Lett (2013) 38(6):872–4. doi:10.1364/OL.38.000872
27. Tamura Y, Sakuma H, Morita K, Suzuki M, Yamamoto Y, Shimada K, et al. Lowest-ever 0.1419-db/km loss optical fiber. In: Optical fiber communication Conference, 2017 March 19-23, Los Angeles, CA. Optical Society of America (2017). Th5D–1.
28. Bendahmane A, Mussot A, Kudlinski A, Szriftgiser, P, Conforti M, Wabnitz S, et al. Optimal frequency conversion in the nonlinear stage of modulation instability. Optic Express (2015) 23(24):30861–71. doi:10.1364/OE.23.030861
29. Moon HT. Homoclinic crossings and pattern selection. Phys Rev Lett (1990) 64(4):412. doi:10.1103/PhysRevLett.64.412
30. Pierangeli D, Flammini M, Zhang L, Marcucci G, Agranat AJ, Grinevich PG, et al. Observation of Fermi-Pasta-Ulam-Tsingou recurrence and its exact dynamics. Phys Rev X (2018) 8(4):041017. doi:10.1103/physrevx.8.041017
31. Mussot A, Naveau C, Conforti M, Kudlinski A, Copie F, Szriftgiser P, et al. Fibre multi-wave mixing combs reveal the broken symmetry of Fermi-Pasta-Ulam recurrence. Nat Photon (2018) 12(5):303–8. doi:10.1038/s41566-018-0136-1
32. Goossens JW, Hafermann H, Jaouën Y. Experimental realization of fermi-pasta-ulam-tsingou recurrence in a long-haul optical fiber transmission system. Sci Rep (2019) 9(1):1–11. doi:10.1038/s41598-019-54825-4
33. Mussot A, Conforti M, Trillo S, Copie F, Alexandre K. Modulation instability in dispersion oscillating fibers. Adv Opt Photon (2018) 10(1):1–42. doi:10.1364/AOP.10.000001
34. Naveau C, Szriftgiser, P, Kudlinski A, Conforti M, Trillo S, Mussot A. Full-field characterization of breather dynamics over the whole length of an optical fiber. Opt Lett (2019) 44(4):763–6. doi:10.1364/OL.44.000763
35. Naveau C, Szriftgiser P, Kudlinski A, Conforti M, Trillo S, Mussot A. Experimental characterization of recurrences and separatrix crossing in modulation instability. Optic Lett (2019) 44(22):5426–9. doi:10.1364/ofc.2018.th3d.5
36. Vanderhaegen G, Szriftgiser P, Naveau C, Kudlinski A, Conforti M, Trillo S, et al. Observation of doubly periodic solutions of the nonlinear schrödinger equation in optical fibers. Opt Lett 45(13):3757–60. doi:10.1364/OL.394604
37. Vanderhaegen G, Szriftgiser P, Kudlinski A, Conforti M, Trillo S, Droques M, et al. 2020. Observation of four fermi-pasta-ulam-tsingou recurrences in an ultra-low-loss optical fiber, Opt Express. 28(12):17773–81. doi:10.1364/OE.391560
38. Conforti M, Mussot A, Kudlinski A, Trillo S, Akhmediev N. Doubly periodic solutions of the focusing nonlinear Schrödinger equation: recurrence, period doubling, and amplification outside the conventional modulation-instability band. Phys Rev A (2020) 101:023843. doi:10.1103/physreva.101.023843
39. Friederich F, Schuricht G, Deninger A, Lison F, Spickermann G, Haring Bolívar P, et al. Phase-locking of the beat signal of two distributed-feedback diode lasers to oscillators working in the mhz to thz range. Optic Express (2010) 18(8):8621–9. doi:10.1364/OE.18.008621
40. Headley C, Agrawal G. Raman amplification in fiber optical communication systems. 1st ed. Academic Press (2005). 392.
41. Juan Diego Ania-CastañónEllingham TJ, Ibbotson R, Chen X, Zhang L, Turitsyn SK. Ultralong raman fiber lasers as virtually lossless optical media. Phys Rev Lett (2006) 96:023902. doi:10.1103/physrevlett.96.023902
42. Xu G, Conforti M, Kudlinski A, Mussot A, Trillo S. Dispersive dam-break flow of a photon fluid. Phys Rev Lett (2017) 118(25):254101. doi:10.1103/PhysRevLett.118.254101
43. Kraych AE, Suret P, Gennady E, Randoux S. Nonlinear evolution of the locally induced modulational instability in fiber optics. Phys Rev Lett (2019) 122(5):054101. doi:10.1103/physrevlett.122.054101
46. Izumita H, Furukawa SI., Koyamada Y, Sankawa I. Fading noise reduction in coherent OTDR. IEEE Photon Technol Lett (1992) 4(2):201–3. doi:10.1109/68.122361
47. Yang G, Fan X, Wang B, Liu Q, He Z. Polarization fading elimination in phase-extracted OTDR for distributed fiber-optic vibration sensing. In: 2016 21st OptoElectronics and Communications Conference (OECC) held jointly with 2016 International Conference on Photonics in Switching (PS), 2016 July 3-7. Niigata, Japan. IEEE (2016). pages 1–3.
48. Trillo S, Wabnitz S. Dynamics of the nonlinear modulational instability in optical fibers. Opt Lett (1991) 16(13):986–8. doi:10.1364/ol.16.000986
49. Grinevich PG, Santini PM. The exact rogue wave recurrence in the NLS periodic setting via matched asymptotic expansions, for 1 and 2 unstable modes. Phys Lett (2018) 382(14):973–9. doi:10.1016/j.physleta.2018.02.014
50. Wabnitz S, Akhmediev N. Efficient modulation frequency doubling by induced modulation instability. Opt Commun (2010) 283(6):1152–4. doi:10.1016/j.optcom.2009.11.030
51. Kimmoun O, Hsu HC, Branger H, Li MS, Chen YY, Kharif C, et al. Modulation instability and phase-shifted Fermi-Pasta-Ulam recurrence. Sci Rep (2016) 6:28516. doi:10.1038/srep28516
52. Akhmediev NN, Korneev VI. Modulation instability and periodic solutions of the nonlinear Schrödinger equation. Theor Math Phys (1986) 69(2):1089–93. doi:10.1007/bf01037866
53. Chen J, Pelinovsky DE, White RE. Rogue waves on the double-periodic background in the focusing nonlinear Schrödinger equation. Phys Rev E (Nov 2019) 100:052219. doi:10.1103/PhysRevE.100.052219
54. Rick T. Frequency-resolved optical gating: the measurement of ultrashort laser pulses. Springer, Boston, MA: Springer Science & Business Media (2012).
55. Iaconis C, Walmsley IA. Spectral phase interferometry for direct electric-field reconstruction of ultrashort optical pulses. Opt Lett (1998) 23(10):792–4. doi:10.1364/ol.23.000792
56. Walmsley IA, Dorrer C. Characterization of ultrashort electromagnetic pulses. Adv Optic Photon (2009) 1(2):308–437. doi:10.1364/aop.1.000308
57. Ryczkowski P, Närhi M, Billet C, Merolla JM, Genty G, Dudley JM. Real-time full-field characterization of transient dissipative soliton dynamics in a mode-locked laser. Nat Photon (2018) 12(4):221–7. doi:10.1038/s41566-018-0106-7
58. Cheng L, Goda K. The complete optical oscilloscope. Nat Photon (2018) 12(4):190–1. doi:10.1038/s41566-018-0141-4
59. Xu G, Hammani K, Chabchoub A, Dudley JM, Kibler B, Finot C, 2019. Phase evolution of peregrine-like breathers in optics and hydrodynamics, Phys Rev E. 99(1):012207. doi:10.1103/PhysRevE.99.012207
60. Kedziora DJ, Ankiewicz A, Akhmediev N. Second-order nonlinear Schrödinger equation breather solutions in the degenerate and rogue wave limits. Phys Rev E - Stat Nonlinear Soft Matter Phys (2012) 85(6):066601. doi:10.1103/PhysRevE.85.066601
Keywords: Fermi Pasta Ulam recurrence, optical fibers, modulation instability, breathers and rogue waves, heterodyne, Rayleig
Citation: Naveau C, Vanderhaegen G, Szriftgiser P, Martinelli G, Droques M, Kudlinski A, Conforti M, Trillo S, Akhmediev N and Mussot A (2021) Heterodyne Optical Time Domain Reflectometer Combined With Active Loss Compensation: A Practical Tool for Investigating Fermi Pasta Ulam Recurrence Process and Breathers Dynamics in Optical Fibers. Front. Phys. 9:637812. doi: 10.3389/fphy.2021.637812
Received: 04 December 2020; Accepted: 12 January 2021;
Published: 15 April 2021.
Edited by:
Bertrand Kibler, UMR6303 Laboratoire Interdisciplinary Carnot De Bourgogne (ICB), FranceReviewed by:
Christophe Finot, Université De Bourgogne, FranceMiguel Gonzalez-Herraez, University of Alcalá, Spain
Copyright © 2021 Naveau, Vanderhaegen, Szriftgiser, Martinelli, Droques, Kudlinski, Conforti, Trillo, Akhmediev and Mussot. This is an open-access article distributed under the terms of the Creative Commons Attribution License (CC BY). The use, distribution or reproduction in other forums is permitted, provided the original author(s) and the copyright owner(s) are credited and that the original publication in this journal is cited, in accordance with accepted academic practice. No use, distribution or reproduction is permitted which does not comply with these terms.
*Correspondence: Arnaud Mussot, YXJuYXVkLm11c3NvdEB1bml2LWxpbGxlLmZy
 Corentin Naveau1
 Stefano Trillo
 Nail Akhmediev
 Arnaud Mussot