
95% of researchers rate our articles as excellent or good
Learn more about the work of our research integrity team to safeguard the quality of each article we publish.
Find out more
ORIGINAL RESEARCH article
Front. Phys. , 09 April 2021
Sec. Medical Physics and Imaging
Volume 9 - 2021 | https://doi.org/10.3389/fphy.2021.636001
This article is part of the Research Topic Applications of Cherenkov and Radioluminescence Imaging to Medicine and Biology View all 7 articles
 Ibrahim Oraiqat1*
 Essam Al-Snayyan2
 Andrew Calcaterra2
 Roy Clarke3,4Alnawaz Rehemtulla2Issam El Naqa1,2
Cerenkov Emission (CE) multispectral analysis with silicon photomultiplier (SiPM)-based optical probes is a promising tool for online tumor microenvironment interrogation and targeting during radiotherapy delivery. With the extreme sensitivity of SiPMs, deep tissue multispectral CE measurements can be realized in a clinical setting. In this work, we utilize our Cerenkov Emission Multi-spectral Imaging (CMSI) prototype probe to interrogate the spectral components of the CE signal generated during external beam radiotherapy. Our results demonstrated that CMSI enables effective probing of in vitro quantitative changes in the pH of cell media to monitor cancer cell proliferation after various treatment pathways and differentiate between varying treatment resistance cell lines. In addition, the feasibility of using the CMSI probe in vivo was also successfully demonstrated by measuring tumor pH during a pilot mouse study.
Cancer is one of the leading causes of the death in the world, and in 2018, it was the second leading cause of death in the United States [1, 2]. Cancerous tumors are comprised of heterogeneous structures consisting of cancer cells and stroma, which are the non-malignant cells that are also present in the tumor microenvironment (e.g., fibroblasts and endothelial cells) [3]. Most normal tissues, under well-perfused conditions, maintain a stable extracellular pH of around 7.4 [4]. On the other hand, malignant (cancerous) tumors, have an extracellular pH that is lower (more acidic) than the surrounding normal tissue. This is caused by aerobic glycolysis (also known as the Warburg Effect) that typically takes place in tumors, where fermentation (i.e., the anaerobic breakdown of glucose into lactate) is preferred over respiration, even in the presence of oxygen [3, 5, 6]. The combination of such fermentation in conjunction with poor tumor vasculature reduces the tumor extracellular pH. For instance, previous publications in the literature have reported an extracellular pH of 6.7 [7, 8] in several tumors. Typically, an acidic tumor microenvironment is indicative of metabolically aggressive cancer cells, which develop early within the tumor and eventually make their way into the tumor surface invading neighboring normal tissue using acidosis. For example, an acidic microenvironment may inhibit antitumor immune response, potentially leading to metastasis [4, 9, 10]. By determining acidic regions within a heterogeneous tumor, personalized tumor targeting using radiation dose painting [11] with radiotherapy, for instance, may lead to improved treatment outcomes.
For cancer treatment, one of the main tools available to clinicians is radiotherapy (RT), where ionizing radiation is used to treat cancer in a spatially conformal fashion. Linear Accelerators (linacs) are the most common source of radiation used in RT, which produce accelerated high energy electrons or x-ray photons. Linac delivered radiation typically has energies high enough, in the Megavoltage (MV) range, to induce Cerenkov Emission (CE), which is an optical light (peaked in the blue) generated from charged particles (the primary electrons or x-ray generated secondary electrons) going faster than the phase velocity of light in a given medium [12], which in this case is the biological tissue. Since CE is generated in any region that is receiving radiation dose, it has become an emerging modality for imaging radiation during RT and is also used as a quality assurance tool for its safe delivery. The intensity of CE is proportional to radiation dose [13–15] and has been used to measure superficial skin dose as well as to visualize radiation beam coverage, for example, in breast treatments and total skin electron therapy [16–20]. Additionally, CE has also become a useful tool for RT quality assurance by, for example, verifying radiation dose distribution in a water tank for treatment planning [21–23].
The optical spectrum of CE peaks is in the blue range of the visible light spectrum but also extends into the near infrared. Previous work has shown that CE can be used as a spectroscopy light source, for example, to determine oxygen saturation by measuring the spectral changes in CE from hemoglobin [24–26]. More recently, since CE peaks in the blue, it can be used as an optical excitation source for fluorescence with recent work showing how CE can be used to excite various fluorophores to measure tissue oxygenation in rodents [27–29]. Additionally, there has also been work using CE specific contrast agents for in vivo pH detection based on fluorinated (18F) pH indicator dyes (phenol red, cresol purple, and phenolphthalein), where the CE generated from the 18F component is optically quenched by the absorption from the functional dyes [30]. Other work has even shown the feasibility of using CE to image apoptosis to evaluate chemotherapy response of drug-resistant gastric cancers [31] as well as the use of CE to stimulate nanoparticles, such as europium oxide, to generate optical signals that can be used for image guidance during surgery [32].
Current work around measuring CE is done using sensitive cameras, such as those based on intensified charge-coupled device (iCCD) or intensified Complementary Metal Oxide Semiconductor (iCMOS) sensor technologies. Though the spatial resolution is excellent with these methods, one of the limitations of using a camera imaging at a distance away is that it is limited to superficial measurements of CE for dosimetry and is even more limited for deep tissue spectroscopy, where only a small region of the overall CE spectrum can be measured at any given time. An alternative approach involving on-skin, hypersensitive optical probes, based on solid-state silicon photomultipliers (SiPMs), has been shown to have the ability to measure CE that can result from deep seated regions in tissue with improved signal-to-noise ratio (SNR) [33]. This higher sensitivity is much needed for spectroscopy applications where the molecular signal is much weaker than that for typical irradiation dose measurements.
The work reported here extends the previous work using SiPM based optical probes [33] and introduces a novel Cerenkov Emission Multispectral Imaging (CMSI) optical probe application, based on SiPMs, that can take multiple spectral measurements of CE during external beam radiotherapy (EBRT). Here, we demonstrate that such CMSI probes can measure pH changes in vitro to delineate the treatment response in heterogeneous radiation sensitivity cell lines and has also shown promise in a pilot mouse study for in vivo pH measurements.
In order to demonstrate the feasibility of measuring pH spectroscopically, phenolsulfonphthalein, also known as phenol red (PR), is used as a pH contrast agent. PR is typically found in cell media (to monitor whether the cell media become too acidic or not) and clinically has been administered intravenously in the past to assess renal function [34]. It is worth noting here that other spectroscopic biomarkers are being investigated for this purpose, including ones that are already present in the tumor microenvironment.
The color of PR changes with changing pH, which is caused by pH dependent changes of the absorbance spectral lines at around 560 and 445 nm. Figure 1 shows the CE spectra of phosphate buffered solutions at different known pH values (verified using a benchtop pH meter (Fisherbrand, Accumet AE150) and referenced to the CE spectrum of deionized water to highlight the absorbance lines of PR) irradiated by 6 MV x-rays from a Varian Clinac. We took a ratio of the intensity values at 445 and 560 nm as the parameter used to quantify the PR spectra. The reason for using this ratio is to reduce the any measurement variations (i.e., changes in CE intensity) since the signal is essentially referenced to itself.
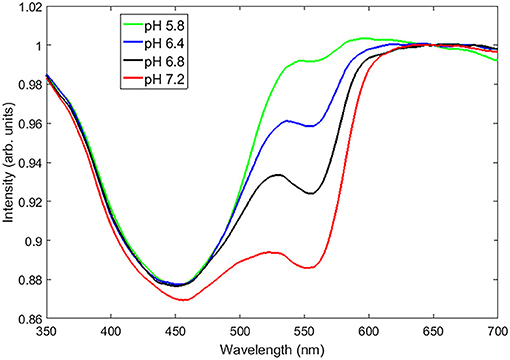
Figure 1. The CE spectra (referenced to deionized water) of a set of aqueous pH buffers ranging from a pH of 5.8–7.2 showing unique absorbance spectral lines at around 560 and 450 nm.
The CMSI optical probe (supplied by Endectra), shown in Figure 2A, consists of four 1 × 1 mm2 SiPM channels (MicroFC-10035-SMT, ON Semiconductor) mounted on a flexible substrate with integrated transimpedance amplifiers (2200 V/A), as described in greater detail in an earlier publication [33]. The multispectral configuration used for this work is shown schematically in Figure 2B, with two spectral channels, which have integrated optical bandpass filters (chosen based on the spectral features of interest), one channel with no optical filtration (in order to collect the integrated optical intensity), and one channel that is referred to as “Light-Blocked” (LB), which is opaque to incident optical light (measuring only the signal generated from either scattered radiation or CE generated within the filter/SiPM encapsulation material). Optical filters with the desired frequency band are cut to shape using a diamond saw with the desired frequency band and attached to each SiPM using an optical-grade adhesive (Norland, NOA 61).
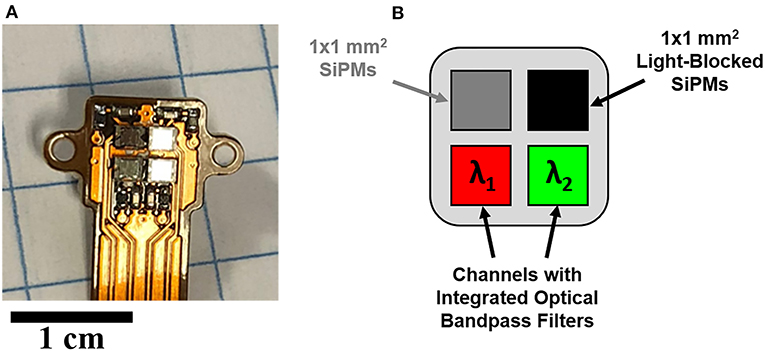
Figure 2. (A) The CMSI probe prototype, (B) The CMSI pixel layout, including the two integrated bandpass filters matched to the spectral features associated with phenol red.
In this work, the integrated optical bandpass filters for the two spectral channels are chosen to correspond with the pH dependent absorption lines of PR, which are around 450 and 560 nm. The two bandpass filters integrated into the CMSI probe used in this work have a central wavelength of 445 nm and 560 nm with a FWHM bandpass of 20 and 14 nm, respectively (Semrock, FF01-560/14 and FF01-445/20), as shown in S1. The channel with no optical filtration is used to trigger CE measurements of the other channels. The signal from the LB channel is subsequently subtracted from the two spectral channels to remove undesirable background signals (such as CE generated in the filter materials itself) to delineate the multispectral CE signal for each triggered event, which corresponds to individual linac pulses. Figure 3 shows the overall schematic of the CMSI setup where the CMSI probe is connected to the integrated pre-amplifier which is subsequently connected a 4-channel oscilloscope (PicoScope 2000 Series, Pico Technology) with data being recorded on a PC with a total of 256 traces (an example waveform is shown in the insert of Figure 3) acquired and averaged. The SiPM signal amplitude is defined as the difference between the average voltage prior to the triggered event (beam OFF) and the average voltage during the triggered event (beam ON). The root mean square (RMS) of the CMSI probe output in the absence of an optical signal (the system noise during beam OFF) was 6.63 mV. In these experiments the data acquisition was done online but the data analysis was done offline, post-irradiation, using Matlab (Mathworks, Inc.).
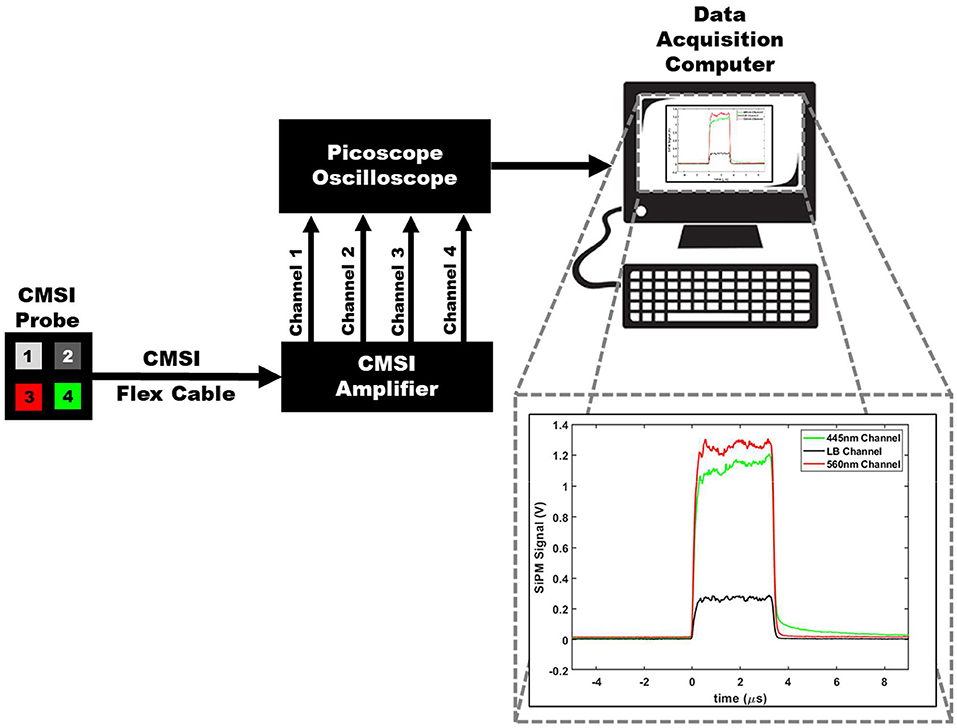
Figure 3. A schematic of the overall CMSI set up, including the CMSI probe, the CMSI amplifier, the Picoscope oscilloscope, as well as the data acquisition computer. The zoomed in view of the data acquisition computer screen shows an example of an averaged waveform in the time domain from the CMSI probe from 256 single linac pulses; the red and green lines correspond to the signals from the channels with the optical bandpass filters (445 and 560 nm, respectively) and the black line is the signal from the LB channel. Time of zero corresponds to the time the acquisition trigger threshold is met (i.e., the beginning of the linac pulse) and the negative values represent the time prior to the trigger.
In order to obtain quantitative information from the CMSI probe, it was first calibrated using a series of prepared phosphate pH buffers containing phenol red (100 mL of each buffer was placed in a 250 mL round Pyrex bottle) with the pH verified using the benchtop pH meter. The pH values used for calibration were: 6.4, 6.6, 6.8, 7.2, 7.4 (physiologically neutral), 7.6, and 7.8. These pH buffers were subsequently placed in a 3 × 3 cm2 6 MV photon field (Varian Truebeam) with the center of the CMSI probe placed at the gantry isocenter. Figure 4 shows a plot of the buffer pH values vs. the ratio of the SiPM signal amplitudes of the 445 and 560 nm CMSI channels, which we define as the CMSI ratio. A linear regression (R2 = 0.9599) is used to generate a calibration curve where the CMSI ratio can be used to read out a pH value.
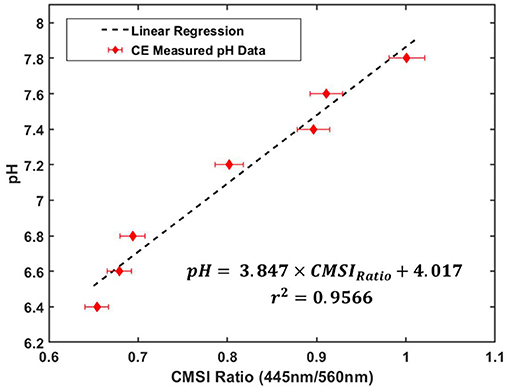
Figure 4. CMSI probe calibration plot, relating pH buffer values with the ratio of the SiPM signals at 445 and 560 nm of PR (known as the CMSI ratio) under linac irradiation with the corresponding linear regression equation and r2-value for the calibration data (the error bars correspond to about 2% error in the CMSI ratio measurement, which is estimated from the standard deviation of the ratio during measurement).
For in vitro CMSI measurements, we choose to compare two head and neck squamous cell carcinoma (HNSCC) cell lines that have different treatment sensitivity responses: UMSCC47 and UMSCC38. One cell line, UMSCC47, is human papilloma virus (HPV) positive while the other cell line is negative for HPV. The HPV positive cell line is known to be more responsive to treatment [35], while the HPV negative cell line is known to be resistive, giving us the differential effect that can be tested using CMSI. The cells were plated on T25 flasks in triplicates using 10 ml of DMEM cell media (containing PR and 10% fetal bovine serum). The cells are incubated at 37°C and 5% CO2. The cells were allowed to settle into the T25 flasks for 24 h prior to treatment.
A triplicate set of cells were treated with four different concentrations of the chemotherapy agent, cisplatin, which was added to the cell media (0, 0.2, 1.0, and 3.0 μM) for 1 h before swapping it out for fresh media. Another triplicate set of cells were treated with the same concentrations of cisplatin but also treated with 2 Gy of radiation using 320 kVp x-rays (Kimtron IC-320) during the cisplatin exposure. After the cell media were changed out after treatment, the cells were allowed to grow until the flasks of the control group (which is defined as the flasks not receiving any cisplatin or radiation) are about 90% confluent (which took roughly 6 days). Figure 5 shows an example of how the T25 flasks appear several days post-treatment showing color gradients from the increased acidity of the control flasks (the cells of the control were allowed to overgrow to better highlight the color change in the photograph). The acidity arises from the increasing population of proliferated cells in the control.
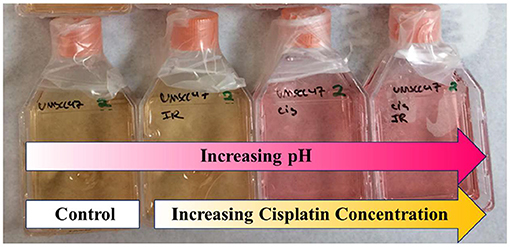
Figure 5. An example of the cell culture, showing how the spectrum of phenol red (PR) changes with acidity (the control, in this case, was allowed to become very acidic (yellowish) to better highlight spectral changes), with cisplatin concentrations (from left to right): 0 (control), 0.2, 1.0, and 3.0 μM.
After the control sets reach 90% confluency, all of the cells in the flasks are subsequently measured using the CMSI probe. The cell proliferation affects the pH of the cell media, the larger the population of cells, the more acidic (hence lower pH) with CMSI measuring the pH of the cell media itself. The T25 flask is placed upright, allowing the cell media to pool at the bottom, and the CMSI probe is placed at the center of cell media. The flask is irradiated with 3 × 3 cm2 6 MV x-ray field (Varian Truebeam) with the center of the probe aligned with the linac gantry isocenter [100 cm source-axis-distance (SAD)], as shown in Figure 6. The pH value is derived from the pH calibration curve in Figure 4. The cell populations were counted (using a Bio-Rad TC10 cell counter) immediately after the CMSI measurements.
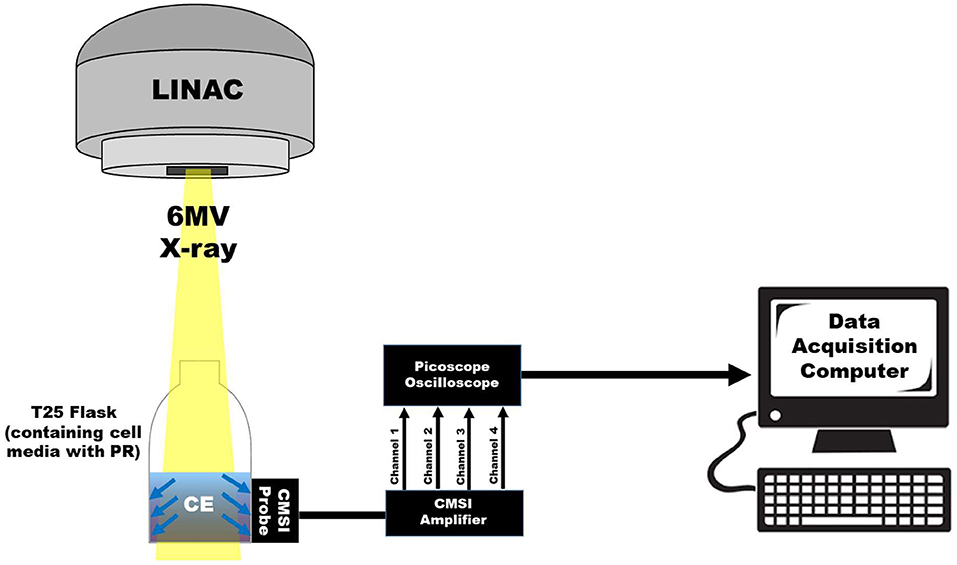
Figure 6. A schematic showing the CMSI probe placement on the T25 flask with respect to the 6 MV x-ray field.
As a proof-of-principle to demonstrate the applicability of CMSI for in vivo studies, a pilot mouse study consisting of two mice (male, nu/nu, Charles Rivers Laboratories) was conducted. One mouse was implanted, subcutaneously, on the flank, with the UMSCC47 cell line and the other mouse had an artificial “benign” tumor which consisted of an injection of Matrigel (also contains PR), which is buffered at the physiologically neutral pH value of 7.4 and solidifies temporarily at the mouse body temperature. Prior to irradiation, the anesthesia was induced (in an induction chamber) and maintained (using a nose cone) using isoflurane gas with oxygen (with a dose of 5% and 1–2%, respectively) and the mice were kept warm using a microwavable heating pad. Under anesthesia, the tumor bearing mouse was injected with an aqueous solution of phenol red (1 mg/mL) directly into the tumor site. The CMSI probe is placed directly on top of the tumor (as shown in Figure 7A) and the 9 MV field was administered from the side using a Linatron M9 (Varex Imaging) research accelerator with custom lead collimators, giving a 1 × 1 cm2 field at the surface of the mouse. Figure 7B shows the beam path via a CE image from a 30 s exposure using a CCD camera (640 ws, Quantum Scientific Instruments) with the probe position highlighted by the green dashed line.
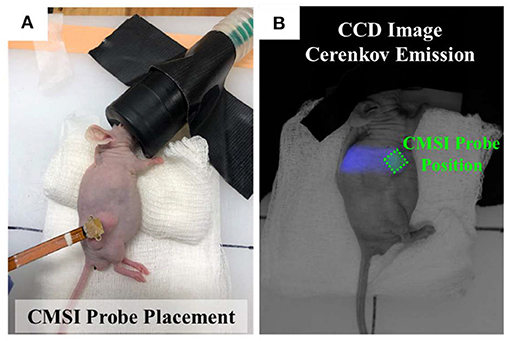
Figure 7. (A) Photograph of an anesthetized mouse showing the CMSI probe placed over the UMSCC47 tumor site. (B) CCD image of CE of the mouse implanted with the artificial benign tumor, the location of the CMSI probe placement is outlined using the green dashed line.
In order to estimate the tumor pH from the CMSI ratio, the original pH calibration curve (Figure 4) was modified to take into account the wavelength dependent attenuation changes due to the skin of the mouse. This was done by using the benign tumor (buffered at a pH of 7.4) as a reference. To recall, the CMSI ratio is the ratio of the SiPM signal value of the 445 and 560 nm absorption lines. Since the pH of the benign tumor is known (7.4), a multiplicative factor between the CMSI ratio from the mouse and the CMSI calibration point (at pH of 7.4) is found and is applied to recalibrate the remaining CMSI calibration points. A linear regression (R2 = 0.9599) is found for this new calibration set and is used to estimate the UMSCC47 tumor pH (as shown in Figure 8).
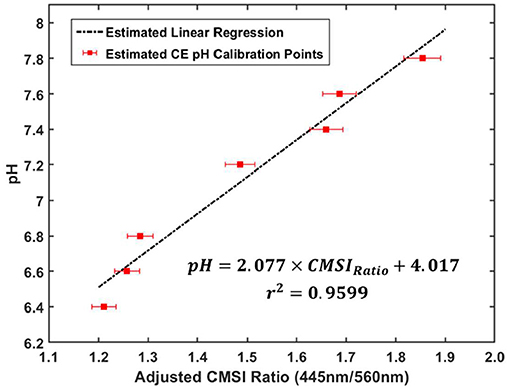
Figure 8. Recalibrated pH data using the multiplicative factor determined from the benign artificial tumor in the mouse with the corresponding linear regression equation and r2-value for the adjusted calibration data (the error bars correspond to about 2% error in the CMSI ratio measurement, which is estimated from the standard deviation of the ratio during measurement).
Figure 9 shows the CMSI measured change in pH overlayed (red line) with the relative cell population, denoted here as “cell survival” (blue line). Both the change in pH and the cell survival are normalized to the values of the completely untreated control set. Solid lines (for both pH and cell survival) are the sets not treated with radiation while the sets shown with the dashed lines received 2 Gy of radiation in addition to cisplatin. The error bars are the standard deviation of the measurements.
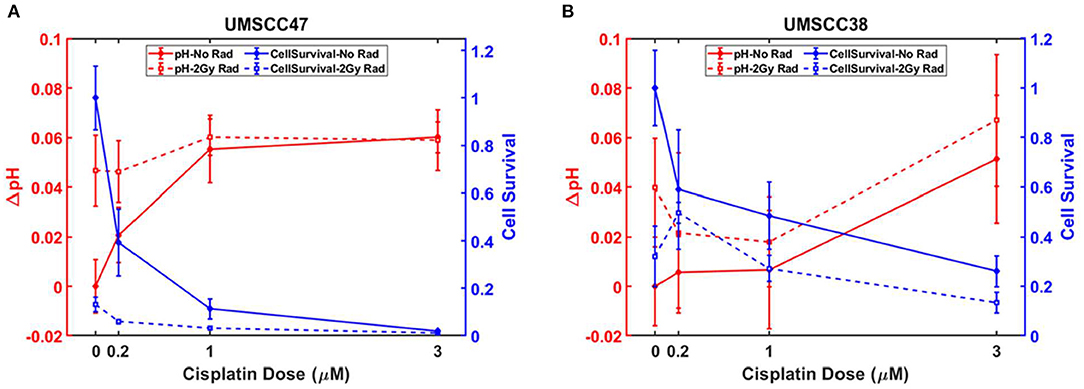
Figure 9. (A) pH changes with corresponding cell survival for each treatment case for (A) UMSCC47 and (B) UMSCC38 (the graph data are available in Supplementary Tables 1, 2, in Supplementary Material).
Figure 9A presents the results for the UMSCC47 cell lines, which are the HPV positive tumors. With increasing cisplatin concentration, there is a drop off in population (shown by the solid blue lines) which is even more pronounced for the cisplatin treated set that also received radiation (dashed blue lines). The relative pH increases (denoted by the red lines) as the population decreases, which corresponds to a decrease in acidity. Figure 9B shows the analogous measurements with the UMSCC38 cell lines, which are HPV negative. For all the treatments, the HPV negative cell line (UMSCC38) had a higher relative cell survival when compared to the HPV positive (UMSCC47) cells. For example, when the treatment consisted of 1 μM of cisplatin and 2 Gy of radiation, the HPV negative cells had a relative cell population fraction of 0.27 (±0.05) vs. the smaller relative population fraction of 0.0032 (±0.005) of the HPV positive cells. This difference in treatment response is also reflected with the change in pH (ΔpH, with respect to the control) as ΔpH = 0.018 (±0.02) and ΔpH = 0.060 (±0.007) for the HPV negative and positive cell lines, respectively. Note that the larger ΔpH means the cell media are less acidic when compared with the control flasks. Detailed graph data are provided as tables in the Supplementary Material.
Figure 10 shows photos of the two mice with the corresponding CMSI waveforms collected below. The CMSI ratio for the UMSCC47 tumor (circled with the red dashed line) is 1.15. Using the estimated pH calibration from Figure 7, this corresponds to a pH value of 6.4, which is more acidic than physiological neutral (7.4). The CMSI ratio for the Matrigel artificial “benign” tumor (circled with the black line) is 1.66, with the pH value already known (Matrigel is buffered at a pH 7.4).
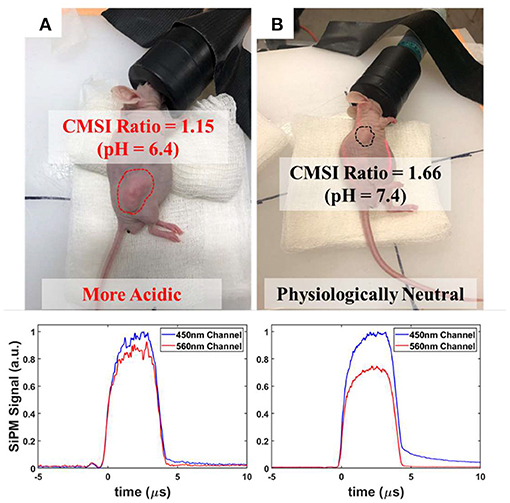
Figure 10. Photographs of the implanted nude mice with the corresponding CMSI multispectral waveforms below: (A) UMSCC47 tumor (circled using a red dashed line) with the CMSI ratio of 1.15 and an estimated pH of 6.4 (B) Matrigel-based artificial tumor (circled using a black dashed line) with a CMSI ratio of 1.66 and a known pH of 7.4.
The focus of this work is to demonstrate the use of a CMSI optical probe for novel multispectral CE measurements of pH changes. By using the calibration curve in Figure 4, we were able to quantitatively measure the pH changes of the cell media during in vitro measurements. The changes in pH track the inverse of the cell population. This is to be expected as the larger the cell population, the greater the metabolic activity, causing the cell media to become more acidic, eventually breaking the buffer (exceeding the buffer capacity) of the cell media and changing its color. The control would have the lowest pH (most acidic) due to the largest relative population with the next smaller populations having larger pH values (the upper limit is the buffered pH value of the cell media, which is 7.4). When comparing the UMSCC47 (HPV+) and UMSCC38 (HPV-), the cell population of the HPV- cell lines does not drop off as sharply as the HPV+ cell lines; this indicates that the HPV- cell lines are more resistant to treatment, in agreement with previous clonogenic survival studies [35]. This difference in response is found to track quantitatively with the CMSI-measured pH values, demonstrating that the CMSI probe can be used to interrogate treatment response. It is worth noting that even though the pH calibration was done using borosilicate glass bottles while the T25 flasks used in the cell cultures are made of polystyrene, we have not observed any changes in the calibration curve since both borosilicate and polystyrene are transparent in the spectral range of interest in this work, thus any spectral features originating from the irradiated volume (i.e., the pH buffers and cell media) are preserved. Additionally, the glass and polystyrene have a similar index of refraction (1.47 vs. 1.55), thus their CE spectra will be similar. Furthermore, the volume that is being directly irradiated is larger than the irradiated volume of the container material itself, thus mitigating any spectral contributions from the CE of the container.
The pilot mouse study shows the feasibility of using the CMSI probe to measure the pH in vivo if an adjustment to the pH calibration is made, to take into account the changes in the CE spectra as the light goes through the mouse skin. Since optical attenuation is not constant across the visible spectrum (the attenuation is not the same between the 445 and 560 nm as the light propagates through tissue), the ratiometric relationship with the simple pH calibration (Figure 4) must be modified to take that into account. For this pilot study, we used the pH value from the “benign” Matrigel tumor (which is fixed with a pH of 7.4) to recalibrate the pH calibration (Figure 8), taking optical attenuation into account. The assumptions here are that the skin thickness and attenuation characteristics (both absorption and scattering) are constant between the two mice. When measuring pH in deep seated tissues, this ratiometric approach must take such optical property depth dependence into account. A limitation of this pilot mouse study is that there was no secondary method with which to compare the CMSI measured pH value in vivo. Future work will include a much larger mouse population and will use a secondary method to verify the pH measurement using fluorescence techniques. Additionally, more precise temperature control for the mice will be used to ensure the best uniformity of measurement conditions between each of the mice (e.g., the tumor metabolic activity in mice can reduce when the mice are colder). Furthermore, future work would also investigate how spectral features are affected when comparing hairless nude mice to hirsute mice that have undergone hair removal (i.e., shaving and depilatory use). It is also worth noting that even though all of the analysis in this work was done after data acquisition (offline), both acquisition and analysis in future work will be done online (in real time during EBRT).
The advantage of using the CMSI probe is demonstrated with the enhanced sensitivity compared to existing methods. Cerenkov emission through a turbid and absorbing medium, such as biological tissue, can become very faint, especially as it traverses through heterogenous tissue. When taking multispectral measurements, there will be a small portion of an already weak signal (in the order of a handful of CE optical photons left) that needs to be measured quantitatively. The use of the CMSI probe gives a path to allow multispectral CE measurements that may originate in deep tissues compared to other methods, allowing for routine biologically oriented measurements during radiotherapy, which can provide much needed insight into the tumor microenvironment at each fraction of RT delivery.
This work introduces a novel and highly sensitive SiPM-based optical probe, named CMSI, for multispectral measurements of CE during radiotherapy to routinely interrogate the tumor microenvironment. CMSI successfully measured cell proliferation, in vitro, by measuring spectral changes in CE in cell media that arise from pH changes. The feasibility for using CMSI in vivo was also successfully demonstrated by measuring tumor pH during a pilot mouse study.
The raw data supporting the conclusions of this article will be made available by the authors, without undue reservation.
The animal study was reviewed and approved by the University of Michigan Institutional Animal Care and Use Committee (IACUC).
IE, AR, and IO conceived the presented idea. IO designed and conducted the experiments as well as analyzed the data. AR provided support and expertise for the cell cultures, which were maintained by AC and EA-S, and AC assisted IO in carrying out the experiments. RC assisted in the CMSI probe design and provided general optics expertise. All authors contributed to the article and approved the submitted version.
This work was funded partially by Endectra, LLC (NSF SBIR Phase II #1632467). They aided in the CMSI probe development as well as supplied the CMSI probe and corresponding acquisition electronics used in this work. This work was also funded by NIH R37CA222215, NIH STTR award R41CA243722, and University of Michigan internal funds.
RC is employed by Endectra, LLC.
The remaining authors declare that the research was conducted in the absence of any commercial or financial relationships that could be constructed as a potential conflict of interest.
We would like to thank the team at Endectra, LLC for developing and providing the CMSI optical probe as well as the Thomas Carey lab at the University of Michigan for providing the HNSCC cell lines used in this work.
The Supplementary Material for this article can be found online at: https://www.frontiersin.org/articles/10.3389/fphy.2021.636001/full#supplementary-material
Supplementary Figure 1. Transmission data for the 445 nm (Semrock FF01-445/14, denoted by the blue line) and 560 nm (Semrock FF01-560/14, denoted by the green line) optical bandpass filters.
Supplementary Table 1. Graph data for the UMSCC47 cell line.
Supplementary Table 2. Graph data for the UMSCC38 cell line.
1. Henley SJ, Ward EM, Scott S, Sherman RL, Noone AM, Howlader N, et al. Annual report to the nation on the status of cancer, part I: national cancer statistics. Cancer. (2020) 126:2225–49. doi: 10.1002/cncr.32802
2. An Update on Cancer Deaths in the United States|CDC. Available online at: https://www.cdc.gov/cancer/dcpc/research/update-on-cancer-deaths/index.htm (accessed November 29, 2020).
3. Lau A, Vander Heiden M. Metabolism in the tumor microenvironment. Adv Exp Med Biol. (2020) 1272:55–72. doi: 10.1007/978-3-030-48457-6_4
4. Boedtkjer E, Pedersen SF. The acidic tumor microenvironment as a driver of cancer. Annu Rev Physiol. (2020) 82:103–26. doi: 10.1146/annurev-physiol-021119-034627
5. Parks SK, Mueller-Klieser W, Pouysségur J. Lactate and acidity in the cancer microenvironment. Annu Rev Cancer Biol. (2020) 4:141–58. doi: 10.1146/annurev-cancerbio-030419-033556
6. Warburg O. The metabolism of carcinoma cells 1. J Cancer Res. (1925) 9:148–63. doi: 10.1158/jcr.1925.148
7. Mazzio EA, Smith B, Soliman KFA. Evaluation of endogenous acidic metabolic products associated with carbohydrate metabolism in tumor cells. Cell Biol Toxicol. (2010) 26:177–88. doi: 10.1007/s10565-009-9138-6
8. Hashim AI, Zhang X, Wojtkowiak JW, Martinez GV, Gillies RJ. Imaging pH and metastasis. NMR Biomed. (2011) 24:582–91. doi: 10.1002/nbm.1644
9. Robertson-Tessi M, Gillies RJ, Gatenby RA, Anderson ARA. Impact of metabolic heterogeneity on tumor growth, invasion, and treatment outcomes. Cancer Res. (2015) 75:1567–79. doi: 10.1158/0008-5472.CAN-14-1428
10. Damaghi M, Gillies R. Phenotypic changes of acid-adapted cancer cells push them toward aggressiveness in their evolution in the tumor microenvironment. Cell Cycle. (2017) 16:1739–43. doi: 10.1080/15384101.2016.1231284
11. Bentzen SM, Gregoire V. Molecular imaging-based dose painting: a novel paradigm for radiation therapy prescription. Semin Radiat Oncol. (2011) 21:101–10. doi: 10.1016/j.semradonc.2010.10.001
12. Cherenkov PA. Radiation from high-speed particles. Science. (1960) 131:136–42. doi: 10.1126/science.131.3394.136
13. Glaser AK, Zhang R, Gladstone DJ, Pogue BW. Optical dosimetry of radiotherapy beams using Cherenkov radiation: The relationship between light emission and dose. Phys Med Biol. (2014) 59:3789–811. doi: 10.1088/0031-9155/59/14/3789
14. Zlateva Y, Muir BR, El Naqa I, Seuntjens JP. Cherenkov emission-based external radiotherapy dosimetry: I. Formalism and feasibility. Med Phys. (2019) 46:2370–82. doi: 10.1002/mp.13414
15. Zlateva Y, Muir BR, Seuntjens JP, El Naqa I. Cherenkov emission-based external radiotherapy dosimetry: II. Electron beam quality specification and uncertainties. Med Phys. (2019) 46:2383–93. doi: 10.1002/mp.13413
16. Zhang R, Andreozzi JM, Gladstone DJ, Hitchcock WL, Glaser AK, Jiang S, et al. Cherenkoscopy based patient positioning validation and movement tracking during post-lumpectomy whole breast radiation therapy. Phys Med Biol. (2014) 60:L1–14. doi: 10.1088/0031-9155/60/1/L1
17. Andreozzi JM, Zhang R, Gladstone DJ, Williams BB, Glaser AK, Pogue BW, et al. Cherenkov imaging method for rapid optimization of clinical treatment geometry in total skin electron beam therapy. Med Phys. (2016) 43:993–1002. doi: 10.1118/1.4939880
18. Hachadorian RL, Bruza P, Jermyn M, Gladstone DJ, Pogue BW, Jarvis LA. Imaging radiation dose in breast radiotherapy by X-ray CT calibration of Cherenkov light. Nat Commun. (2020) 11:1–9. doi: 10.1038/s41467-020-16031-z
19. Jarvis LA, Zhang R, Gladstone DJ, Jiang S, Hitchcock W, Friedman OD, et al. Cherenkov video imaging allows for the first visualization of radiation therapy in real time. Int J Radiat Oncol Biol Phys. (2014) 89:615–22. doi: 10.1016/j.ijrobp.2014.01.046
20. Xie Y, Petroccia H, Maity A, Miao T, Zhu Y, Bruza P, et al. Cherenkov imaging for total skin electron therapy (TSET). Med Phys. (2019) 47:201–12. doi: 10.1002/mp.13881
21. Pogue BW, Zhang R, Glaser A, Anderozzi JM, Bruza P, Gladstone DJ, et al. Cherenkov imaging in the potential roles of radiotherapy QA and delivery. J Phys Conf Ser. (2017) 847:012046. doi: 10.1088/1742-6596/847/1/012046
22. Glaser AK, Andreozzi JM, Davis SC, Zhang R, Pogue BW, Fox CJ, et al. Video-rate optical dosimetry and dynamic visualization of IMRT and VMAT treatment plans in water using Cherenkov radiation. Med Phys. (2014) 41:062102. doi: 10.1118/1.4875704
23. Helo Y, Rosenberg I, D'Souza D, Macdonald L, Speller R, Royle G, et al. Imaging Cerenkov emission as a quality assurance tool in electron radiotherapy. Phys Med Biol. (2014) 59:1963–78. doi: 10.1088/0031-9155/59/8/1963
24. Glaser AK, Zhang R, Davis SC, Gladstone DJ, Pogue BW. Time-gated Cherenkov emission spectroscopy from linear accelerator irradiation of tissue phantoms. Opt Lett. (2012) 37:1193. doi: 10.1364/ol.37.001193
25. Glaser A, Axelsson J, Zhang R, Gladstone DJ, Pogue BW. Cherenkov emission spectroscopy for tissue oxygen saturation assessment. In: Biomedical Optics, BIOMED 2012. Miami, FL: Biomedical Optics (2012). doi: 10.1364/BIOMED.2012.JM3A.15
26. Axelsson J, Glaser AK, Gladstone DJ, Pogue BW. Quantitative Cherenkov emission spectroscopy for tissue oxygenation assessment. Opt Express. (2012) 20:5133. doi: 10.1364/oe.20.005133
27. Shell JR, LaRochelle EP, Bruza P, Gunn JR, Jarvis LA, Gladstone DJ. Comparison of phosphorescent agents for noninvasive sensing of tumor oxygenation via Cherenkov-excited luminescence imaging. J Biomed Opt. (2019) 24:1. doi: 10.1117/1.jbo.24.3.036001
28. Cao X, Rao Allu S, Jiang S, Jia M, Gunn JR, Yao C, et al. Tissue pO2 distributions in xenograft tumors dynamically imaged by Cherenkov-excited phosphorescence during fractionated radiation therapy. Nat Commun. (2020) 11:1–9. doi: 10.1038/s41467-020-14415-9
29. Pogue BW, Feng J, Larochelle EP, Bruza P, Lin H, Zhang R, et al. Maps of in vivo oxygen pressure with submillimetre resolution and nanomolar sensitivity enabled by cherenkov-excited luminescence scanned imaging. Nat Biomed Eng. (2018) 2:254–64. doi: 10.1038/s41551-018-0220-3
30. Czupryna J, Kachur AV, Blankemeyer E, Popov AV, Arroyo AD, Karp JS, et al. Cerenkov-specific contrast agents for detection of pH in vivo. J Nucl Med. (2015) 56:483–8. doi: 10.2967/jnumed.114.146605
31. Liu M, Zheng S, Zhang X, Guo H, Shi X, Kang X, et al. Cerenkov luminescence imaging on evaluation of early response to chemotherapy of drug-resistant gastric cancer. Nanomed Nanotechnol Biol Med. (2018) 14:205–13. doi: 10.1016/j.nano.2017.10.001
32. Hu Z, Chi C, Liu M, Guo H, Zhang Z, Zeng C, et al. Nanoparticle-mediated radiopharmaceutical-excited fluorescence molecular imaging allows precise image-guided tumor-removal surgery. Nanomed Nanotechnol Biol Med. (2017) 13:1323–31. doi: 10.1016/j.nano.2017.01.005
33. Oraiqat I, DeBruin S, Pearce R, Como C, Mikell J, Taylor C, et al. Silicon photomultipliers for deep tissue cerenkov emission detection during external beam radiotherapy. IEEE Photonics J. (2019) 11:1–16. doi: 10.1109/jphot.2019.2931845
34. Gault MH, Koch B, Dossetor JB. Phenolsulfonphthalein (PSP) in Assessment of Renal Function. JAMA J Am Med Assoc. (1967) 200:871–3. doi: 10.1001/jama.1967.03120230123018
35. Ziemann F, Arenz A, Preising S, Wittekindt C, Klussmann JP, Engenhart-Cabillic R, et al. Increased sensitivity of HPV-positive head and neck cancer cell lines to x-irradiation ± Cisplatin due to decreased expression of E6 and E7 oncoproteins and enhanced apoptosis. Am J Cancer Res. (2015)5:1017–31. doi: 10.1007/s00066-014-0605-5
Keywords: Cerenkov Emission, radiotherapy, spectroscopy, molecular imaging, silicon photomultipliers, tumor microenvironment, Warburg effect, low light detection
Citation: Oraiqat I, Al-Snayyan E, Calcaterra A, Clarke R, Rehemtulla A and El Naqa I (2021) Measuring Tumor Microenvironment pH During Radiotherapy Using a Novel Cerenkov Emission Multispectral Optical Probe Based on Silicon Photomultipliers. Front. Phys. 9:636001. doi: 10.3389/fphy.2021.636001
Received: 30 November 2020; Accepted: 02 March 2021;
Published: 09 April 2021.
Edited by:
Brian William Pogue, Dartmouth College, United StatesReviewed by:
David B. Stout, Independent Researcher, Culver City, CA, United StatesCopyright © 2021 Oraiqat, Al-Snayyan, Calcaterra, Clarke, Rehemtulla and El Naqa. This is an open-access article distributed under the terms of the Creative Commons Attribution License (CC BY). The use, distribution or reproduction in other forums is permitted, provided the original author(s) and the copyright owner(s) are credited and that the original publication in this journal is cited, in accordance with accepted academic practice. No use, distribution or reproduction is permitted which does not comply with these terms.
*Correspondence: Ibrahim Oraiqat, aWJyYWhpbS5vcmFpcWF0QG1vZmZpdHQub3Jn
Disclaimer: All claims expressed in this article are solely those of the authors and do not necessarily represent those of their affiliated organizations, or those of the publisher, the editors and the reviewers. Any product that may be evaluated in this article or claim that may be made by its manufacturer is not guaranteed or endorsed by the publisher.
Research integrity at Frontiers
Learn more about the work of our research integrity team to safeguard the quality of each article we publish.