- 1Department of Engineering Physics, Tsinghua University, Beijing, China
- 2Key Laboratory of Particle & Radiation Imaging, Ministry of Education, Beijing, China
In this paper, we propose a novel static CT system: triple planes CT (TPCT) system. Three source-detector planes in different horizontal directions are placed in the system. Line-array carbon nanotube sources with different voltages and sandwich detectors are used. Compared to conventional cone-beam CT and common inverse-geometry CT, the TPCT enables fast scanning and six-energy imaging. 1-D U-Net is applied to correct the severe scatter caused by the special geometry. The limited-view problem is solved by the hybrid reconstruction algorithm. A Monte-Carlo simulation is performed on a thorax phantom. Both the reconstruction results and decomposition results have good image quality and show the feasibility of our proposed TPCT imaging system.
Introduction
In recent years, technological advances in sources, detectors, electronics, and mechanics have driven the development of CT imaging [1, 2]. Improved spatial and temporal resolution, reduced patient dose, and artifacts, as well as multi-energy imaging, are being achieved [3]. Most of the progress is based on the third-generation CT. In the system, the entire FOV is covered by the fan-shaped X-ray beam. Hence, the translation of the sources is not needed [4]. The scan duration is reduced to a few seconds, which eliminates the motion artifacts to a great extent. However, the single-rotation cardiac imaging requires at least 50 ms temporal resolution to avoid the artifacts introduced by heartbeat [5]. Current clinical gantry-based CT scanners have a rotation time of about 300 ms. The rotation time limit of the current CT system is about 200 ms due to mechanical structure limitation [5].
Electron beam computed tomography (EBCT) was first proposed for cardiac imaging in 1983 [6]. The EBCT system's temporal resolution can reach 50 ms, but the system is obsolete because of its high cost and poor signal-to-noise ratio (SNR) of the reconstruction images. Inverse-geometry computed tomography, or IGCT, is first proposed in 2004 [7]. Different from the conventional CT in which x-rays emit from a small source spot toward large detector arrays, the IGCT consists of multiple X-ray sources distributed in a large area and a smaller detector [8]. The IGCT system increases the sampling rate and reduces the cone-beam artifacts. A variety of related geometries has been published in the past decade. A team from GE Global Research proposed a multi-source IGCT in 2007 [9–11] and updated the system designs, hardware, and reconstruction algorithms in the following years [12–16]. The inverse-geometry dedicated breast CT system, which consists of a large-area x-ray source and a narrower photon-counting detector, was investigated in 2009 [17]. Its scatter performance was evaluated, too [18]. Cao et al. proposed a new CT architecture with three stationary sources and three rotating detectors for cardiac imaging [19]. An IGCT system with multiple stationary source arrays and one rotating detector is designed by Hsieh et al. [20], and the corresponding reconstruction algorithm and results are presented [21, 22]. However, most of the previously published IGCT systems are non-stationary or semi-stationary.
Carbon nanotubes (CNTs) based field emission sources have been applied to fixed gantry CT systems. Compared to conventional thermionic sources, CNT sources can operate at room temperature, be electronically controlled, and have instantaneous responses [23]. The first application of CNT multi-beam X-ray sources in a stationary CT system was a micro-CT system with square and hexagonal geometries [24]. A rectangular fixed-gantry system was proposed in 2014, specifically for airport checkpoint baggage screening [25]. Recently, Zhang et al. proposed the symmetric-geometry CT system and the corresponding direct filtered back projection and linogram reconstruction methods [26, 27]. Because of the complex CT structure and under-sampling problem, multi-energy imaging is difficult to achieve in the existing CNT sources CT systems.
In this paper, we propose a new stationary CT architecture: triple planes CT (TPCT). In the TPCT system, three source-detector planes in different horizontal directions are placed longitudinally to obtain projection data from different views. Three different voltages are set to three line-array carbon nanotube (CNT) sources. Line-array sandwich detectors are applied in the system. Scatter is estimated in the projection domain using 1D U-Net to correct the scatter artifacts. A hybrid reconstruction algorithm is proposed to enable six-energy imaging. The Monte Carlo simulation of the thorax phantom is performed. The reconstruction and decomposition results are in good quality, proving the feasibility of our proposed TPCT system.
This paper is organized as follows. In Section Methods, the CT system, including the CT design, the scatter correction and hybrid reconstruction algorithm, is detailed described. In Section Results, the reconstruction results and decomposition of the simulation are presented. Finally, the discussion and conclusion are given in Section Discussion And Conclusion.
Methods
CT Design
In the proposed TPCT system, three source-detector planes are implemented. Figure 1 shows the diagrams of the TPCT system.
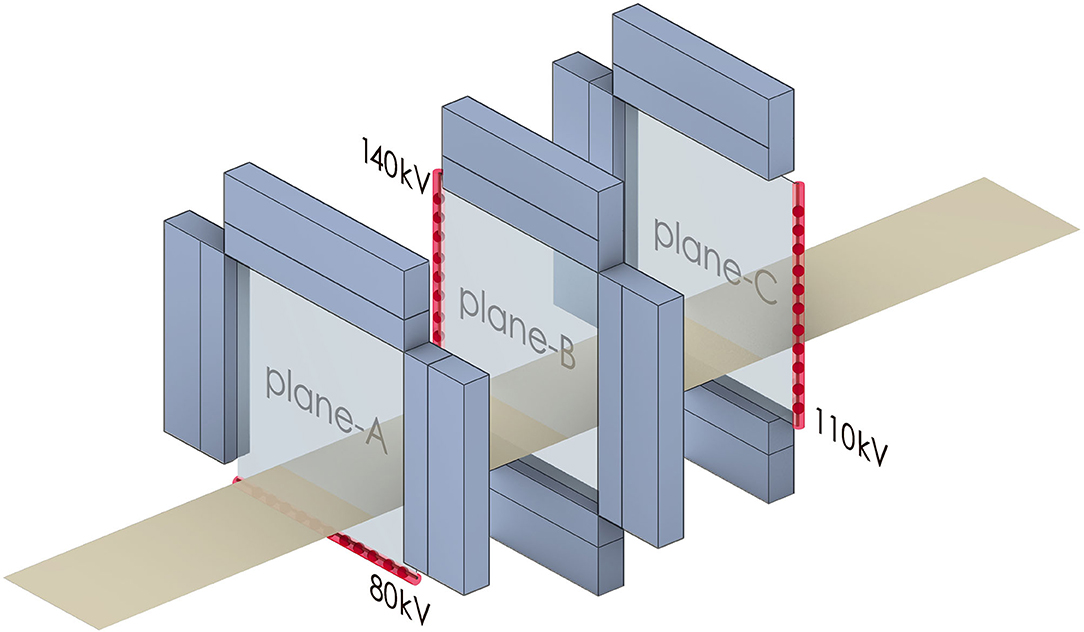
Figure 1. The diagram of the TPCT system. The blue blocks represent the sandwich detectors. The red lines and dots represent the carbon nanotubes and source spots. The yellow belt represents the table.
In each source-detector plane, one CNT multi-beam source with 128 spots and three line-array sandwich detectors are placed along the four sides of a rectangle. All spots are arranged in the array with equal spacing. An iron filter is placed in front of each source. The pre-collimators and the post-collimators in the axial direction are applied to shield the scattered photons in the axial direction. The total pixel number of the line array detectors is 1092. A sandwich GOS detector is applied in the system. A copper filter is placed between the two layers.
Three sources-detectors planes in different horizontal directions are placed longitudinally. The centers of all the planes coincide in the horizontal direction. Three different voltages, 140, 110, and 80 kV, are set to three multi-beam sources, respectively. When the TPCT is scanning, all the focal spots of one multi-beam source are scanned sequentially. The sources of different planes are scanned simultaneously. The emitted photons deposit in both layers of the detectors. Therefore, projection data of six energies are obtained without the movement of the sources and detectors.
Scatter Correction
1D U-Net Convolution Network for Scatter Correction
Because of the special geometry of the TPCT, the incident angle of partial X-rays can be extremely large, which generates more scatter photons. The scatter photons absorbed by the detector influence the detector's energy deposition, resulting in scatter artifacts.
Conventional scatter correction methods either use hardware such as primary modulation to avoid the influence of scattering [28, 29] or make use of software-based algorithms to predict and compensate the scatter artifacts [30, 31]. However, primary modulation is not applicable in the TPCT system because photons arriving at the same detector pixel come from different directions. Software-based correction methods are not feasible because it is difficult to construct an accurate physical model for complex geometry.
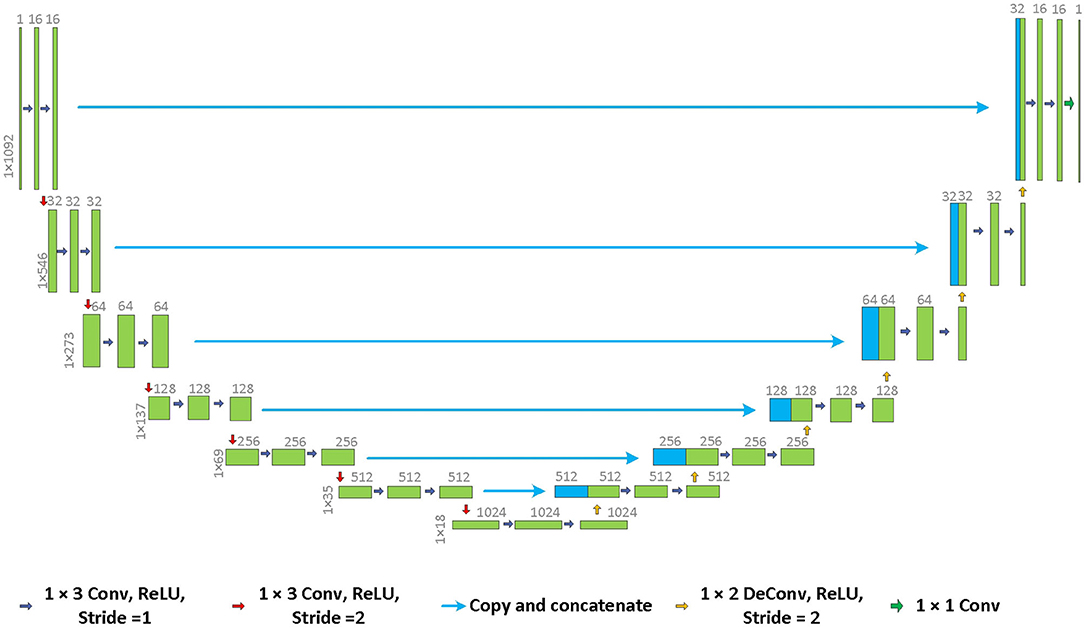
In the past several years, deep learning has become a powerful tool in CT imaging [32]. In the field of scatter correction, ScatterNet [33], DRCNN [34], and DSE [35] have been proposed. Inspired by the previous researchers and focusing on our problem, we propose the 1D U-Net convolution network for scatter correction in the projection domain. The architecture of the network is shown in Figure 2.
Common cone-beam CT scatter correction neural networks use 2D data as the inputs and outputs of the network. As for TPCT, the 1D data is used instead. The projection data of the TPCT is a 2D matrix. Each column of the matrix, a 1D vector, represents photons' projection emitted from one source spot toward all detector pixels. Because different source spots are scanned sequentially and do not emit the photons simultaneously, the influence caused by scattering only exists between different detector pixels of the same source spot. Therefore, the 1D neural network model is reasonable. Compared to 2D networks, using 1D data instead of 2D data dramatically reduces the computing time and increases training samples.
Balancing the calculation complexity and the network's generation ability, the depth of the network is set to 7. In each tier, there are two convolution layers and one down/up-sampling layer. The size of the convolution kernel is 1 × 3. Shortcuts are applied between the down-sampling tiers and the up-sampling tiers. ReLU is chosen as the activation function. Batch normalization is applied. The scattered projection data are the inputs of the network. The actual scatter of the projections, which are obtained by subtracting the scatter-free results from the scattered results, are the outputs of the network. A simplified thorax phantom is used for training, which is described in Section Design of the Scatter Correction Phantom in detail. One-eighth of the total projection data is used for training. Adam algorithm is used for backpropagation. The start learning rate is 0.01. Exponential decay is applied. Batch size is set to 4. The total training epoch is 300. The projections of different energies are trained, respectively.
Design of the Scatter Correction Phantom
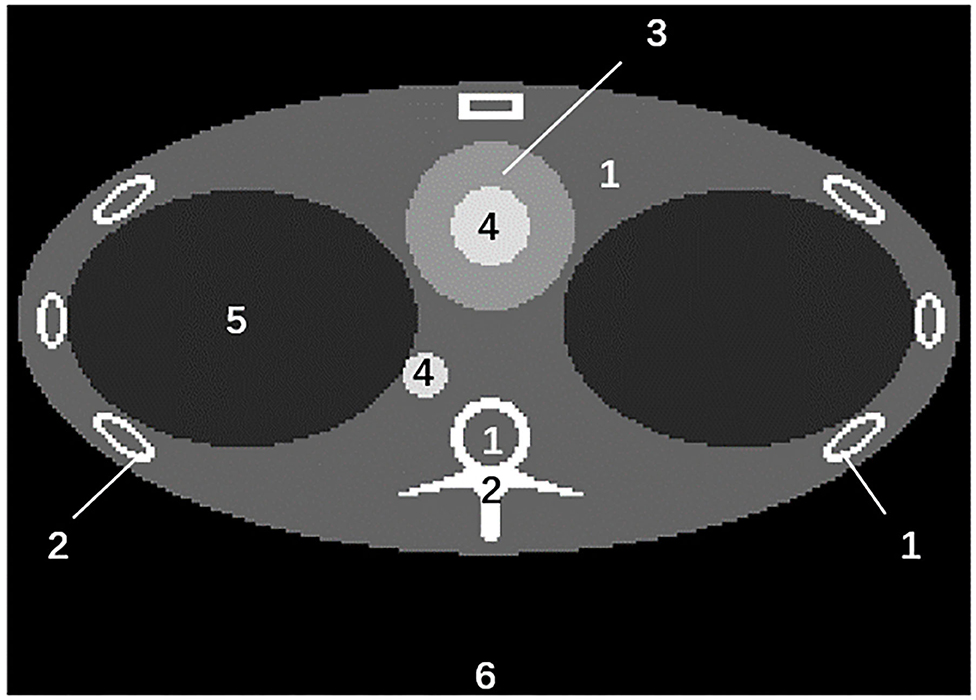
A simplified thorax phantom simulated by Monte Carlo simulation is used to train the 1D U-Net convolution network. The diagram of the phantom is shown in Figure 3. The phantom used for training has a similar contour and materials as the thorax phantom we used for evaluation described in Section Monte Carlo Simulation. However, the detailed shape and locations of the materials are different. Because the scatter photons are low-frequency signals and only 1D vectors but not the 2D projections are used as training data, the network has good generalization performance. It can be used for scattering correction of other human thorax phantoms.
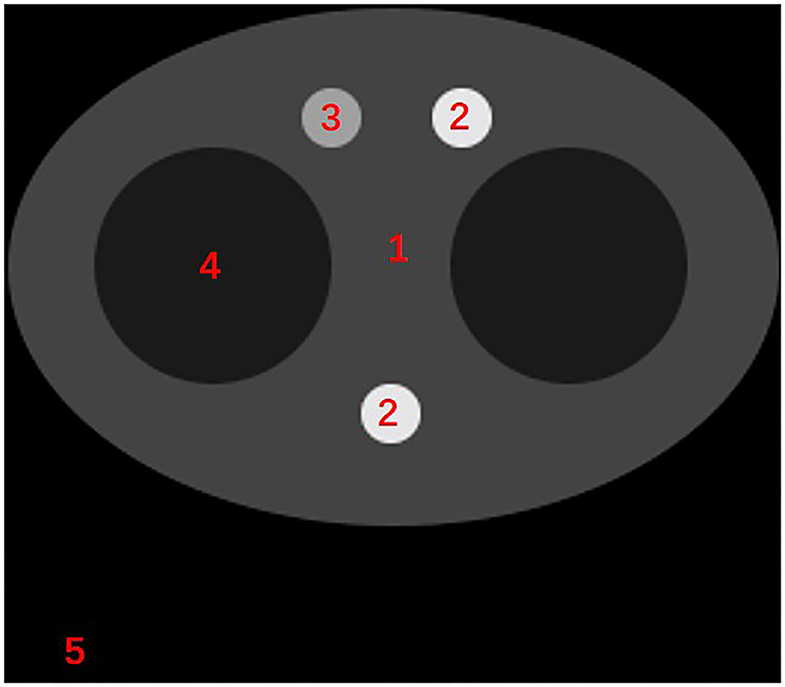
Figure 3. The diagram of the scatter-correction phantom. The materials represented by numbers 1–5 are: adipose tissue, bone, blood and iodine, lung tissue, air.
Multi-Energy Reconstruction
Hybrid Reconstruction for Six-Energy Imaging
Multi-energy CT imaging is enabled by the implementation of photon-counting detectors [36, 37]. However, limited by the small FOV and unaffordable cost, photon-counting detectors are not in clinic application [38]. Double sources and sandwich detector techniques have been developed for double energy CT imaging. In recent years, Yu et al. proposed a “TwinBeam” configuration for triple-energy or quadruple-energy imaging [39].
In the TPCT system, three different voltages are set to the multi-beam sources in three different planes (planes A, B, & C). The plane-A projections are scanned in 80 kV, the plane-B projections are scanned in 140 kV, and the plane-C projections are scanned in 110 kV. By applying the sandwich detector, the projections from six different spectra are obtained. However, reconstructing the multi-energy images causes severe artifacts because it is a typical limited-angle reconstruction problem. Compressed sensing (CS) has been applied to limited-angle CT reconstruction in the past decade [40–43]. In the TPCT system, the projections from all three planes compose the full-view data. Therefore, for six-energy imaging, two-thirds of projection data are missed, which is too difficult for the CS-based algorithms to solve.
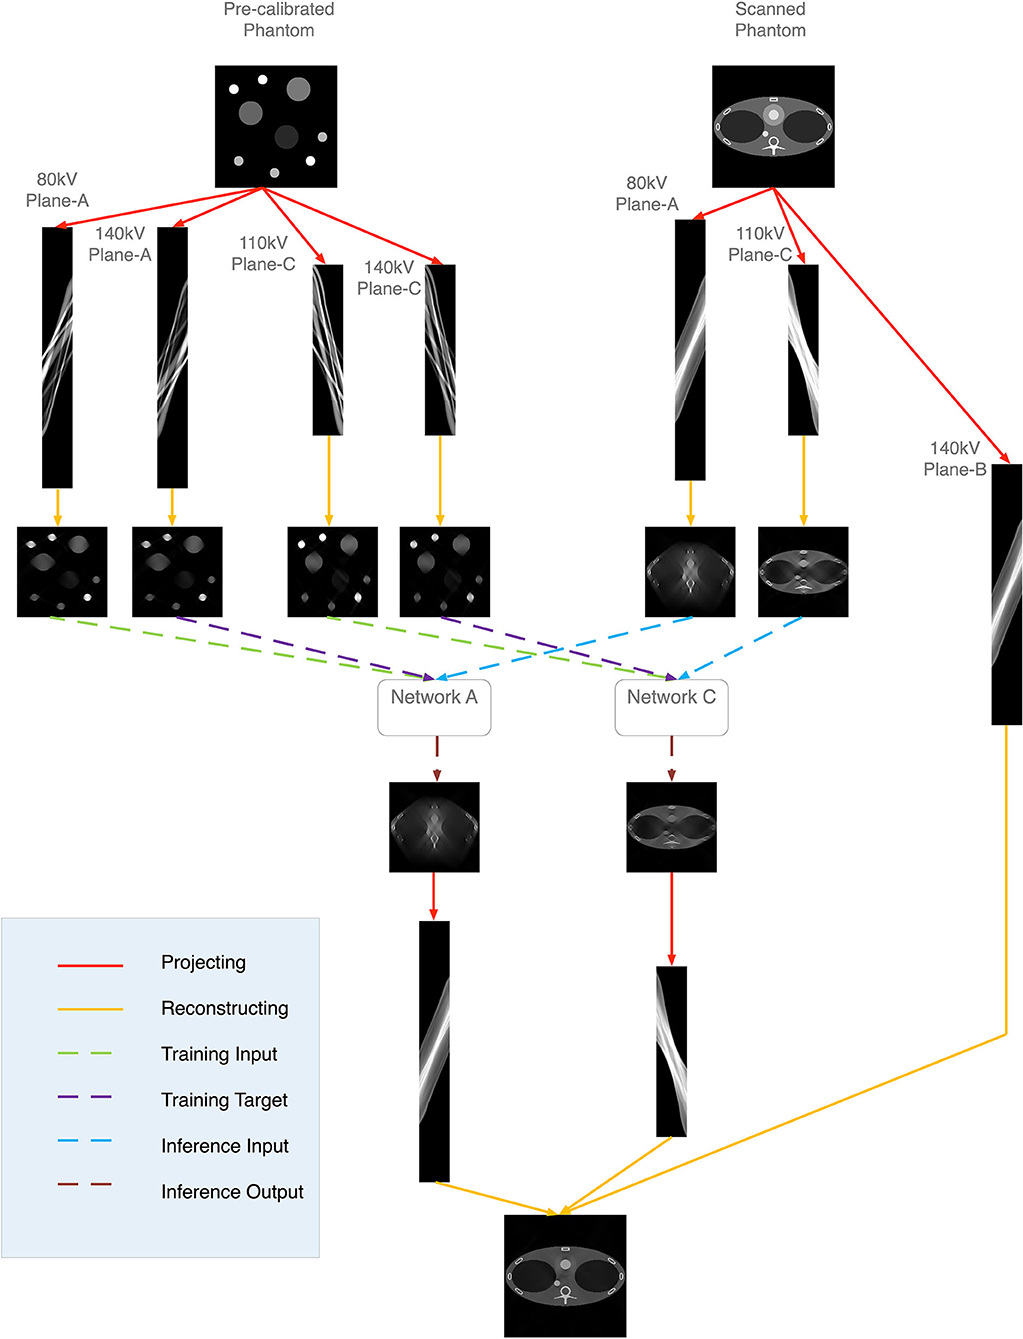
Recently, Zhang et al. [44] proposed the MLCE algorithm for limited-angle dual-energy CT reconstruction. Inspired by his work, we propose the hybrid reconstruction algorithm for the six-energy TPCT imaging. The 140 kV low-energy reconstruction process is presented as an example. The flowchart is shown in Figure 4. The plane-A and plane-C projections of 140 kV low energy are missed. A pre-calibrated phantom, which contains the common body materials, is pre-scanned. Plane-A projections of 140 kV low-energy, prj′A,140,low, and 80 kV low-energy, prj′A,80,low, are obtained. Plane-C projections prj′C,140,low and prj′C,110,low are also obtained. Images μ′A,140,low, μ′A,80,low, μ′C,140,low, μ′C,110,low are reconstructed from the corresponding projections respectively:
The Hlow represents the system matrix corresponding to the low-energy detectors. After the reconstruction, two neural networks are trained using the reconstruction images:
φ represent the two networks.
Images of the thorax phantom are reconstructed using the Plane-A and Plane-C projections:
Reconstruction images μ′A,80,low and μ′C,110,low are used as the input data of the network to predict the 140 kV images:
The predicting images are then projected for the final reconstruction:
The detailed structure and training configuration of the networks are described in Section Design of the Fully-Connected Neural Network.
Design of the Fully-Connected Neural Network
The diagram of the network is shown in Figure 5. A three-hidden-layer fully-connected neural network is applied to map the pixels from one energy to the other energy. To enhance the network's stability, a 3 × 3 image patch around the mapping pixel is used as the input data. The output is a pixel. Therefore, the input layer dimension is 9, and that of the output layer is 1. The dimensions for all three hidden layers are 10. The activation function is ReLU. Batch size is set to 32. MSE loss function and Adam optimization algorithm are used. The start learning rate is 0.05, and the exponential decay is applied. All the pixels of the pre-calibrated phantom images are used for training. For each tube voltage, the projections of the two planes are missed. There are two energies (low energy and high energy obtained by the sandwich detector) and three different tube voltages (80, 110, and 140 kV). Hence, 12 networks with the same network configurations need to be trained.
Design of Pre-calibrated Phantom
In the fully connected neural network training, we use the reconstruction results of a pre-calibrated phantom. The diagram of the phantom is shown in Figure 6. Different body materials, including adipose tissue, muscle, bone, blood, and iodine, are set in this phantom. This pre-calibrated phantom is simulated using analytical simulation with MATLAB software. The X-ray spectra used in the analytical simulation are the same as those used in the Monte Carlo simulation, presented in Section Monte Carlo Simulation.
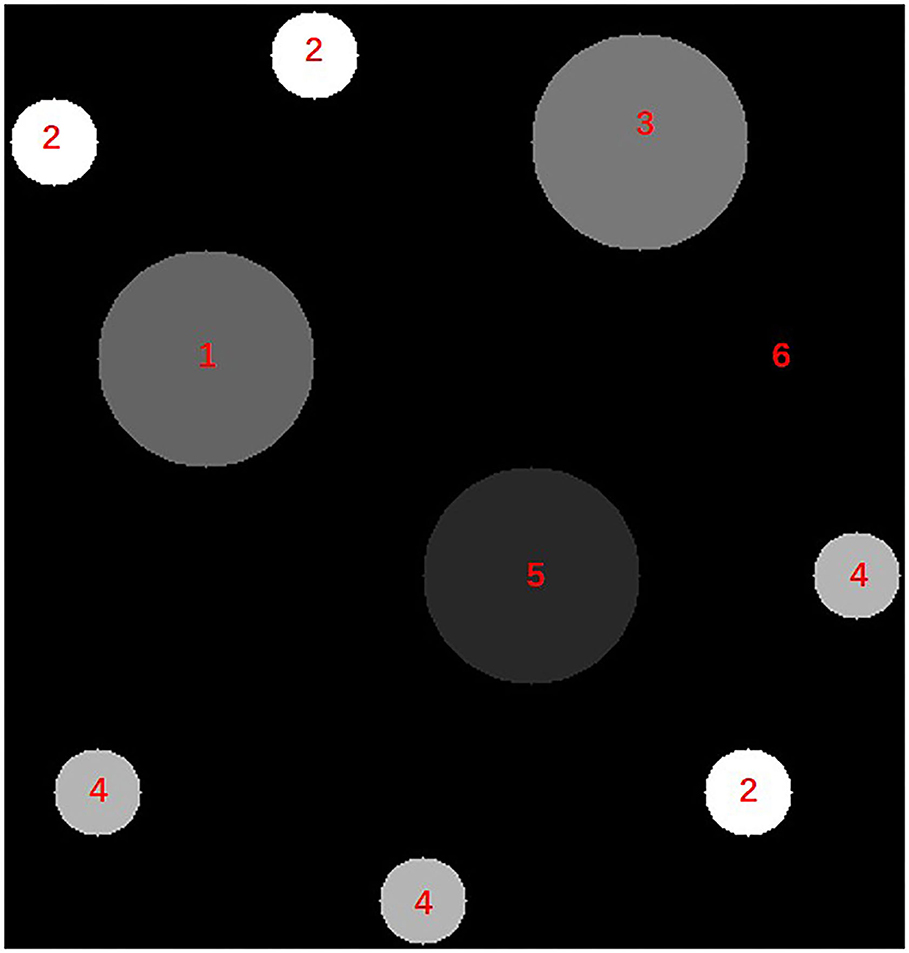
Figure 6. The diagram of the pre-calibrated phantom. The materials represented by numbers 1– 6 are: adipose tissue, bone, muscle, blood and iodine, lung tissue, air.
Results
Monte Carlo Simulation
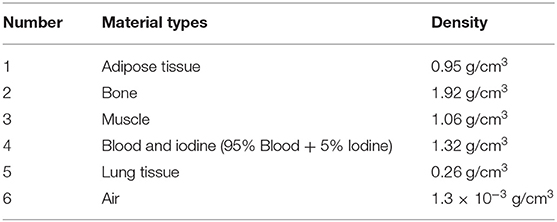
A Monte Carlo simulation using the Geant4 toolkit [45] is performed for the TPCT system. A modified thorax phantom is scanned in the simulation, for the chest CT is a powerful tool for diagnosing thoracic diseases [46]. The cross section of the phantom is shown in Figure 7. Body materials of the phantom are selected from ICRU 46 [47]. The selected body materials include adipose tissue, bone, muscle, iodine, and blood. They have similar elemental components. The locations of the materials are labeled in Figure 7. The detailed materials types and densities are described in Table 1.
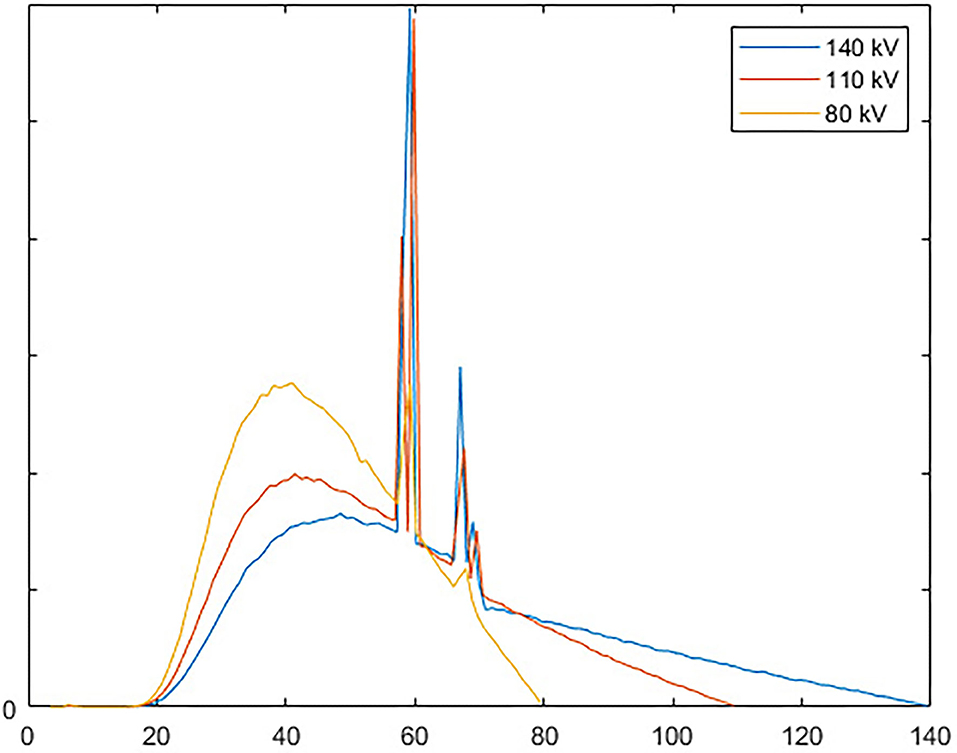
Three different voltages, 140, 110, and 80 kV, are set to three multi-beam sources. The spectral of all three tube voltages are shown in Figure 8. The currents of the tube are set to 25 mA. The spot exposure time of the 110 and 140 kV scanning is 1.5 ms, and that of the 80 kV scanning is 4.5 ms. Twenty eight servers run the simulation in parallel. Each server has two Intel Xeon Gold 6135 8-cores CPU. The total running time is about 58 h.
The angle-based SART [48] is used for image reconstruction. TV [49] constraints optimized with gradient descent method are applied. The iteration time is 30. For each iteration, 10 times TV minimization is applied. Non-negative constraints are added after each iteration. Decomposition results are shown by applying the image-domain decomposition algorithm [36, 50]. The basic materials contain bone, blood and iodine, soft tissue, and air.
To illustrate the proposed scatter correction algorithm and the hybrid reconstruction algorithm's effectiveness, the full-view scanning simulations with scatter correction, and without scatter correction are performed. Each tube voltage is set to the CNT sources of all three planes. Therefore, the hybrid reconstruction algorithm is not needed for full-view scan imaging. Other data processing methods and configurations are the same as the multi-energy TPCT imaging.
Reconstruction Results
The six-energy reconstruction results of different algorithms are shown in Figure 9. The scatter-free full-view (scatter-free-FV) simulation results have the best image quality. The artifacts are the least among the results of all the algorithms. In the scattered full-view (scattered-FV) simulation results, cupping artifacts caused by scatter photons are apparent. The artifacts are severer with the decrease of the energy, which leads to the inaccuracy of the linear coefficients. In the scatter-corrected full-view (scatter-corrected-FV) simulation results, the cupping artifacts are vastly reduced. The TPCT results are almost consistent with the scatter-corrected-FV results and similar to the scatter-free-FV results, which shows the feasibility of the TPCT imaging.
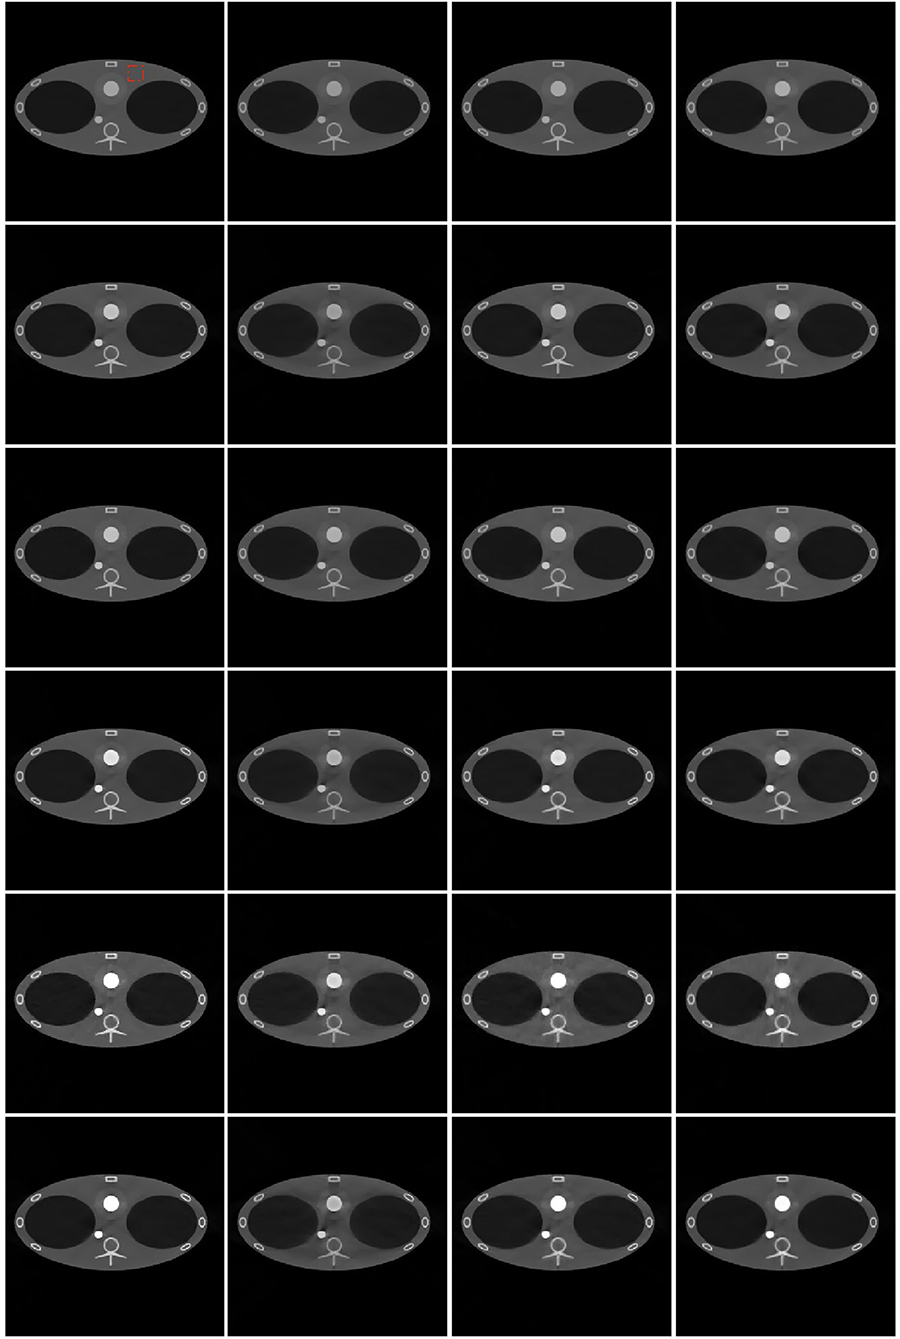
Figure 9. Reconstruction results of different algorithms and energies. From top to bottom: 140 kV high energy, 140 kV low energy, 110 kV high energy, 110 kV low Energy, 80 kV high energy, 80 kV low energy. From left to right: scatter-free full-view (scatter-free-FV) results, scattered (scattered-FV) results, scatter corrected (scattered-corrected-FV) results, triple plane CT (TPCT) results. The red square in the left top image is the ROI. The display window is [−1000, 2000] HU.
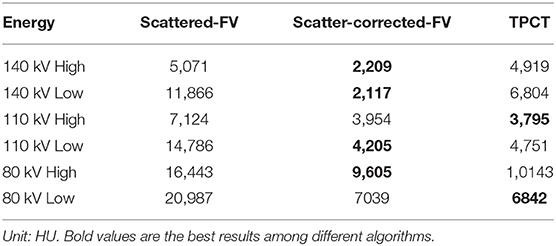
The quantitative evaluations show similar conclusions. The mean error square (MSE) is calculated to evaluate the accuracy of the reconstruction of different algorithms. The scatter-free-FV are set as the references. The MSE results are shown in Table 2. The MSEs of the scattered-FV results in all energies are much higher than that of other algorithms, which shows the severe impacts of scatter artifacts in the proposed CT geometries. The MSEs of the TPCT results are similar to the scatter-free-FV results and much smaller than that of the scattered-FV results.
The mean values and standard deviations (STDs) of the region of interest (ROI) are calculated and compared among different algorithms. The location of ROI is shown in the red rectangle in Figure 9. Table 3 presents the comparisons. The mean values of the scatter-corrected-FV results and the TPCT results are close to the scatter-free-FV results' mean values. However, the mean values of the scattered-FV results deviate from the scatter-free-FV results a lot. The STDs comparisons show similar conclusions. The scatter-free-FV results have the smallest STDs. The STDs of the TPCT results are small and close to the scatter-free-FV STDs.
Decomposition Results
The image-domain decomposition results of different algorithms are shown in Figure 10. In the decomposition results of all algorithms, the soft-tissue images and air images are classified correctly. The bone images, blood, and iodine images are misclassified in the scattered-FV results because of their close linear attenuation coefficients. However, in the scatter-corrected-FV results, they are classified correctly. They are similar to the scatter-free-FV results, proving the scatter correction algorithm's successful application in this special CT geometry. The TPCT decomposition results are extremely similar to the scatter-corrected-FV results, which show the hybrid reconstruction algorithm's feasibility.
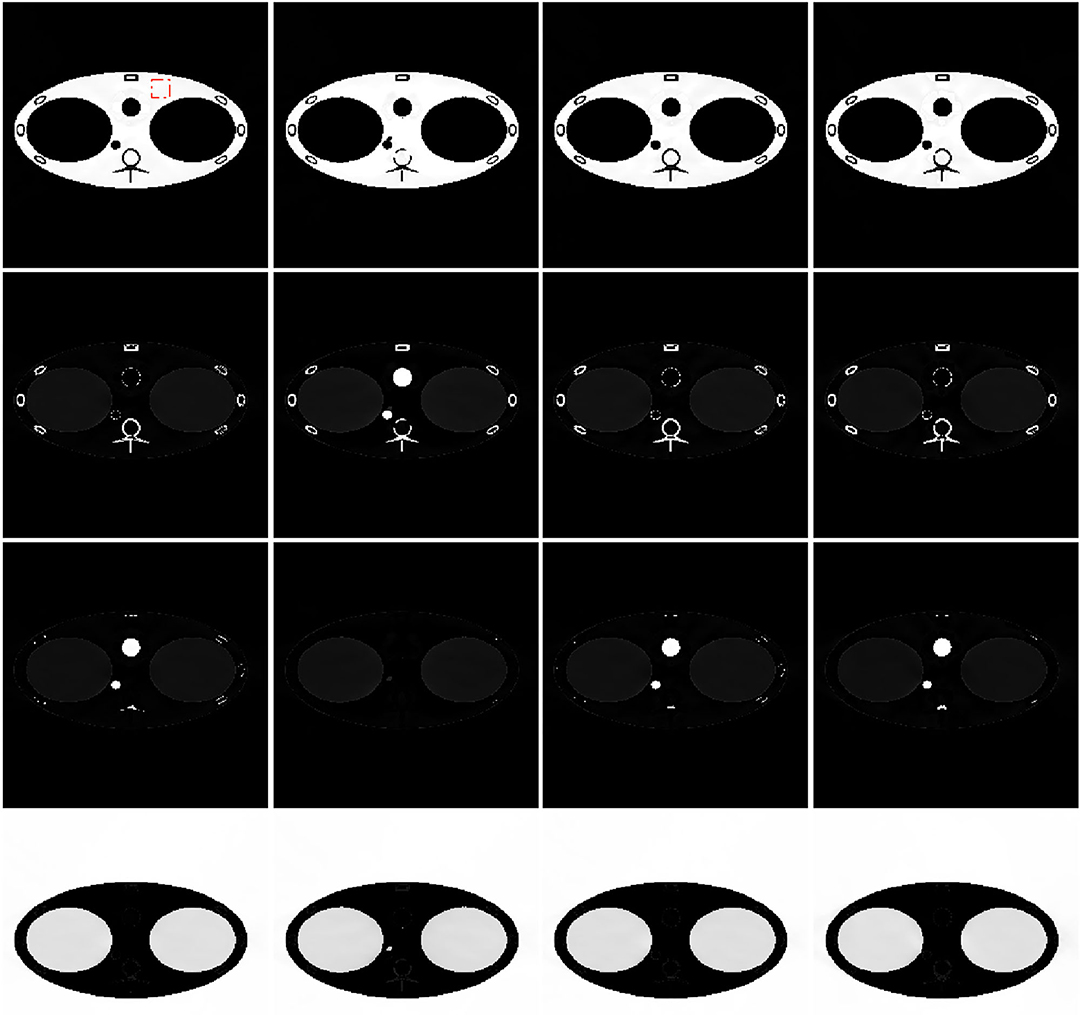
Figure 10. Decomposition results of different algorithms and body materials. From top to bottom: soft tissue, bone, blood, and iodine, air. From left to right: scatter-free full-view (scatter-free-FV) results, scattered (scattered-FV) results, scatter corrected (scattered-corrected-FV) results, triple plane CT (TPCT) results. Display windows is [0, 1].
Discussion and Conclusion
In this paper, we propose a novel static CT system for multi-energy imaging. The motivation for the TPCT system is to enable multi-energy imaging while maintaining high temporal resolution. For the conventional helical CT system, the rotation time and maximum tube current limit higher temporal resolution. The conventional thermionic source's maximum tube current is about several hundred milliamperes and <500 mA. It is the heat dissipation system that restricts the max current. For the TPCT system, by applying multiple spots and field emission sources, heat dissipation is not a problem. In theory, the maximum current is proportional to the area of the carbon nanotubes. At the current stage, the maximum current of the TPCT prototype can reach 100 mA. The design target of the maximum current is 1,000 mA. In this case, if the amount of exposure is 100 mAs, the temporal resolution can reach 0.1 s, which can satisfy the temporal resolution requirement of cardiac imaging.
The special geometry of the proposed TPCT system introduces extra artifacts, even in the full-view data results. Figure 11 shows the scatter-free-full-view reconstruction results without TV constraints. The artifacts are apparent in the images. It was caused by the line-array geometry and uneven angular distribution of different rays. By applying TV penalty term in the iterative reconstruction, most of the streak artifacts in Figure 11 can be eliminated. However, the strength of the TV term needs careful adjustment to avoid the loss of image details. Because of the large amount of calculation in the Monte Carlo simulation, it is difficult to increase the dose to the clinical application level, which might degrade the image quality. All the factors undoubtedly increase the difficulty of high-quality image reconstruction.
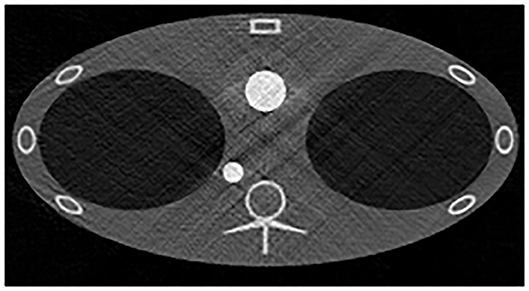
Figure 11. The 110 kV low-energy scatter-free-full-view reconstruction results without TV constraints. The display window is [−1000, 2000] HU.
The scatter effect is another problem. Because of the large incident angles, the scatter effect of the TPCT system is much severer than the conventional fan-beam CT system. Hence it needs correct. Because the analytical simulation is difficult to simulate the scatter artifacts, the Monte-Carlo simulation is needed. The computation burden of the Monte-Carlo simulation is enormous for CT imaging. It is challenging to simulate sufficient Monte Carlo data to train machine-learning-based algorithms applied in the TPCT imaging. Though the proposed machine learning algorithms have been proved to be valid in our work, the generalization and stability need further proof in future work.
However, some limitations exist in this study. First of all, in the current CT design, the time interval between different planes' scans, which is at the level of a few hundred milliseconds, can cause motion artifacts. These motion artifacts could degrade the material decomposition quality to a great extent. The solution is to set all the detectors in the same plane and all the source spots in another plane. A ring-shaped static CT system based on the above idea is under design. Second, in the current dual-layer detector design, a filter is applied between the low-energy detector and high-energy detector. This design could reduce the efficiency of photon detection in the second-layer detector. The solution is to use another type of scintillator, which is only sensitive to low-energy photons, for the first-layer detector. We will negotiate with the manufacturer about the choice of a low-energy scintillator and hope to change the low-energy scintillator in future work. Third, the proof-of-concept results are based on an ideal Monte Carlo simulation. However, the CNT technique is not fully developed. Therefore, some non-ideal factors, such as the consistency of different source spots, the stability of the x-ray source spots when exposed for a long time, and the spectrum's angular distribution, may degrade the image quality. Finally, the scatter correction neural network uses the scatter-free projection obtained from the Monte Carlo simulation, which is not easy to obtain in the actual system. One feasible method is to add a post-collimator to each detector pixel and collect the scatter-free projection data for only one pixel in each scan. Unavoidably, the workload of this calibration is huge.
The good quality of the reconstruction results and decomposition results verify the feasibility of the TPCT design. It is an attempt to break through the limitation of existing CT systems. In future work, we will focus on the performance in the real system. Though most of the physical process is computed in the Monte-Carlo simulation, some effects, such as the CNT sources' stability, are not considered. At present, a real TPCT prototype is in manufacturing. The scatter correction and hybrid reconstruction algorithm will be verified in the real CT system in the future.
Data Availability Statement
The original contributions presented in the study are included in the article/supplementary material, further inquiries can be directed to the corresponding author/s.
Author Contributions
ZC proposed the system design and provided funding support. LL prposed the imaging algorithm. YY proposed the neural networks, implemented all the imaging system and algoritm and wrote the manuscript. All authors contributed to the article and approved the submitted version.
Funding
This work was supported by NSFC 11525521.
Conflict of Interest
The authors declare that the research was conducted in the absence of any commercial or financial relationships that could be construed as a potential conflict of interest.
References
1. Lell MM, Kachelriess M. Recent and upcoming technological developments in computed tomography high speed, low dose, deep learning, multienergy. Invest Radiol. (2020) 55:8–19. doi: 10.1097/RLI.0000000000000601
2. Lell MM, Wildberger JE, Alkadhi H, Damilakis J, Kachelriess M. Evolution in computed tomography the battle for speed and dose. Invest Radiol. (2015) 50:629–44. doi: 10.1097/RLI.0000000000000172
3. Duan X, Ananthakrishnan L, Guild JB, Xi Y, Rajiah P. Radiation doses and image quality of abdominal CT scans at different patient sizes using spectral detector CT scanner: a phantom and clinical study. Abdom Radiol. (2019) 45:3361–8. doi: 10.1007/s00261-019-02247-1
5. FitzGerald P, Bennett J, Carr J, Edic PM, Entrikin D, Gao HW, et al. Cardiac CT: a system architecture study. J X-ray Sci Technol. (2016) 24:43–65. doi: 10.3233/XST-160537
6. Boyd DP, Lipton MJ. Cardiac computed-tomography. Proc IEEE. (1983) 71:298–307. doi: 10.1109/PROC.1983.12588
7. Schmidt TG, Fahrig R, Pelc NJ, Solomon EG. An inverse-geometry volumetric CT system with a large-area scanned source: a feasibility study. Med Phys. (2004) 31:2623–7. doi: 10.1118/1.1786171
8. Schmidt TG. What is inverse-geometry CT? J Cardiovasc Comput Tomogr. (2011) 5:145–8. doi: 10.1016/j.jcct.2011.04.003
9. Beque D, De Man B, Iatrou M. Iterative reconstruction for multi-source inverse geometry CT: a feasibility study. In: Hsieh J, Flynn MJ, editors. Medical Imaging 2007: Physics of Medical Imaging, Pts 1-3. Proceedings of SPIE. Bellingham, WA: Spie-Int Soc Optical Engineering (2007). vol. 6510. doi: 10.1117/12.712852
10. De Man B, Basu S, Beque D, Claus B, Edic P, Iatrou M, et al. Multi-source inverse geometry CT : a new system concept for X-ray computed tomography. In: Hsieh J, Flynn MJ, editors. Medical Imaging 2007: Physics of Medical Imaging, Pts 1-3. Proceedings of SPIE. Bellingham, WA: Spie-Int Soc Optical Engineering (2007). vol. 6510. doi: 10.1117/12.712854
11. De Man B, Basu S, Fitzgerald P, Harrison D, Iatrou M, Khare K, et al. Inverse geometry CT: the next-generation CT architecture. In: 2007 IEEE Nuclear Science Symposium Conference Record, Vols 1-11. IEEE Nuclear Science Symposium and Medical Imaging Conference. New York, NY: IEEE (2007). p. 2715–+. doi: 10.1109/NSSMIC.2007.4436704
12. Baek J, Pelc NJ, Deman B, Uribe J, Harrison D, Reynolds J, et al. Initial results with a multi-source inverse-geometry CT system. In: Pelc NJ, Nishikawa RM, Whiting BR, editors. Medical Imaging 2012: Physics of Medical Imaging. Proceedings of SPIE. Bellingham, WA: Spie-Int Soc Optical Engineering (2012). vol. 8313. doi: 10.1117/12.912207
13. Baek J, De Man B, Uribe J, Longtin R, Harrison D, Reynolds J, et al. A multi-source inverse-geometry CT system: initial results with an 8 spot x-ray source array. Phys Med Biol. (2014) 59:14. doi: 10.1088/0031-9155/59/5/1189
14. Baek J, De Man B, Harrison D, Pelc NJ. Raw data normalization for a multi source inverse geometry CT system. Opt Expr. (2015) 23:7514–26. doi: 10.1364/OE.23.007514
15. De Man B, Uribe J, Baek J, Harrison D, Yin Z, Longtin R, et al. Multisource inverse-geometry CT. Part I. System concept and development. Med Phys. (2016) 43:4607–16. doi: 10.1118/1.4954846
16. Neculaes VB, Caiafa A, Cao Y, De Man B, Edic PM, Frutschy K, et al. Multisource inverse-geometry CT. Part II. X-ray source design and prototype. Med Phys. (2016) 43:4617–27. doi: 10.1118/1.4954847
17. Schmidt TG. Preliminary feasibility of dedicated breast CT with an inverse geometry. In: Proceedings of the SPIE. The International Society for Optical Engineering, Vol. 7258. Lake Buena Vista, FL: SPIE - The International Society for Optical Engineering, USA (2009).
18. Bhagtani R, Schmidt TG. Simulated scatter performance of an inverse-geometry dedicated breast CT system. Med Phys. (2009) 36:788–96. doi: 10.1118/1.3077165
19. Cao GH, Liu BD, Yu HY, Wang G. A new CT architecture with stationary x-ray sources. In: Stock SR, editor. Developments in X-Ray Tomography Viii. Proceedings of SPIE. Bellingham, WA: Spie-Int Soc Optical Engineering (2012). vol. 8506. doi: 10.1117/12.930571
20. Hsieh SS, Heanue JA, Funk T, Hinshaw WS, Pelc NJ. An inverse geometry CT system with stationary source arrays. In: Pelc NJ, Samei E, Nishikawa RM, editors. Medical Imaging 2011: Physics of Medical Imaging. Proceedings of SPIE. Bellingham, WA: Spie-Int Soc Optical Engineering (2011). vol. 7961. doi: 10.1117/12.878801
21. Hsieh SS, Pelc NJ. A volumetric reconstruction algorithm for stationary source inverse-geometry CT. In: Pelc NJ, Nishikawa RM, Whiting BR, editors. Medical Imaging 2012: Physics of Medical Imaging. Proceedings of SPIE. Bellingham, WA: Spie-Int Soc Optical Engineering (2012). vol. 8313. doi: 10.1117/12.912490
22. Hsieh SS, Heanue JA, Funk T, Hinshaw WS, Wilfley BP, Solomon EG, et al. The feasibility of an inverse geometry CT system with stationary source arrays. Med Phys. (2013) 40:14. doi: 10.1118/1.4789918
23. Lee YZ, Burk L, Wang KH, Cao GH, Lu JP, Zhou O. Carbon nanotube based X-ray sources: applications in pre-clinical and medical imaging. Nucl Instrum Methods Phys Res A. (2011) 648:S281–3. doi: 10.1016/j.nima.2010.11.053
24. Quan EM, Lalush DS. Three-dimensional imaging properties of rotation-free square and hexagonal micro-CT systems. IEEE Trans Med Imaging. (2010) 29:916–23. doi: 10.1109/TMI.2009.2039799
25. Gonzales B, Spronki D, Cheng Y, Tucker AW, Beckman M, Zhou O, et al. Rectangular fixed-gantry CT prototype: combining CNT x-ray sources and accelerated compressed sensing-based reconstruction. IEEE Access. (2014) 2:971–81. doi: 10.1109/ACCESS.2014.2351751
26. Zhang T, Xing Y, Zhang L, Jin X, Gao H, Chen Z. Stationary computed tomography with source and detector in linear symmetric geometry: direct filtered backprojection reconstruction. Med Phys. (2020) 47:2222–36. doi: 10.1002/mp.14058
27. Zhang T, Zhang L, Chen Z, Xing Y, Gao H. Fourier properties of symmetric-geometry computed tomography and its linogram reconstruction with neural network. IEEE Trans Med Imaging. (2020) 39:4445–57. doi: 10.1109/TMI.2020.3020720
28. Ning R, Tang XY, Conover D. X-ray scatter correction algorithm for cone beam CT imaging. Med Phys. (2004) 31:1195–202. doi: 10.1118/1.1711475
29. Zhu L, Bennett NR, Fahrig R. Scatter correction method for x-ray CT using primary modulation: theory and preliminary results. IEEE Trans Med Imaging. (2006) 25:1573–87. doi: 10.1109/TMI.2006.884636
30. Swindell W, Evans PM. Scattered radiation in portal images: a Monte Carlo simulation and a simple physical model. Med Phys. (1996) 23:63–73. doi: 10.1118/1.597792
31. Meyer M, Kalender WA, Kyriakou Y. A fast and pragmatic approach for scatter correction in flat-detector CT using elliptic modeling and iterative optimization. Phys Med Biol. (2010) 55:99–120. doi: 10.1088/0031-9155/55/1/007
32. Yasaka K, Akai H, Kunimatsu A, Kiryu S, Abe O. Deep learning with convolutional neural network in radiology. Jpn J Radiol. (2018) 36:257–72. doi: 10.1007/s11604-018-0726-3
33. Hansen DC, Landry G, Kamp F, Li ML, Belka C, Parodi K, et al. ScatterNet: a convolutional neural network for cone-beam CT intensity correction. Med Phys. (2018) 45:4916–26. doi: 10.1002/mp.13175
34. Jiang YK, Yang CL, Yang PF, Hu X, Luo C, Xue Y, et al. Scatter correction of cone-beam CT using a deep residual convolution neural network (DRCNN). Phys Med Biol. (2019) 64:15. doi: 10.1088/1361-6560/ab23a6
35. Maier J, Eulig E, Voth T, Knaup M, Kuntz J, Sawall S, et al. Real-time scatter estimation for medical CT using the deep scatter estimation: Method and robustness analysis with respect to different anatomies, dose levels, tube voltages, and data truncation. Med Phys. (2019) 46:238–49. doi: 10.1002/mp.13274
36. Yao YD, Li L, Chen ZQ. Dynamic-dual-energy spectral CT for improving multi-material decomposition in image-domain. Phys Med Biol. (2019) 64:22. doi: 10.1088/1361-6560/ab196d
37. Li L, Chen ZQ, Cong WX, Wang G. Spectral CT Modeling and reconstruction with hybrid detectors in dynamic-threshold-based counting and integrating modes. IEEE Trans Med Imaging. (2015) 34:716–28. doi: 10.1109/TMI.2014.2359241
38. Willemink MJ, Persson M, Pourmorteza A, Pelc N, Fleischmann D. Photon-counting CT: technical Principles and clinical prospects. Radiology. (2018) 289:293–312. doi: 10.1148/radiol.2018172656
39. Yu L, Li Z, Leng S, McCollough C. Dual-Source Multi-Energy CT with Triple or Quadruple X-ray Beams. San Diego, CA: SPIE The International Society for Optical Engineering (2016). doi: 10.1117/12.2217446
40. Chen ZQ, Jin X, Li L, Wang G. A limited-angle CT reconstruction method based on anisotropic TV minimization. Phys Med Biol. (2013) 58:2119–41. doi: 10.1088/0031-9155/58/7/2119
41. Qu ZY, Yan XM, Pan JX, Chen P. Sparse view CT image reconstruction based on total variation and wavelet frame regularization. IEEE Access. (2020) 8:57400–13. doi: 10.1109/ACCESS.2020.2982229
42. Qu ZY, Zhao XJ, Pan JX, Chen P. Sparse-view CT reconstruction based on gradient directional total variation. Meas Sci Technol. (2019) 30:11. doi: 10.1088/1361-6501/ab09c6
43. Jin X, Li L, Chen ZQ, Zhang L, Xing YX. Anisotropic total variation minimization method for limited-angle CT reconstruction. In: Stock SR, editor. Developments in X-Ray Tomography Viii. Proceedings of SPIE. Bellingham: Spie-Int Soc Optical Engineering (2012). vol. 8506. doi: 10.1117/12.930339
44. Zhang H, Xing Y, editors. Reconstruction of limited-angle dual-energy CT using mutual learning and cross-estimation (MLCE). In: Medical Imaging 2016: Physics of Medical Imaging. San Diego, CA: International Society for Optics and Photonics (2016). doi: 10.1117/12.2211224
45. Agostinelli S, Allison J, Amako K, Apostolakis J, Araujo H, Arce P, et al. GEANT4-a simulation toolkit. Nucl Instrum Methods Phys Res Sect A-Accel Spectrom Dect Assoc Equip. (2003) 506:250–303. doi: 10.1016/S0168-9002(03)01368-8
46. Duan X, McCollough C, editors. Risks, benefits, and risk reduction strategies in thoracic CT imaging. In: Seminars in Respiratory and Critical Care Medicine. Thieme Medical Publishers (2014). doi: 10.1055/s-0033-1363454
47. White DR, Griffith RV, Wilson IJ. Report 46. J Int Comm Radiat Units Meas. (2016) os24:11–3. doi: 10.1093/jicru/os24.1.Report46
48. Andersen AH, Kak AC. Simultaneous algebraic reconstruction technique (sart) - a superior implemen'tation of the art algorithm. Ultrason Imaging. (1984) 6:81–94. doi: 10.1177/016173468400600107
49. Sidky EY, Kao CM, Pan XH. Accurate image reconstruction from few-views and limited-angle data in divergent-beam CT. J X-ray Sci Technol. (2006) 14:119–39. doi: 10.1364/JOSAA.25.001772
Keywords: static CT, multi-energy imaging, inverse-geometry, hybrid reconstruction, material decomposition
Citation: Yao Y, Li L and Chen Z (2021) A Novel Static CT System: The Design of Triple Planes CT and Its Multi-Energy Simulation Results. Front. Phys. 9:632869. doi: 10.3389/fphy.2021.632869
Received: 24 November 2020; Accepted: 06 April 2021;
Published: 07 May 2021.
Edited by:
Claudia Kuntner, Medical University of Vienna, AustriaReviewed by:
Stefan Sawall, German Cancer Research Center (DKFZ), GermanyJean Michel Létang, Institut National des Sciences Appliquées de Lyon (INSA Lyon), France
Xinhui Duan, University of Texas Southwestern Medical Center, United States
Copyright © 2021 Yao, Li and Chen. This is an open-access article distributed under the terms of the Creative Commons Attribution License (CC BY). The use, distribution or reproduction in other forums is permitted, provided the original author(s) and the copyright owner(s) are credited and that the original publication in this journal is cited, in accordance with accepted academic practice. No use, distribution or reproduction is permitted which does not comply with these terms.
*Correspondence: Liang Li, bGxpYW5nQHRzaW5naHVhLmVkdS5jbg==; Zhiqiang Chen, Y3pxQHRzaW5naHVhLmVkdS5jbg==
 Yidi Yao
 Liang Li
 Zhiqiang Chen