 Si-Hao Liu
 Xiao Fan Liu
94% of researchers rate our articles as excellent or good
Learn more about the work of our research integrity team to safeguard the quality of each article we publish.
Find out more
ORIGINAL RESEARCH article
Front. Phys., 16 March 2021
Sec. Social Physics
Volume 9 - 2021 | https://doi.org/10.3389/fphy.2021.631659
This article is part of the Research TopicCryptocurrency Transaction Analysis from a Network PerspectiveView all 12 articles
Cryptocurrencies have attracted extensive attention from individual and institutional investors in recent years. In this emerging and inefficient capital market, the roles that institutional investors play can have a remarkable impact on the market. This paper investigates the ERC-20 token investment market from a network perspective. Using a dataset containing 317 ERC-20 tokens and their institutional investors at the end of June 2020, we construct a co-investment network of tokens connected by the sharing of institutional investors. Specifically, we examine whether the tokens’ market embeddedness, measured by their network structural properties, can influence their market performance, as well as whether the tokens’ structural similarity in the co-investment network can influence similarity of their market performance. Our results indicate that strength centrality, closeness centrality, betweenness centrality, and clustering coefficient have a significant impact on trading volume and liquidity of the market. And there is a significantly positive correlation between the Jaccard similarity index and tokens’ market performance similarity. This work demonstrates the non-negligible influence of the institutional investors and the diffusion of such influence through co-investment relationships in the cryptocurrency market. We expect the analysis could further enhance the understanding of the inefficiency and vulnerability of this emerging market.
As the end of 2020, there are more than 7,000 cryptocurrencies in circulation worldwide. The total cryptocurrency market value has exceeded 300 billion US dollars, with a daily trading volume topping 200 billion [1]. However, only a few hundred of these cryptocurrencies run on their own blockchains, while others reside on Ethereum-like blockchain platforms, which support users to issue smart contract-based cryptocurrencies, also known as tokens, following token standards such as ERC-20, ERC-721, and ERC-777. The number of smart contract-based tokens on Ethereum is more than 300,000 as of 2020 [2], though not all are publicly traded in cryptocurrency exchanges.
Despite the soaring capitalization, the emerging cryptocurrency market also exhibits extremely high volatility. Hence, finding the driving forces of the market is crucial to the understanding of the formation and development of cryptocurrencies’ prices. All the evidence points out that this market is highly inefficient. Buchholz et al. [3] claimed that the supply and demand in the market are among the main drivers of the bitcoin price. Wijk [4] emphasized the role of global macroeconomic indicators, e.g., stock indices, exchange rates, and oil prices, in determining Bitcoin’s price. He found that the Dow Jones Index, the euro-dollar exchange rate, and the WTI oil price have a long-term and significant effect on Bitcoin’s value. Kristoufek [5] found that the price of Bitcoin was significantly and positively correlated with public interests measured by Google Trends and Wikipedia queries, as well as technical indexes, such as hash rates and mining difficulty, in the long run. Moreover, the cryptocurrency market’ performance has also been found to be related to media exposure [6, 7], policies and regulations [8, 9], and other financial assets [10, 11], all revealing the inefficiency of the market.
An inefficient market is easily manipulated, especially by large investors. Compared to individual investors, institutional investors can rely on their capital, talent, and information advantages to profit [12], and they also have a stronger ability to capture and conceal bad news in the market [13]. In the case of ERC-20 tokens, institutional investors play a crucial role in both the primary and secondary markets. In a typical ERC-20 token initial offering (ICO) process, i.e., the primary market, the institutional investors would first purchase a large chunk of tokens from the issuer and redistribute a proportion to individual investors before public listing while retaining some tokens for market-making in the secondary market. Institutional investors commonly invest in more than one token to disperse their risks among multiple projects. As a result, they act as intermediaries between different tokens, therefore transmitting market influences from one token to another. To the best of our knowledge, there is still a lack of research on the relationship between institutional investors’ investment preference and the performance of the cryptocurrency market.
This paper investigates the impact of institutional investors’ dispersed investments on the cryptocurrency market, i.e., how the individual ERC-20 tokens’ market performances, e.g., price, volatility, and trading volume, are affected by their sharing of institutional investors. We construct a co-investment network that uses ERC-20 tokens as nodes and the pairwise sharing of institutional investors as edges. From the macroscopic perspective, such a co-investment network offers a panorama of the institutional investors’ influence distribution. While from the microscopic perspective, we can closely examine the intertwining influence of multiple institutional investors on the individual ERC-20 tokens.
Specifically, we try to answer two research questions. First, how the market “embeddedness” of individual ERC-20 tokens, in analogy to Granottever’s market embeddedness of social-economical actors [14] and measured by the corresponding nodes’ network structural properties, affects the tokens’ market performance. Second, whether tokens with similar “embeddedness”, measured by the similarity of their network structure, and therefore experiencing similar market impacts, also have converged market performance.
The rest of the paper is organized as follows. Section 2 describes the data and their sources. Section 3 describes the research methods, including the selection and calculation of six indicators quantifying market performance, as well as the construction and calculation of the co-investment network. Section 4 presents the empirical results of the research hypothesis in detail and makes an in-depth analysis of the results. Section 5 summarizes the whole paper and discusses the direction of future work.
The institutional investors’ investments into ERC-20 tokens can be obtained from Block123.com [15]. As of June 2020, the website listed 556 cryptocurrency projects, of which 317 are ERC-20 tokens, and their institutional investors. At the time of data acquisition, all 317 ERC-20 tokens were actively trading in the cryptocurrency market. To the best of the authors’ knowledge, block123.com provides the largest and most complete token-investor relationship dataset that is publicly available. A detailed description of the dataset is given in Supplementary Section 1.
Market data, including the daily closing price, trading volume, and market capitalization (all in USD), of the 317 tokens are obtained from CoinMarketCap.com. Since cryptocurrencies are traded 7/24, we take the last reported price in one day as the daily closing price. The market data range from 1 to 31 July 2020, spanning one month after the acquisition of the token-investor dataset. And 85% of the 317 tokens are valued in the top 20% of the market.
Moreover, we consider three previously claimed drivers of token prices by Liu et al. [16] as extra factors influencing market performance. First, the numbers of tokens’ transactions on the blockchains are used as a proxy for adopters’ activity. The data are obtained from Etherscan [2]. Second, the indicators of tokens’ attention on social platforms, including Twitter followers, Telegram channel subscribers, Reddit board activities, and website rankings are used to represent public interests to the tokens. The data are obtained through the CoinGecko API [17]. Third, the technical indicators of the cryptocurrency projects, such as the Github popularity, are used to indicate the blockchain projects’ technical development. The data are also obtained from CoinGecko. These control variables are summarized in Table 1. Note that reddit_discussions and tech_score are combined values of similar factors. Details of the combination methods are described in Supplementary Section 2.
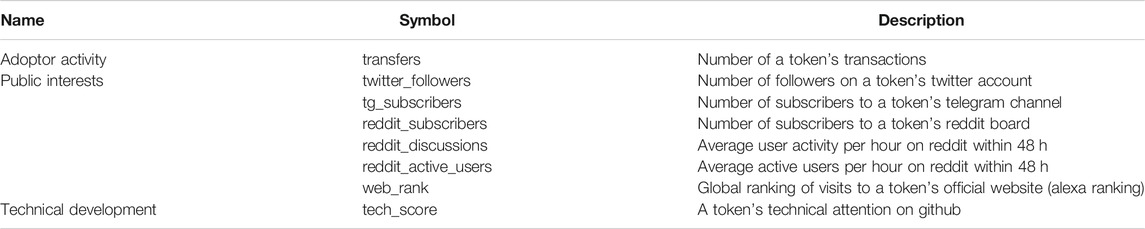
TABLE 1. Descriptions of the control variables.
We use six indicators to quantify the market performance of ERC-20 tokens. Daily price
The daily return
The volatility ν in a W-day window is defined as
where
The monthly (July 2020) price (n = 317, min = 0.0000126, max = 482, mean = 27.3, skewness = 17.40), market capitalization (n = 290, min = 13,810.12, max = 2638,362,922.00, mean = 40,925,401.09, skewness = 10.78), volume (n = 317, min = 0.06, max = 737,208,083.20, mean = 8,808,034.45, skewness = 11.42), return (n = 317, min = −0.04, max = 0.26, mean = 0.01, skewness = 4.61), volatility (n = 317, min = 0.00289, max = 0.581, mean = 0.0866, skewness = 3.11), and illiquidity (n = 316, min = −0.000011, max = 1,390,000.00, mean = 804, skewness = 14.40) of the tokens show a highly inequality in the cryptocurrency market. We calculate monthly illiquidity and volatility based on a 30-days window, and mean values of all daily data for monthly price, market capitalization, trading volume and return. All the indicators’ standard deviations are greater than their mean, meaning that the market quotations of different tokens varies greatly, and therefore, are highly heterogeneous.
Bitcoin and Ether, the original cryptocurrency of Ethereum, are the leaders in the cryptocurrency market. To capture the similarity between the market performance of two tokens, we use partial correlation coefficient of their market indicator time series, eliminating the same influence brought by the market leaders. For example, the partial correlation between two daily return series
where
and
We define the co-investment network
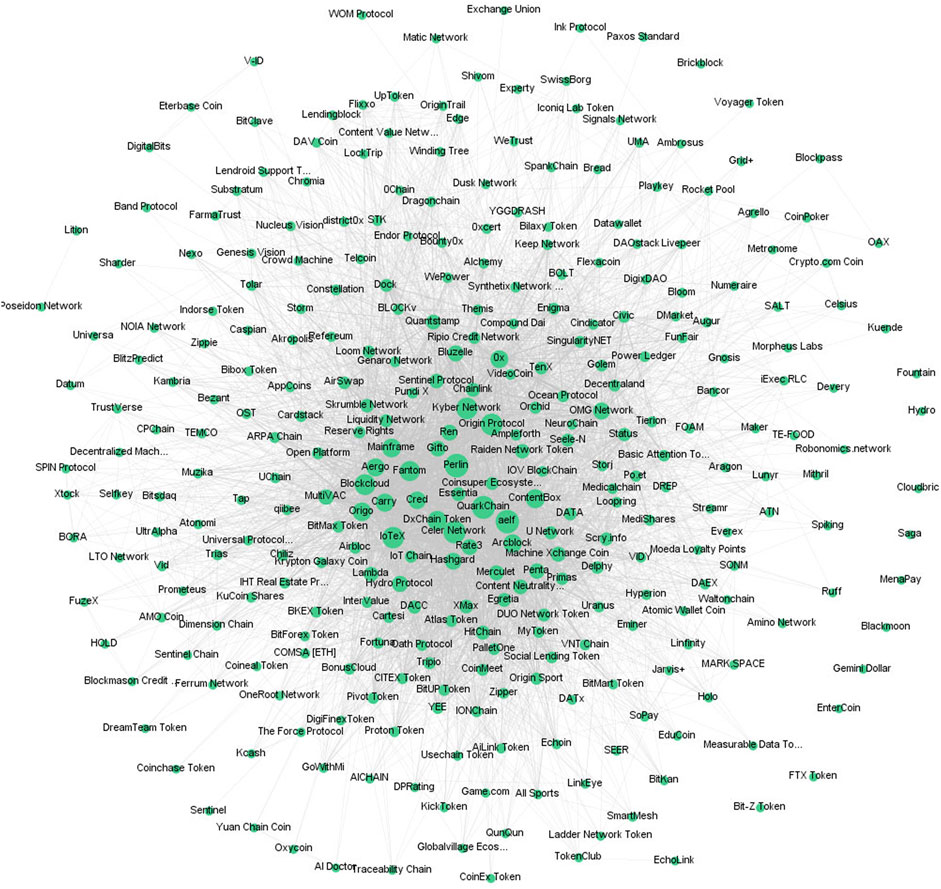
FIGURE 1. Co-investment network of ERC-20 Tokens. The sizes of the nodes are scaled by their degrees.
The market embeddedness of ERC-20 tokens can be measured by various network structural properties, each reflecting a unique aspect of their market status.
Strength centrality of a node v is defined as
where
Closeness centrality is the reciprocal of the average distance of the node to other vertices. i.e.,
Betweenness centrality of a node v is the sum of the fraction of all-pairs of shortest paths that pass through v.
where
Local clustering coefficient
where
The Jaccard index defines the structural similarity between different nodes based on common neighbors, i.e.,
where
Structural properties, i.e., the number of nodes N, number of edges M, average degree
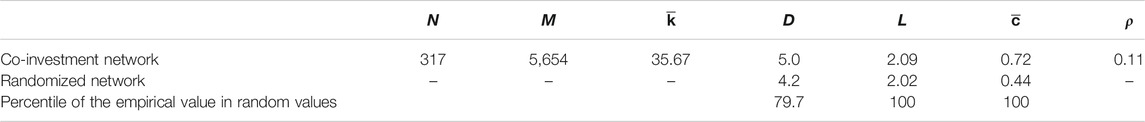
TABLE 2. Comparison of network properties between the co-investment network and randomized networks.
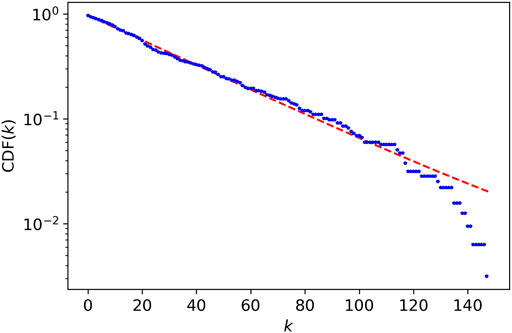
FIGURE 2. Cumulative degree distribution of the co-investment network.
In light of the high skewness of market indicators, we pre-process them before further analysis. The price, market capitalization, and trading volume are taken logarithm transformations; the illiquidity is taken a negative logarithm transformation. Furthermore, all variables are standardized as
Figure 3 shows the correlations between the market indicators and the market embeddedness and control variables. The logged price, market capitalization, volume, and liquidity have medium correlations (
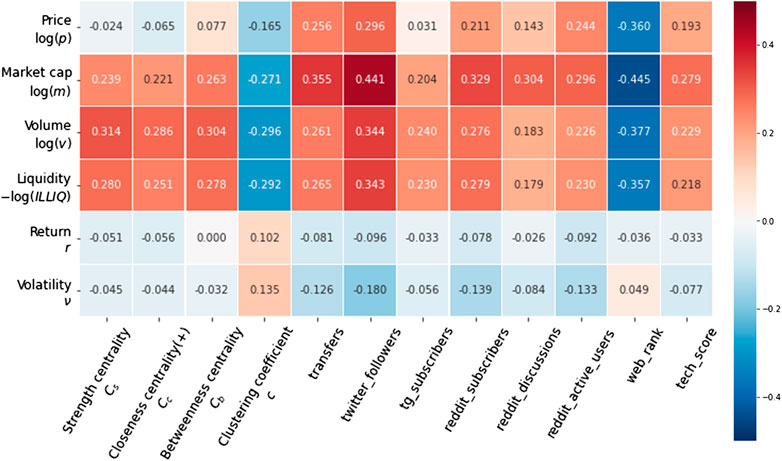
FIGURE 3. Correlation heat map between the market indicators and the market embeddedness and control variables.
We adopt ordinary least squares (OLS) linear regression models to analyze the relationship between market performance and various market embeddedness measures of the tokens in the co-investment network. For each market indicator, e.g., price p, we first develop a baseline multiple linear regression (MLR) model
where
We are interested in examining the statistical significance of
Table 3 shows the regression results for model 1 on all six market indicators. The
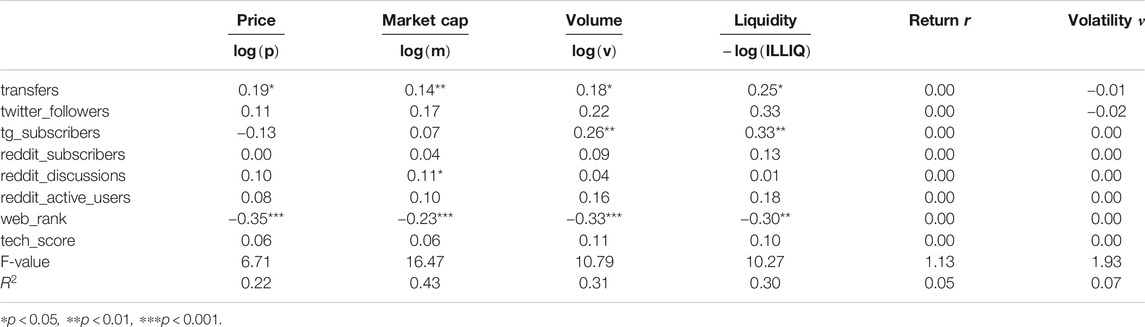
TABLE 3. Regressions between the market indicators and the control variables (model 1).
Table 4 shows the regression results of model 2. Specifically, strength centrality, at a significance level of 0.1%, improves the
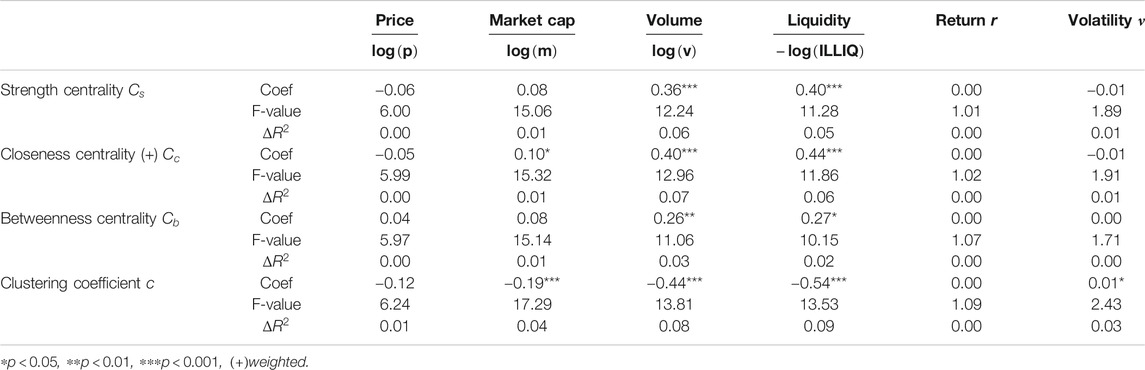
TABLE 4. Regressions between the market indicators and the tokens’ market embeddedness (model 2).
Again, we use OLS regression models to test our hypothesis that token nodes with similar network structures in the co-investment network, hypothetically impacted by similar market factors, will lead to convergence in their market performance.
The linear regression model between the structure similarity and the partial correlation coefficient of the tokens’ market indicators is defined as
where
Table 5 shows the regression results of model 3. We can find that the Jaccard similarity index is significantly positively correlated with all the market indicators’ partial correlations, confirming our hypothesis. That is to say, the more common neighbors the two token nodes have in the co-investment network, i.e., the more overlapped their portfolios are, the more similar their market performance, including price, market capitalization, trading volume, liquidity, return, and volatility, will be.
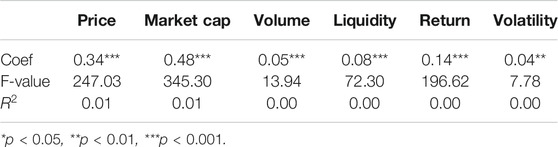
TABLE 5. Regressions between the partial correlations of market indicators and the Jaccard similarity between nodes (model 3).
This paper studies the role institutional investors play in the ERC-20 token market and how they affect the market performance of tokens, e.g., price, trading volume, market capitalization, liquidity, return, and volatility. We construct a co-investment network with ERC-20 tokens as nodes and the pairwise sharing of institutional investors as edges. As such, the intertwined influences of institutional investors on different tokens are embedded in the network.
The significant correlations between the strength centrality, closeness centrality, betweenness centrality, clustering coefficient of tokens, and their market performance reveal institutional investors’ positive impact on promoting market liquidity and reducing market volatility. Moreover, token nodes’ structural similarity measured by the Jaccard index is significantly positively correlated with their market indicator similarity, suggesting that the sharing of investment institutions between tokens may result in converged market performance.
Our work demonstrates the inefficiency and vulnerability of this emerging market and the non-negligible influence of the institutional investors and the diffusion of such influence through co-investment relationships in the cryptocurrency market. Furthermore, we also remind individual investors to pay extra attention in this highly speculative market, for that institutional investors may deliberately manipulative the market, creating bubbles and crushes for profit.
Note that our dataset contains only the institutional investors’ investments in 317 tokens out of approximately 7,000 tokens in circulation as of 2020. Nonetheless, as the tokens are mostly highly valued ones, we believe that the co-investment network of these tokens is a representative sample of the core of the cryptocurrency market, hence our conclusions being able to be generalized to other parts of the cryptocurrency market.
Publicly available datasets were analyzed in this study. This data can be found here: https://github.com/SuperLSH/-dataset_co-investment.git.
Both authors designed the study and wrote the paper. S-HL conducted data analysis.
This work is supported by CityU Start-up Grant for New Faculty (no. 7200649) and CityU Strategic Research Grant (no. 11503620).
The authors declare that the research was conducted in the absence of any commercial or financial relationships that could be construed as a potential conflict of interest.
The Supplementary Material for this article can be found online at: https://www.frontiersin.org/articles/10.3389/fphy.2021.631659/full#supplementary-material.
1.Coinmarketcap (2020). Available from: https://coinmarketcap.com/. (Accessed August 5, 2020).
2.Etherscan (2020). Available from: https://etherscan.io/. (Accessed July 31, 2020).
3. Buchholz M, Delaney J, Warren J, Parker J. Bits and bets, information, price volatility, and demand for bitcoin. Portland, OR:Reed College (2012). Available from: https://www.reed.edu/economics/parker/s12/312/finalproj/Bitcoin.pdf (Accessed October 19, 2020).
4. van Wijk D. What can be expected from the bitcoin?:.[Financial Economics thesis]. Rotterdam (Netherlands): Erasmus School of Economics (2013).
5. Kristoufek L. What are the main drivers of the bitcoin price? evidence from wavelet coherence analysis. PLoS One (2015) 10:e0123923. doi:10.1371/journal.pone.0123923
6. Kristoufek L. Bitcoin meets google trends and wikipedia: quantifying the relationship between phenomena of the internet era. Sci Rep (2013) 3:3415. doi:10.1038/srep03415
7. Rognone L, Hyde S, Zhang SS. News sentiment in the cryptocurrency market: an empirical comparison with forex. Int Rev Financial Anal (2020) 69. doi:10.1016/j.irfa.2020.101462
8. Shanaev S, Sharma S, Ghimire B, Shuraeva A. Taming the blockchain beast? regulatory implications for the cryptocurrency market. Res Int Business Finance (2020) 51. doi:10.1016/j.ribaf.2019.101080
9. Aysan AF, Demir E, Gozgor G, Lau CKM. Effects of the geopolitical risks on bitcoin returns and volatility. Res Int Business Finance (2018) 47.
10. Corbet S, Meegan A, Larkin C, Lucey B, Yarovaya L. Exploring the dynamic relationships between cryptocurrencies and other financial assets. Econ Lett (2018) 165:28–34. doi:10.1016/j.econlet.2018.01.004
11. Charfeddine L, Benlagha N, Maouchi Y. Investigating the dynamic relationship between cryptocurrencies and conventional assets: implications for financial investors. Econ Model (2020) 85:198–217. doi:10.1016/j.econmod.2019.05.016
12. Bushee BJ, Goodman TH. Which institutional investors trade based on private information about earnings and returns? J Account Res (2007) 45:323–31. doi:10.1111/j.1475-679x.2007.00234.x
13. Griffin JM, Harris JH, Shu T, Topaloglu S. Who drove and burst the tech bubble? J Finance (2011) 66:1251–90. doi:10.1111/j.1540-6261.2011.01663.x
14. Granovetter M. Economic action and social structure: the problem of embeddedness. Am J Sociol (1985) 91:481–510. doi:10.1086/228311
15.Block123 (2020). Available from: https://www.block123.com/en/. (Accessed June 21, 2020).
16. Liu XF, Lin ZX, Han XP. Homogeneity and heterogeneity of cryptocurrencies. Available from: https://arxiv.org/abs/1910.01330 (2019). (Accessed June 10, 2020).
17.Coingecko (2020). Available from: https://www.coingecko.com/en/. (Accessed July 31, 2020).
18. Amihud Y. Illiquidity and stock returns: cross-section and time-series effects. J Financial Markets (2002). 5(1):31–56. doi:10.1016/S1386-4181(01)00024-6
19. Lazega E, Burt RS. Structural holes: the social structure of competition. Revue Française de Sociologie 36, 779 (1995). doi:10.2307/3322456
Keywords: Cryptocurrency, Ethereum, ERC-20, co-investment, complex networks, institutional investors
Citation: Liu S-H and Liu XF (2021) Co-Investment Network of ERC-20 Tokens: Network Structure Versus Market Performance. Front. Phys. 9:631659. doi: 10.3389/fphy.2021.631659
Received: 20 November 2020; Accepted: 20 January 2021;
Published: 16 March 2021.
Edited by:
Hui-Jia Li, Beijing University of Posts and Telecommunications (BUPT), ChinaReviewed by:
Jianhong Lin, University of Zurich, SwitzerlandCopyright © 2021 Liu and Liu. This is an open-access article distributed under the terms of the Creative Commons Attribution License (CC BY). The use, distribution or reproduction in other forums is permitted, provided the original author(s) and the copyright owner(s) are credited and that the original publication in this journal is cited, in accordance with accepted academic practice. No use, distribution or reproduction is permitted which does not comply with these terms.
*Correspondence: Xiao Fan Liu, eGYubGl1QGNpdHl1LmVkdS5oaw==
Disclaimer: All claims expressed in this article are solely those of the authors and do not necessarily represent those of their affiliated organizations, or those of the publisher, the editors and the reviewers. Any product that may be evaluated in this article or claim that may be made by its manufacturer is not guaranteed or endorsed by the publisher.
Research integrity at Frontiers
Learn more about the work of our research integrity team to safeguard the quality of each article we publish.