- 1Graduate School of Frontier Sciences, The University of Tokyo, Kashiwa, Japan
- 2Nippon Kaiji Kyokai (ClassNK), Tokyo, Japan
- 3Centre for Wind, Waves and Water, School of Civil Engineering, The University of Sydney, Sydney, NSW, Australia
- 4Marine Studies Institute, The University of Sydney, Sydney, NSW, Australia
The presence of coherent wave groups in the ocean has been so far postulated but still lacks evidence other than the indication from the radar images. Here, we attempt to reconstruct a wave field to monitor the evolution of a directional wave group based on a phase resolving two-dimensional non-linear wave model constrained by the stereo images of the ocean surface. The reconstructed wave field of around 20 wavelength squared revealed a coherent wave group compact in both propagating and transverse directions. The envelope of the wave group seems to be oriented obliquely to the propagation direction, somewhat resembling the directional soliton that was theoretically predicted and experimentally and numerically reproduced recently. A comparison with a constrained linear wave model demonstrated the coherence of the non-linear wave group that propagates for tens of wavelengths. The study elaborates a possibility of a spatially coherent short crested wave group in the directional sea.
Introduction
Wave groups in the ocean have been recognized as early as in the 1970s in shallow and deep waters [1, 2] based on the analysis of time series data and spatial image. Concurrently, the formation of the long-crested wave groups has been postulated based on the non-linear Schrödinger equation (NLSE) and their existence was demonstrated numerically and experimentally [3, 4]. In reality, ocean waves are short-crested, but the long-crested wave envelope dynamics have been employed to explain the presence of wave groups, particularly in association with the generation mechanism of freak or rogue waves [5–7], somewhat disregarding the nature of the short-crested wind-wave field. As such, the key to understand the ocean waves, especially in the context of extremes, is to show the presence of coherent two-dimensional wave groups. A recent study by Chabchoub et al. [8] employed an innovative scheme of transforming the 2D+T NLSE into a 1D+pseudo time NLSE and vice-versa thus, allowing the application of a known solution of the long-crested (1D+T) NLSE to model a short-crested two-dimensional wave group. As a result, an oblique wave group, oriented at an angle to the propagation direction, is formed, as suggested in the theoretical study [9]. This theoretical conjecture of this short-crested wave field has been proven in an experiment in a directional wave tank [10].
However, up to now, the evidence of a coherent two-dimensional wave group in the ocean is missing. Stereo imaging of ocean waves is a promising and proven technology to capture a three-dimensional wave field [11]. The limitation is that it can only capture an area covering a few wavelengths. A new data assimilation scheme called SWEAD (Surface Wave reconstruction by Ensemble Adjoint-free Data assimilation) has been recently proposed to combine the stereo images with the phase-resolving non-linear wave model to extrapolate the surface elevation reconstructed from stereo images [12]. The validity of the scheme was demonstrated by a twin-experiment using the Higher-Order Spectral Method which is now becoming a standard tool to evaluate the phase-resolved processes based on the spectral wave model output [13–19]. HOSM is also exploited in data assimilation for RADAR observation [20, 21]. Unlike these studies that assimilates observations of the same size as the model, SWEAD incorporates observation matrix to handle observed data considerably smaller in size than the number of HOSM grids.
This paper reports the first successful implementation of the SWEAD [12] to reconstruct a wave field, which analyzes the stereo reconstructed wave field and extends the estimated wave field to an area 900 times larger (30 by 30) than the observation. By a careful look at the reconstructed wave field, a coherent wave group whose envelope is oriented obliquely to the wave propagation direction was discovered and was shown to resemble the directional soliton [8]. The ocean tower observation by the stereo camera and the data assimilation scheme is introduced in section Observation and data assimilation. The reconstructed wave field and the identified wave group therein are presented in section Observation of Coherent Wave Group. The comparison to the analytical solution and the linear wave field are discussed in section Discussion. Conclusion follows.
Observation and Data Assimilation
Hiratsuka Tower Observation
An observation by stereo camera system was conducted at the Hiratsuka Oceanographic Experiment Station of the University of Tokyo located at the depth of 20 m, 1 km south of the Hiratsuka beach in the north of the Sagami-Bay in Japan (35.305467°N, 139.345815°E). A stereo camera system (3.92 m apart) pointing southwest is in operation since April 2017. The camera at 16 m altitude is pointing down imaging a trapezoidal area of height around 80 m (Figure 1 left). The surface elevation was reconstructed using WASS (Waves Acquisition Stereo System) [22]. Validation of the stereo reconstructed wave field was made during a field campaign from Sep. 1 to Oct. 2, 2018 employing four different types of wave sensors (ultrasound wave gauge at the tower, two wave-riders outside of the stereo imaging region, and bottom-mounted ADCP within the stereo imaging region) [23]. The details of the stereo imaging system and the stereo reconstruction are reported therein and will be omitted from this paper.
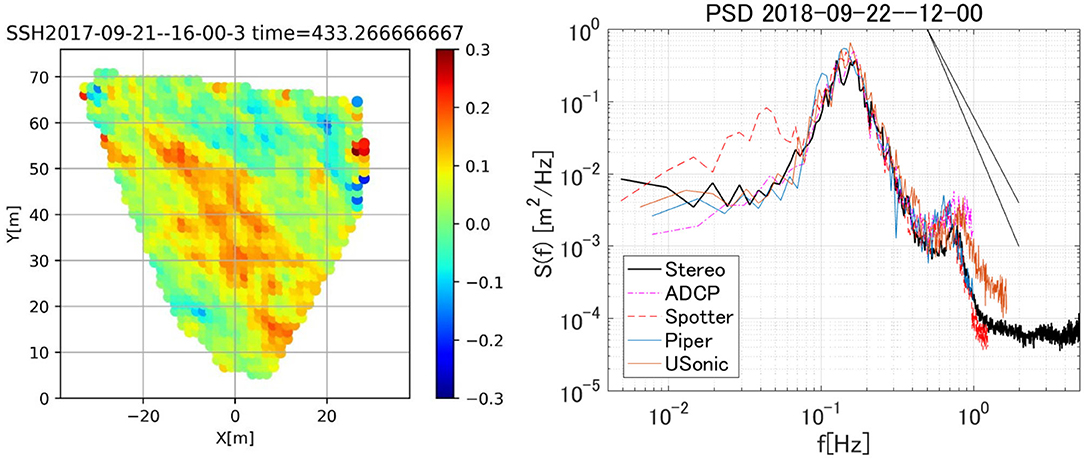
Figure 1. (left) Example of the snapshot of the stereo reconstructed wave field. Note the camera is pointing southeast; (right) Wave spectra from the Stereo camera system (black), bottom-mounted ADCP (magenta), wave rider (Spotter, red), wave rider (Piper, blue), and Ultrasonic at the Hiratsuka tower (orange). The straight solid lines indicate the f−4 and f−5 slopes. The sampling rates of stereo camera system, ADCP, Spotter, Piper, and Ultrasonic wave gauges are, 10.0, 2.0, 2.5, 2.0, 3.0 Hz, respectively. The averaged periodograms were obtained with the degrees of freedom ranging between 12 and 18.
The typical wave condition at the Hiratsuka tower is a swell system from the south. The wind-sea tends to be large for southerly wind with unlimited fetch whereas, for northerly wind, the wind-sea tends to be smaller due to limited fetch and the wave system tends to be mixed with swells propagating from the south. On Sep. 22, a swell of significant wave height ~0.6 m and peak wave period ~6.8 s (or ~70 m wavelength) propagated from the south (Figure 1 right). The wind-sea generated by the 8.1 m/s NNE wind was propagating against the swell. A small spectral peak may represent the wind-sea, but its energy was quite low. The spectra from the five sensors agree well-considering that they are not necessarily collocated. The spectrum from the ADCP measurement (magenta) appears closest to the stereo camera-based spectrum (black) as they are collocated. Sample time-series from the ADCP and the stereo camera are compared (Figure 2). The phases seem to match quite well but some peak values seem to deviate. This particular case was chosen for further analysis as the stereo camera images were intact.

Figure 2. Time series comparison of the surface elevation of the collocated ADCP (blue) and the stereo-reconstruction (red).
Surface Wave Reconstruction by Ensemble Adjoint-Free Data Assimilation (SWEAD)
Surface Wave reconstruction by Ensemble Adjoint-free Data assimilation (SWEAD) was applied to the stereo images of Sep. 22, 2018. A 300 s image sequence was selected from the 20-min record and was assimilated into the phase resolving wave model. SWEAD is a scheme to reconstruct a surface wave field by assimilating observational data to a phase-resolved non-linear wave model HOSM (Higher-Order Spectral Method) [12, 24]. An efficient data assimilation scheme called the adjoint-free data assimilation (a4DVar) [25] was extended to a free surface water wave problem. The HOSM is a flexible solver of the free surface water wave in a periodic domain that can vary the order of non-linearity. As aforementioned, the method is widely used and documented; the details of the HOSM is omitted. In this study, the non-linear order of HOSM M = 3 was chosen such that the four-wave resonant interactions are incorporated.
The procedure of SWEAD is summarized here. The aim is to find the initial phases of the Fourier coefficients of the surface elevation whose modulus is given a priori by the directional spectra from the stereo reconstruction. Hereafter, is represented as x0 denoting the initial condition. The cost function J (x0)
is minimized wisely circumventing the use of an adjoint model to estimate its gradient. Here, H (x0) is the model-data projection operator, y is the observational data from the stereo images, and R is the observation error covariance. Under the framework of Gaussian statistics, the error statistics of the initial condition x0 is represented by the background error covariance matrix B. The gradient of the cost function is approximated as:
where the adjoint of the Jacobian matrix H is approximated by the perturbed ensemble model run outputs: PTHT ≈ δYT, where P contains the orthogonal perturbation vectors and δY the associated model increments. Further simplification is made by updating the control variable as x0+Ps where the weighting function is determined solving equation (3) at each iteration:
Further improvement of the a4DVar made the method more stable. We took advantage of the spectral constraint and imposed a secant condition. Various parameters were carefully determined before the actual implementation of SWEAD. The details of these procedures are given in [12, 24].
From the stereo image analysis, the error covariance matrix R was estimated as where σii represents the standard deviation of the stereo image estimates within a 1.5 m by 1.5 m grid, and nii is the number of samples per grid. Note that the data assimilation was made for the mean value of the surface elevation of each 1.5 m by 1.5 m grid.
The domain size of HOSM used in this study is 2.6426 km by 2.6426 km, with 1,024 times 1,024 grid points. The integration time step is 0.1 s and the integration period is 350 s following the non-linear spin-up of 50 s. For the case introduced in section Hiratsuka Tower Observation, the peak wave period of 6.8 s, the domain size corresponds to about 40 wavelengths, and the integration period to 50 wave periods. The HOSM wave field was initialized based on the spectrum from the stereo images with random phases, and the initial phases were determined conducting 400 perturbed ensemble runs that were repeated for 19 iterations minimizing the cost function [23, 26]. The magnitude of the first term of the cost function (1) reduced by 1/7 after eight iterations and slowly reduced to about 1/10 in nineteen iterations. With the large number of ensemble members (400), one iteration took about three and half hour wall clock time using the Oakforest-PACS Supercomputer System of the University of Tokyo using 12 nodes (one node has 68 cores). The domain size (1,024 by 1,024 and 40 wavelengths square) and the number of ensemble members (400) were determined based on the original study by Fujimoto [24] in balance of the predictable region and the computational efficiency.
Observation of Coherent Wave Group
Initial Wave Field and Reconstructed Waves
Based on the directional spectrum from the stereo imaging system (Figure 3 left), the initial wavefield η0(x,y) was estimated using SWEAD (Figure 3, right panel). The wave field in Figure 3 right is mapped south-up and the dominant wave is propagating from the southwest. The directional spectrum was estimated by discrete Fourier transformation of the reconstructed wave field and was averaged over the entire 20-min image sequence. Because the directional spectrum was estimated from an area of 80 m square, waves longer than the domain size tended to be ambiguous in direction and therefore a high-pass filter was applied at 0.1 Hz. Spectral density <5 % of the peak spectral density was removed as well. Nevertheless, the directional spectrum tended to be broad in direction, and therefore, the waves tended to propagate into the stereo imaging area from all the directions. Those spurious waves appear in the initial wave field as a circular pattern. The dominant wave components are propagating from the southwest or the upper right quadrant of Figure 3 right. It is also noticeable that there is not much energy downstream (northeast, or the lower left quadrant). This is because for the 300 s stereo reconstructed image sequence, the predictable zone [27] is restricted to a circular sector (enclosed by cyan lines in Figure 3 right) extending to the southwest from the stereo imaging region. The waves in this area will focus on the stereo imaging domain and well-reproduced the wave record (Figure 4). The predictable zone was estimated for wave components with a spectral density higher than 30 % of the peak spectral density, thereby neglecting the waves coming from the opposite direction to the dominant swell. The SWEAD is not restricted to analyzing a uni-directional spectrum.
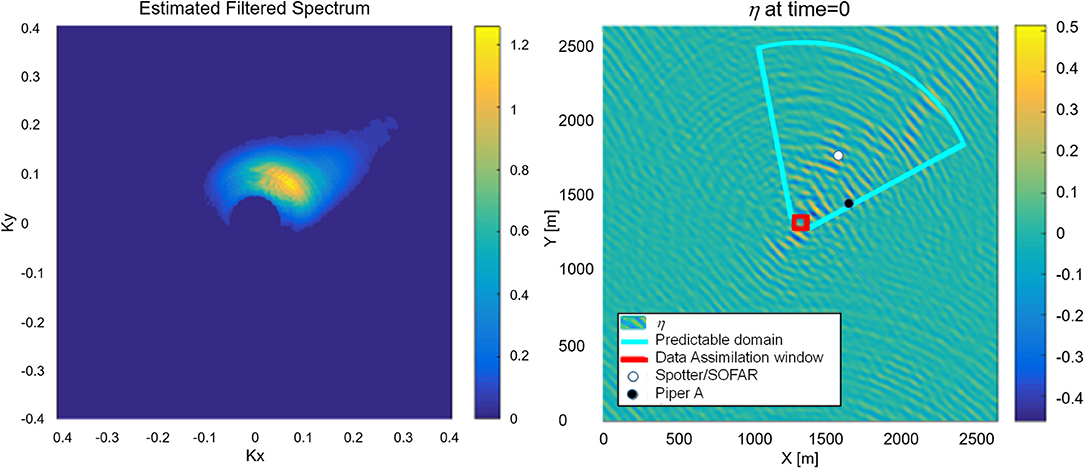
Figure 3. (left) Directional spectrum estimated from the 20-min stereo image sequence. The wave numbers kx and ky are oriented along the image coordinate. A high-pass filter with cutoff frequency of 0.1 Hz was applied. Spectral density <5 % of the peak spectral density was removed as well. (right) Initial condition of the analysis wave field by SWEAD. The red box indicates where the stereo images were taken. The markers represent the locations of the surface wave buoys. The predictable zone for the 300 s image sequence is indicated by cyan line.
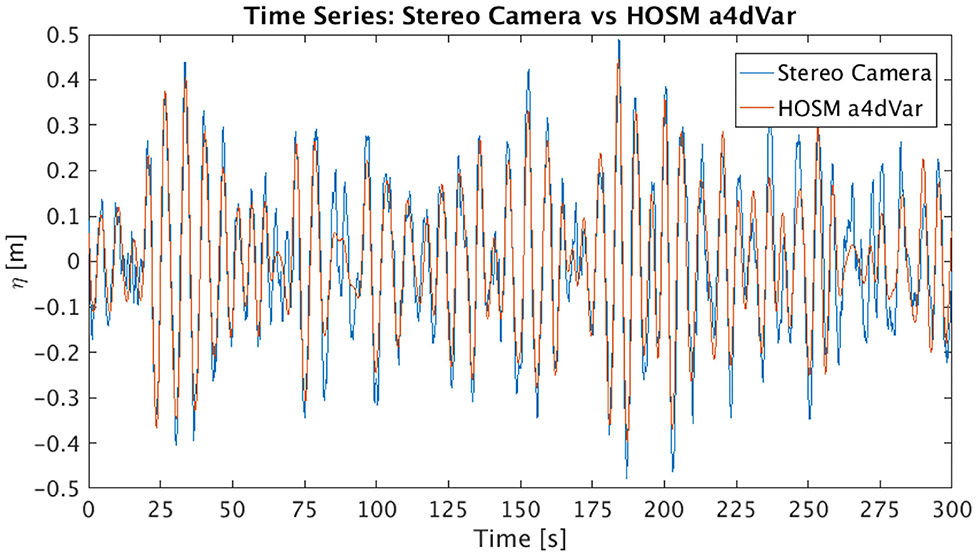
Figure 4. Comparison of the surface elevation time series in the middle of the stereo imaging area; the blue line is from the stereo camera, and the red line is the reconstructed time series by SWEAD.
Reconstructed Directional Wave Group
From the 300 s reconstructed wave field, we have looked into the wave field upstream of the stereo imaging area within the predictable zone (Figure 3 right). At first sight, it appears that the waves tend to form a beam where the energy is confined to a finite crest length. This is partly because SWEAD does not impose a constraint of the homogeneity of the wave energy and therefore the waves are absent from the area outside of the predictable zone. However, it is plausible that non-linearity is acting against the dispersion and thereby retaining the short crestedness of the wave train.
Notable evolution of the group-like feature was detected (Figure 5). The image coordinate is rotated clockwise by about 40 degrees from the original (Figure 3) such that the wave group is propagating from right to left. The crest line is confined in the transverse direction, and the boundary seems inclined against the propagation. The directional wave group seems coherent throughout the sequence of about 60 s shown in Figure 5. The animation of the evolving wave field is provided as Supplementary Material.

Figure 5. Surface elevation contour map of the subdomain of the HOS simulation capturing a wave group. The domain covers 500 m by 500 m area, and is rotated so that the waves propagate from right to left toward the stereo imaging area. The time sequence is from left to right at 30 s interval.
The propagation of the detected wave group is visualized by a waterfall diagram of the wave profile along a diagonal line connecting (1,300 m, 1,300 m) and (1,700 m, 1,700 m) in Figure 3 for 80 s (Figure 6). The propagation of a coherent wave group is evident. The estimated propagation speed of the wave group is about 4.6 m/s which corresponds to a 5.9 s wave period. The estimated wave period roughly corresponds to the dominant wave in the observed spectrum (Figure 1). Unlike the directional soliton studied in Chabchoub et al. [8], the observed wave group is confined in the propagation direction as well. Long-crested envelope solitons are known to be unstable to transverse perturbation (e.g., [28]). The reconstructed wave field indicated a possible existence of a coherent directional wave group confined in both propagating and transverse directions. From the reconstructed wave field, the peak amplitude of the wave group is estimated to be around 0.5–0.6 m which corresponds to a local steepness of A0k0~0.06.
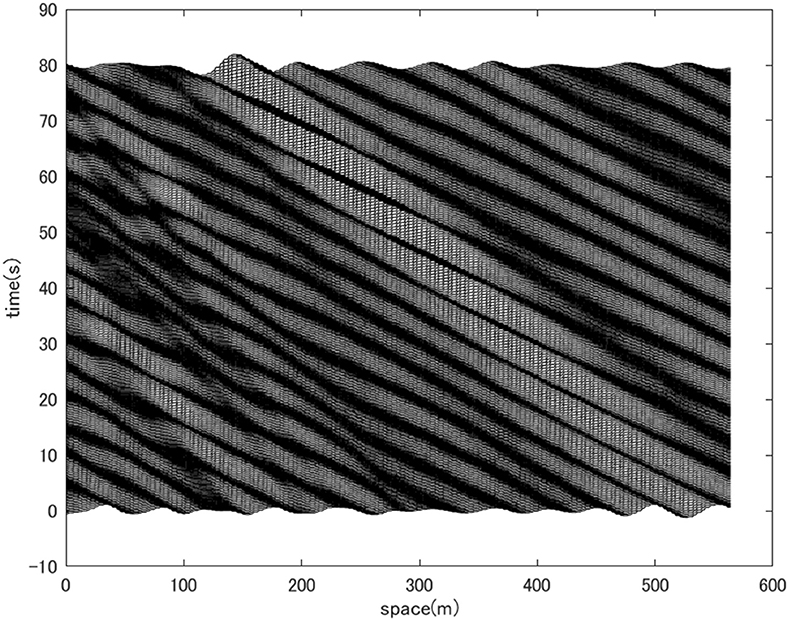
Figure 6. Waterfall plots of the surface elevation profiles along a diagonal line in the wave field depicted in Figure 3. The line connects (1,300 m, 1,300 m) and (1,700 m, 1,700 m) and the plot is made for 80 s long. A coherent wave group is observed.
Discussion
Directional Coherent Wave Group
The theoretical framework of the directional wave group follows Chabchoub et al. [8]. By applying a coordinate transformation, , the 2D+T NLSE reduces to a 1D+T NLSE in which stable planar wave solutions exist. Then, interestingly enough, in the original coordinate, the solution appears to have a slanted envelope and the wave train becomes short-crested. The observed directional wave group somewhat resembles the directional soliton reproduced in a directional wave tank, which is parametrized as:
The surface elevation field given by η (x,y,t) = Re [A(x,y,t) exp {i(k0x + ω0t)}] is shown as an example in Figure 7 for the case of θ=−π/6. Note that the angle θ should not exceed 35.26° for the framework to be applied. The carrier wave is propagating from right to left and is short-crested in the transverse direction. However, the slanted envelope is unbounded.
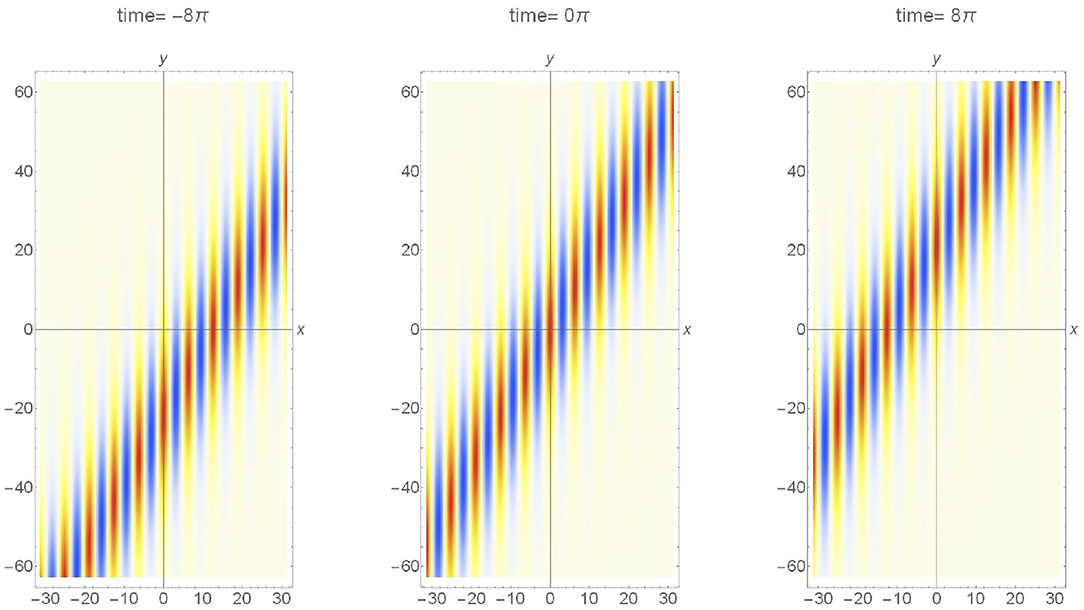
Figure 7. Surface elevation map of the directional soliton [4] with obliqueness and the steepness A0k0 = 0.05. The time sequence is from left to right at four-wave period interval. The wave is propagating from right to left.
The envelope of the SWEAD reconstructed directional wave group was truncated in the propagating direction as well. Mimicking the reconstructed wave field, the truncation of the wave envelope was artificially introduced to the directional soliton solution equation (4):
The W(x,t) is an arbitrary function that reduces the wave energy to nil in the far-field. Here, we have chosen a triangular envelope containing n waves. The surface elevation wavefield for n=5, is shown in Figure 8, . The wavefield remarkably resembles that reconstructed from the stereo images (Figure 5). Since Atrunc. (x,y,t) is not a known solution of the 2D+T NLSE, in reality, its coherence due to the balance of non-linearity and dispersion remains to be tested. Nevertheless, we will show in section Comparison Against the Linear Model, that the non-linearity was crucial in sustaining the coherence of the reconstructed directional wave group.
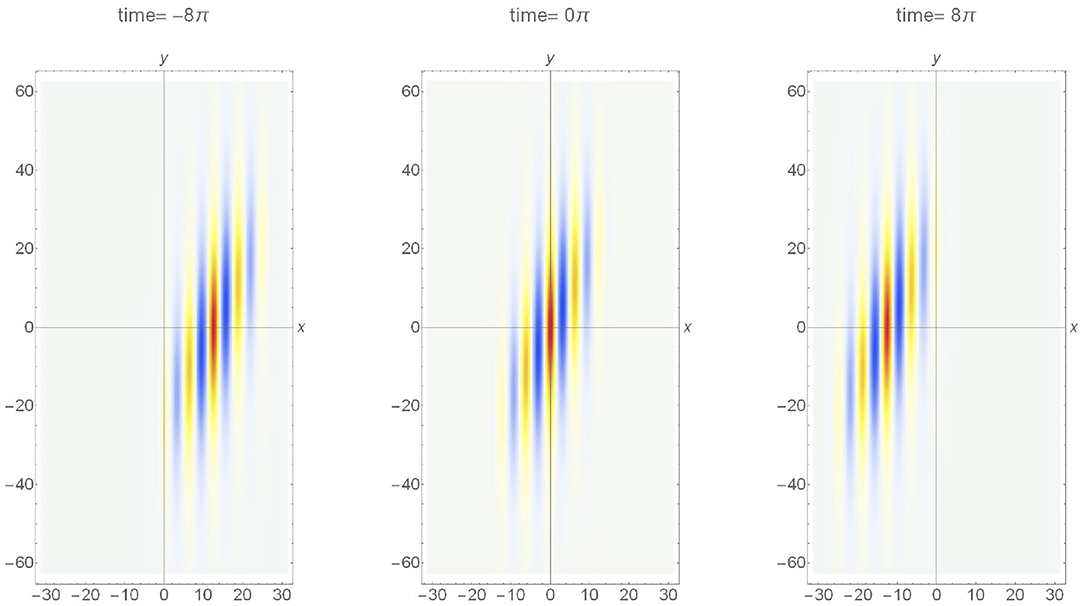
Figure 8. A truncated directional soliton [5]. The number of waves in a group n = 5. Nomenclature is the same as Figure 7.
The directional soliton choice may be considered as too simplistic compared to other more advanced nonlinear envelope models. Examples are breathers on finite background, such as the Kuznetsov-Ma, Akhmediev or Peregrine breathers [4, 29, 30]. Given the domain limits and the absence of distinct wave focusing, we selected the envelope soliton as a reference being the fundamental stationary coherent structure allowing the nonlinear interaction with the underlying waves. Nevertheless, there is no reason not to observe how a truncated breather would look like. By applying the same coordinate transformation to the Akhmediev breather solution [29], we obtain the following expression of the diagonal breather:
where, , , , and representing the spectral bandwidth. Following the same steps as before, we show in Figure 9 the surface elevation of the truncated wave train, . We chose a small value of δ=0.0001, such that the solution approaches the Peregrine breather [30]. The resemblance of the directional Akhmediev breather to the directional soliton is striking. Although the resemblance of oblique Akhmediev/Peregrine breather, at its peak modulation, and the stationary envelope soliton is known, the implication of that to this study is noteworthy. Despite the wave field was extended to cover a large domain compared to the stereo imaging area, the domain is still not large enough to capture the full evolution of the wave group, particularly the initial disintegration of a wave train, known as the Benjamin-Feir instability [31].
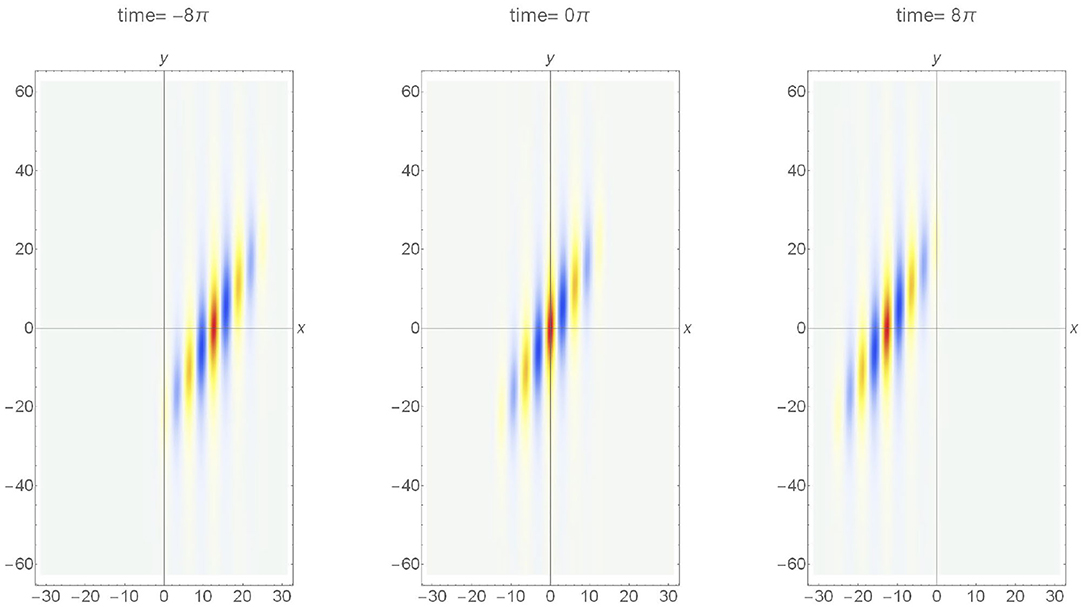
Figure 9. A truncated directional Akhmediev Breather [6]. The number of waves in a group n = 5. Nomenclature is the same as Figure 7.
Comparison Against the Linear Model
The HOSM wave field constrained by the stereo images revealed the existence of a wave group whose envelope is oblique to the propagation direction. Moreover, the analytical model of the directional envelope soliton with an artificial truncation in the propagating direction resembled the reconstructed wave group. Although this truncated directional soliton is not a known analytical solution to the 2D+T NLSE, the reconstructed wave field is a numerical solution that incorporates the third-order non-linearity and is not restricted by spectral bandwidth. To confirm that such a coherent wave field exists because of the weak non-linearity, the SWEAD was applied to the linear wave model or the HOSM simulation with M = 1. Note that by assimilating the stereo images, the initial condition of the linear HOSM is constrained such that the wavefield within the stereo imaging region is optimally reconstructed. What we will investigate here, however, is the difference between non-linear and linear wave models of the wave fields outside of the stereo imaging region but within the predictable region. In Figure 10, the evolution of the wavefield along a line connecting (1,300 m, 1,300 m) and (1,700 m, 1,700 m) of the simulated domain is shown. The coherent nature of the wave group that was found in the case of the HOSM M = 3 simulation has diminished with HOSM M = 1 despite the two solutions being strongly constrained by the same directional spectrum (Figure 3 left).
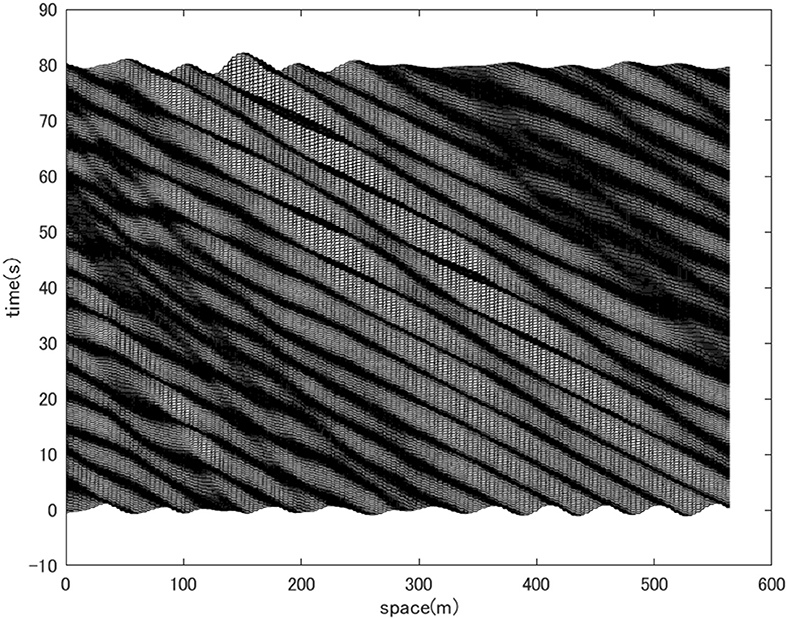
Figure 10. Waterfall plots of the surface elevation profiles from an assimilated linear wave model. The wave profile is obtained along a diagonal line in the wave field depicted in Figure 3. The line connects (1,300 m, 1,300 m) and (1,700 m, 1,700 m) and the plot is made for 80 s long. Coherent wave group is not observed.
The degree of coherence of the wave evolution becomes apparent comparing the wave fields of the entire HOSM model domain. The normalized maximum wave amplitudes are plotted in Figure 11 for the HOSM M = 3 simulation (left) and the HOSM M = 1 simulation (right). While the reconstructed non-linear wave field (Figure 11 left) shows a beam that extends upstream and downstream of the stereo imaging region where the energy is concentrated, the reconstructed linear wave field (Figure 11 right) shows that the energy spreads in a broader domain. In the linear model, there are multiple beams and the energy seems to focus on the central part. If the wave groups remain coherent, it is expected that the maximum surface elevation will be homogeneous. Therefore, the high contrast of the maximum surface elevation, as seen in the linear case, implies that wave groups are not as coherent as in the non-linear case. The beam tends to weaken away from the center, and this is an artifact of the data assimilation scheme in which the predictable zone broadens away from the center. Overall, the comparison indicates that in the HOSM M = 1 simulation, the wave field linearly focused in the central part to reproduce the observed wave field, but coherence is less prominent than the HOSM M = 3 simulation. This observation is consistent with that comparing Figures 6, 10.
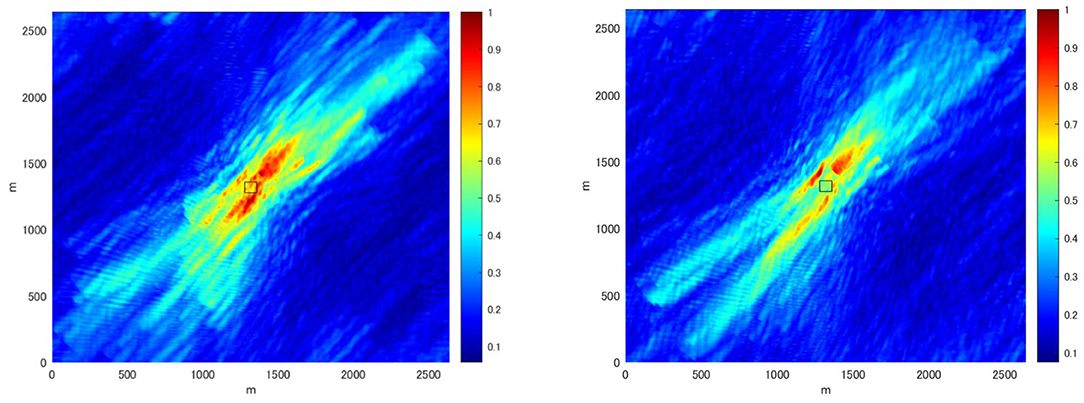
Figure 11. The normalized maximum value of the surface elevation of the 300 s HOSM simulation is shown for the entire model domain (2.6426 km by 2.6426 km); in the left, non-linear (M = 3), and in right, linear (M = 1). The color map limit is from 0 to 1.0. The coherence of the wave group is depicted by the homogeneity of the maximum surface elevation along the beam. The square at the center denotes the stereo imaging area. The directional wave group was observed along 1,300 m to 1,700 m in both horizontal and vertical axes.
Conclusion
A wave field was successfully reconstructed assimilating the stereo image sequence into a non-linear phase resolving wave model. From the reconstructed wave field, a coherent wave group was identified in which the two-dimensional wave envelope is not in alignment with the propagation direction of the carrier wave. The striking resemblance of the reconstructed directional wave group to the recently discovered directional soliton is encouraging.
The work certainly needs further improvement. Likely, the imaging area of 80 m by 80 m is not sufficient to reconstruct the wave field of the entire 2.6 km by 2.6 km model domain as the predictable region is limited by the time window of 300 s. As such, the reconstructed wave field tended to focus the energy into the stereo imaging area such that the wave field is well-reproduced within the given time window. This tendency was even more exaggerated when the linear HOSM model was used.
Nevertheless, the comparison of the non-linear and linear reconstructed wave fields elucidated the significance of the non-linearity in maintaining the coherence of the directional wave group. The kinematic properties of the wave group are realistic, with the steepness around A0k0~0.06, and contains around 5 waves in a group. This is the first time such two-dimensional coherent wave groups were identified in the ocean. The scheme of combining spatial images and non-linear wave models is promising and should be advanced by utilizing spatially wide observations such as shipborne radar images.
We were able to observe a striking similarity between the reconstructed ocean wave group with oblique NLS-type envelopes. Indeed, a truncation of the water surface elevation as modeled with an oblique form of both, envelope soliton and Akhmediev/Peregrine-type breather, by adopting the respective oblique angle, show an excellent agreement with the shape of the coherent structure in the ocean. The domain limitations were obviously a major constraint in this study for the purpose of identification of the right coherent envelope. Moreover, it was not possible to clearly identify the Benjamin-Feir instability process [31], which is a possible mechanism for the formation of ocean extreme events [7]. Nevertheless, our findings pave the way for possible soliton or breather-type rogue wave identification in the ocean [29, 32, 33]. We consequently believe that there is strong potential for observations of such pulsating envelopes in the ocean and to connect these to ocean rogue wave formations in the future.
Data Availability Statement
The original contributions presented in this study are included in the article/Supplementary Material, further inquiries can be directed to the corresponding author.
Author Contributions
TW, AC, and WF designed research. SW, TK, TN, AC, and TW performed research. WF, SW, TN, TK, and TW contributed new reagents and analytic tools. SW and TW analyzed data. TW, SW, TK, TN, AC, and WF wrote the paper. All authors contributed to the article and approved the submitted version.
Funding
TW acknowledges support from the Japan Society for the Promotion of Science KAKENHI [Grant-in-Aid for Scientific Research (A)] Grant Numbers 19H00801, 16H02429, and 25249126.
Conflict of Interest
The authors declare that the research was conducted in the absence of any commercial or financial relationships that could be construed as a potential conflict of interest.
The reviewer GD declared a past co-authorship with one of the authors AC to the handling editor.
Acknowledgments
Acknowledgment goes to Miguel Onorato for his insightful suggestion in the solution parametrization in the 2D+T NLSE which led us to the experimental discovery the directional soliton solution.
Supplementary Material
The Supplementary Material for this article can be found online at: https://www.frontiersin.org/articles/10.3389/fphy.2021.622303/full#supplementary-material
Supplementary Video 1. Animation of the SWEAD reconstructed wave field featuring the propagation of directional wave group is provided as an AVI video.
References
1. Sedivy DG, Thompson WC. Ocean Wave Group Analysis (No.NPS-68SETH78091). Monterey: Naval Postgraduate School Monterey Calif (1978). doi: 10.5962/bhl.title.61498
2. Donelan M, Longuet-Higgins MS, Turner JS. Periodicity in whitecaps. Nature. (1972) 239:449. doi: 10.1038/239449a0
3. Akhmediev N, Soto-Crespo JM, Ankiewicz A. Extreme waves that appear from nowhere: on the nature of rogue waves. Phys Lett A. (2009) 373:2137–45. doi: 10.1016/j.physleta.2009.04.023
4. Chabchoub A, Onorato M, Akhmediev N. Hydrodynamic envelope solitons and breathers. In: Rogue and Shock Waves in Nonlinear Dispersive Media. Cham: Springer (2016). p. 55–87. doi: 10.1007/978-3-319-39214-1_3
5. Onorato M, Resitori S, Baronio F, editors. Rogue and Shock Waves in Nonlinear Dispersive Media (Vol. 926). Hidelberg: Springer (2016). doi: 10.1007/978-3-319-39214-1
6. Dudley JM, Genty G, Dias F, Kibler B, Akhmediev N. Modulation instability, Akhmediev Breathers and continuous wave supercontinuum generation. Opt Express. (2019) 17:21497–508. doi: 10.1364/OE.17.021497
7. Dudley JM, Genty G, Mussot A, Chabchoub A, Dias F. Rogue waves and analogies in optics and oceanography. Nat Rev Phys. (2019) 1:675–89. doi: 10.1038/s42254-019-0100-0
8. Chabchoub A, Mozumi K, Hoffmann N, Babanin AV, Toffoli A, Steer JN, et al. Directional soliton and breather beams. Proc Natl Acad Sci. (2019) 116:9759–63. doi: 10.1073/pnas.1821970116
9. Saffman PG, Yuen HC. Stability of a plane soliton to infinitesimal two-dimensional perturbations. Phys Fluids. (1978) 21:1450–1. doi: 10.1063/1.862364
10. Mozumi K, Waseda T, Chabchoub A. 3D stereo imaging of abnormal waves in a wave basin. In: International Conference on Offshore Mechanics and Arctic Engineering, Vol. 56499. St. John's, CA: American Society of Mechanical Engineers (2015). doi: 10.1115/OMAE2015-42318
11. Benetazzo A, Barbariol F, Bergamasco F, Torsello A, Carniel S, Sclavo M. Observation of extreme sea waves in a space–time ensemble. J Phys Oceanogr. (2015) 45:2261–75. doi: 10.1175/JPO-D-15-0017.1
12. Fujimoto W, Waseda T. Ensemble-based variational method for nonlinear inversion of surface gravity waves. J Atmos Ocean Technol. (2020) 37:17–31. doi: 10.1175/JTECH-D-19-0072.1
13. West BJ, Brueckner KA, Janda RS, Milder DM, Milton RL. A new numerical method for surface hydrodynamics. J Geophys Res. (1987) 92:11803–24. doi: 10.1029/JC092iC11p11803
14. Toffoli A, Bitner-Gregersen E, Onorato M, Babanin AV. Wave crest and trough distributions in a broad-banded directional wave field. Ocean Eng. (2008) 35:1784–92. doi: 10.1016/j.oceaneng.2008.08.010
15. Bitner-Gregersen EM, Fernandez L, Lefèvre JM, Monbaliu J, Toffoli A. The North Sea Andrea storm and numerical simulations. Nat Hazard Earth Syst Sci. (2014) 14:1407–15. doi: 10.5194/nhess-14-1407-2014
16. Dias F, Brennan J, de León SP, Clancy C, Dudley J. Local analysis of wave fields produced from hind casted rogue wave sea states. In: ASME 2015 34th International Conference on Ocean, Offshore and Arctic Engineering. St. John's, CA: American Society of Mechanical Engineers (2015).
17. Trulsen K, Borge JCN, Gramstad O, Aouf L, Lefèvre JM. Crossing sea state and rogue wave probability during the Prestige accident. J Geophys Res. (2015) 120:7113–36. doi: 10.1002/2015JC011161
18. Fedele F, Brennan J, De León SP, Dudley J, Dias F. Real world ocean rogue waves explained without the modulational instability. Sci Rep. (2016) 6:27715. doi: 10.1038/srep27715
19. Fujimoto W, Waseda T, Webb A. Impact of the four-wave quasi-resonance on freak wave shapes in the ocean. Ocean Dyn. (2019) 69:101–21. doi: 10.1007/s10236-018-1234-9
20. Yoon S, Kim J, Choi W. An explicit data assimilation scheme for a nonlinear wave prediction model based on a pseudo-spectral method. IEEE J Ocean Eng. (2015) 41:112–22. doi: 10.1109/JOE.2015.2406471
21. Köllisch N, Behrendt J, Klein M, Hoffmann N. Nonlinear real time prediction of ocean surface waves. Ocean Eng. (2018) 157:387–400. doi: 10.1016/j.oceaneng.2018.03.048
22. Bergamasco F, Torsello A, Sclavo M, Barbariol F, Benetazzo A. WASS: an open-source pipeline for 3D stereo reconstruction of ocean waves. Comput Geosci. (2017) 107:28–36. doi: 10.1016/j.cageo.2017.07.001
23. Watanabe S, Fujimoto W, Nose T, Kodaira T, Davies G, Lechner D, et al. Data assimilation of the stereo reconstructed wave fields to a nonlinear phase resolved wave model. In: International Conference on Offshore Mechanics and Arctic Engineering. Glasgow: American Society of Mechanical Engineers (2019). doi: 10.1115/OMAE2019-95949
24. Fujimoto W. The reproduction of freak waves by nonlinear numerical simulation (Ph.D. Dissertation). Graduate School of Frontier Sciences, Environmental Studies Division, the University of Tokyo, Kashiwa, Japan (2017).
25. Yaremchuk M, Martin P, Koch A, Beattie C. Comparison of the adjoint and adjoint-free 4dVar assimilation of the hydrographic and velocity observations in the Adriatic Sea. Ocean Model. (2016) 97:129–40. doi: 10.1016/j.ocemod.2015.10.010
26. Watanabe S. 3D reconstruction of water waves by stereo imaging (Master's Thesis). Graduate School of Frontier Sciences, Environmental Studies Division, the University of Tokyo, Kashiwa, Japan (2018).
27. Qi Y, Wu G, Liu Y, Yue D. Predictable zone for phase-resolved reconstruction and forecast of irregular waves. Wave Motion. (2018) 77:195–213. doi: 10.1016/j.wavemoti.2017.12.001
28. Yajima N. Stability of envelope soliton. Prog Theor Phys. (1974) 52:1066–7. doi: 10.1143/PTP.52.1066
29. Akhmediev NN, Ankiewicz A. Solitons: Nonlinear Pulses and Beams. London: Chapman and Hall (1997).
30. Peregrine DH. Water waves, nonlinear Schrödinger equations and their solutions. ANZIAM J. (1983) 25:16–43. doi: 10.1017/S0334270000003891
31. Benjamin TB, Feir JE. The disintegration of wave trains on deep water Part 1. Theory. J Fluid Mech. (1967) 27:417–30. doi: 10.1017/S002211206700045X
32. Herbst BM, Ablowitz MJ. Numerically induced chaos in the nonlinear Schrödinger equation. Phys Rev Lett. (1989) 62:2065. doi: 10.1103/PhysRevLett.62.2065
Keywords: ocean waves, wave groups, observational tower, stereo imaging, higher-order spectral method, data assimilation, non-linear Schrödinger equation, directional envelope soliton
Citation: Waseda T, Watanabe S, Fujimoto W, Nose T, Kodaira T and Chabchoub A (2021) Directional Coherent Wave Group From an Assimilated Non-linear Wavefield. Front. Phys. 9:622303. doi: 10.3389/fphy.2021.622303
Received: 28 October 2020; Accepted: 24 February 2021;
Published: 13 April 2021.
Edited by:
Xinping Zhang, Beijing University of Technology, ChinaReviewed by:
Alfred R. Osborne, Non-linear Waves Research Corporation, United StatesFilippo Bergamasco, Ca' Foscari University of Venice, Italy
Guillaume Ducrozet, Ecole Centrale de Nantes, France
Copyright © 2021 Waseda, Watanabe, Fujimoto, Nose, Kodaira and Chabchoub. This is an open-access article distributed under the terms of the Creative Commons Attribution License (CC BY). The use, distribution or reproduction in other forums is permitted, provided the original author(s) and the copyright owner(s) are credited and that the original publication in this journal is cited, in accordance with accepted academic practice. No use, distribution or reproduction is permitted which does not comply with these terms.
*Correspondence: Takuji Waseda, d2FzZWRhQGsudS10b2t5by5hYy5qcA==
 Takuji Waseda
 Shogo Watanabe1
 Wataru Fujimoto
 Takehiko Nose
 Tsubasa Kodaira
 Amin Chabchoub