 Jiaang Ge
 Junwei Xie1
94% of researchers rate our articles as excellent or good
Learn more about the work of our research integrity team to safeguard the quality of each article we publish.
Find out more
ORIGINAL RESEARCH article
Front. Phys. , 28 June 2021
Sec. Radiation Detectors and Imaging
Volume 9 - 2021 | https://doi.org/10.3389/fphy.2021.598047
This article is part of the Research Topic Electronics and Signal Processing View all 20 articles
With the emergence and development of the passive localization, the radiation source is more visible for the location system which endangers their survival. Therefore, there is an urgent demand for the radio frequency (RF) stealth technology. An effective method to realize RF stealth is location deception, therefore, for the passive localization system, this paper proposes a direction of arrival (DOA) location deception method using the frequency diverse array (FDA) against the dual baseline phase interferometer. Since the direction-finding of the dual baseline phase interferometer is based on the received signal with fixed frequency, the FDA signal has a deception effect on the interferometer owing to the introduction of the small frequency increment. Considering the influence of the frequency increment sequence on the deception effect, we derive the optimizations of the DOA location deception via the average location deviation for the sampling time in the case of no noise and noise, respectively. Besides, considering the time dependency of the beam, we investigate the average SNR (ASNR) and the corresponding CRLB to verify the proposed method. Numerical examples and simulations show that the proposed method can counter the interferometer by realizing location deception.
In modern warfare, the concealment of reconnaissance equipment is very important. By achieving target localization without initiative emission of electromagnetic waves, the passive localization technology brings new ideas to traditional localization methods. Passive localization technology mainly uses the radiation source signals to extract parameters, and then uses these parameters to estimate the location of the radiation source, the main extracted parameters are: angle-of-arrival (AOA) [1], time-of-arrival (TOA) [2], time difference of arrival (TDOA) [3], frequency difference of arrival (FDOA) [4], received signal strength (RSS) [5], and phase difference [6]. However, with the emergence of the passive localization system, the radiation source was more visible for the location system, which might lead to the exposure of the true location of the radar and communication systems, and even endangered their survival. Therefore, the countermeasure technology needed to be developed.
Frequency diverse array (FDA) [7] is considered a feasible array countermeasure technology. As we know, in the far-field, the beam pattern of the FDA is range-angle-time-dependent owing to the introduction of the frequency increment [8, 9], however, the beam pattern of the traditional phased array is only angle-dependent, and therefore, the FDA increases the degree of freedom of range relative to the phased array. FDA thus attracted considerable attention in recent years since its range-dependent beam pattern. The current researches of the FDA mainly focus on decoupled range-angle beam forming [10–13], joint angle-range estimation [14–17], deceptive jamming, and range-dependent clutter suppression [18–23], receiver design [24–26], and the application in the communications [27]. However, most of the research above considered the case of the instantaneous time to ignore the time-variance property in the FDA beam pattern, but as we know, FDA’s work is a continuous process, and its time parameters cannot be fixed in the actual work process. Therefore, several papers have studied the influence of FDA beam time-varying and its suppression methods [28–34]. However, for FDA, the effect of the introduction of frequency increment on time and range are related, and the suppression of the time-varying characteristic will also affect the range-dependent characteristic of the FDA beam pattern. Therefore, the beam time-varying problem of the FDA has not been well solved, which seriously restricts the development of the FDA.
When turning to the countermeasures based on the FDA, the current research mainly focuses on two parts: 1) Low interception probability (LPI) transmit beamforming. Using different frequency increments, [35, 36], propose LPI beam forming based on FDA and FDA-MIMO, respectively. 2) Deceptive signal generation. For the amplitude-based reconnaissance, Antonik analyzes the S-shaped beam of the FDA, and thus proposes conjecture of virtual radiation source which may realize location deception [37, 38] analyzes the deception effect on the sum and difference beam reconnaissance; For the phase-based reconnaissance [39], proposes a cognitive active anti-jamming method based on the FDA phase center [40, 41], study the deception effect of uniform linear FDA (ULFDA) on the interferometer, and [42] further analyzes the influence of the nonlinear frequency increment on the deception effect in the noise environment. However, both [40–42] only analyze the deception effect of the FDA, the direction of arrival (DOA) location deception optimization by regulating frequency increment is not investigated.
Therefore, during the sampling time for the direction-finding process of the interferometer, and considering regulation of the frequency increment sequence on the deception effect, we propose a DOA location deception method according to the average location deviation. Our main contributions are summarized as follows.
1) The regulating ability of the frequency increment sequence on the deceptive FDA signal is investigated. The dual baseline phase interferometer measures the DOA by process the phase difference of the same signal received by different receivers, however, the phase difference of the FDA signal contains the range parameter owing to its frequency increment, and thus the interferometer cannot measure the indicated angle accurately, this means, while the suitable frequency increment sequence selected, the FDA signal is obviously deceptive.
2) A DOA location method based on the regulation of the FDA frequency increment sequence is proposed. Using the regulating effect of the frequency increment sequence, and considering the sampling time of the dual baseline phase interferometer, the optimization of DOA location deception via the average location deviation is derived in the no noise and noise environment, respectively. Besides, considering the time-dependent beam of the FDA, the average SNR (ASNR) and the corresponding CRLB is derived to measure the superiority of the proposed method.
3) The improved particle swarm-immune optimization (PSO-IMMU) algorithm is applied. Since the periodicity of the received phase differs, the optimization problem is considered as a non-convex problem, therefore, the PSO-IMMU algorithm is used to get the optimal frequency increment sequence, in which the extra immune algorithm is used to solve the local optimality problem.
The remaining sections are organized as follows. The Difference of Arrival Location Deception Model Counter Dual Baseline Phase Interferometer Based on Frequency Diverse Array Section analyzes the countering effect of the FDA against the dual baseline phase interferometer. By analyzing the regulating ability of frequency increment sequence, and considering the sampling time, The Difference of Arrival location deception method based on Frequency Diverse Array Section formulates the DOA location deception optimization problem in the no noise and noise environment, respectively. Numerial Results Section gives the simulation results, and the conclusions are drawn in Conclusion Section.
Figure 1 shows a Q-element linear FDA with element spacing d, thus the array factor of the far-field target that locates at
where
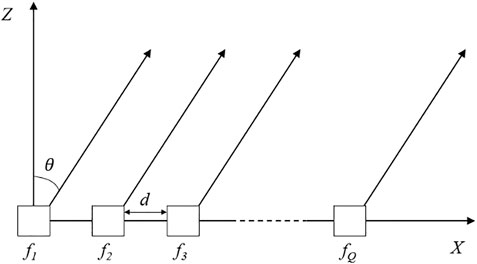
FIGURE 1. Q—element linear Frequency Diverse Array.
With the assumption that
For the simplified expression, we define
Thus (Eq. 3) can be rewritten as
where T is the transpose operator, and
To detect the far-field target at
Therefore, the unidirectional synthesized signal can be expressed as
Actually, (Eq. 7) can be further expressed as
where
with angle being the phase angle solving function.
For the dual baseline phase interferometer shown in Figure 2, the receivers 1, 2, and 3 constitute a planar dual baseline phase interferometer direction-finding system. The receivers 1 and 2 form short baseline d1 and the receivers 2 and 3 form long baseline d2. Then there are,
where
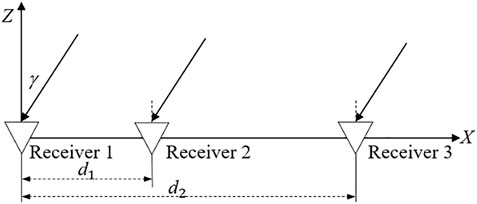
FIGURE 2. Dual baseline phase interferometer.
According to the design rules of the dual baseline phase interferometer, to ensure the short baseline being unambiguous, we set
Supposing
Then, for the long baseline, the true value of the actual phase difference can be given by
As we know, there is a unique correspondence between the phase difference being de-blurred and the DOA. Generally, each de-blurring output can be used for direction finding, but the output accuracy of the long baseline is high. In order to simplify the calculation, we usually only use the output of long baseline to measure the DOA, that is,
Figure 3 gives the position relationship between the interferometer and the FDA radar, in this scenario, we set the far-field indicate angle as
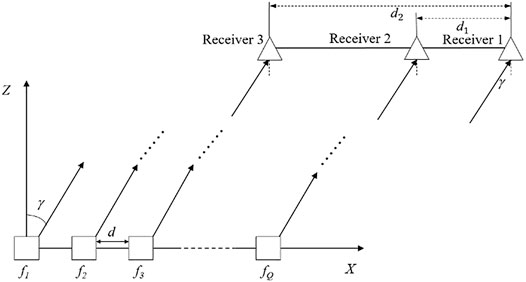
FIGURE 3. The position relationship between the interferometer and the FDA radar.
Then, supposing the range from the first element of FDA radar to the receiver 1 of the interferometer is
According to the de-blurring process given in the Part 2.2, the output phase difference of the long baseline can be given by
From (Eq. 7), we learn that due to the extra frequency increment, the array factor of the FDA is coupled with the range and the indicate angle, and thus the output phase difference
Besides, the measured location (x—intercept) is
Thus, the location deviation from the interferometer center to the array center can be given by
Therefore, while the measured location is outside the array, we regard that the FDA can generate deceptive signals to counter the interferometer, that is,
For the linear FDA with the uniform linear frequency increment (ULFDA),
Then, we have
where
Then the measured DOA and location can be given by
Thus, the location deviation is
Therefore, for the ULFDA, to ensure the deception effect, we have
From the deception model, we learn that when the frequency increment between adjacent elements is varying, due to the nonlinear frequency increment, the phase differences are related to the range, the length of baseline, and t. For this case, by controlling the frequency increment sequence, we can control the DOA and location deviation to realize DOA location deception on the dual baseline phase interferometer. Therefore, we have
where
To investigate the regulation effect of the frequency diverse sequence on the location deception, by change the
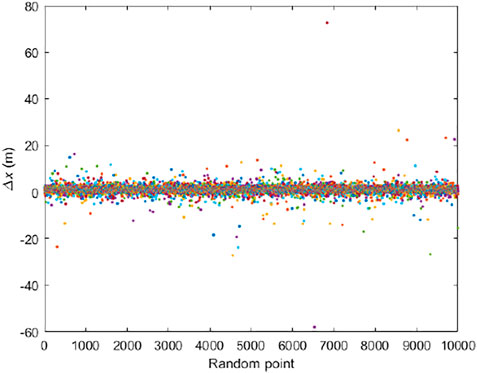
FIGURE 4. Regulation effect of Δf on the location deviation.
It can be seen that, with
The Monte Carlo results show that the Δf has the regulation ability on the deception effect, it means, by regulating
Therefore, we define the average DOA and location deviation, respectively,
where
As we know, to realize the deception on the dual baseline phase interferometer, we should ensure that the measured location deviates out of the FDA antenna, thus, we have
As the analysis of part 3.1, we can learn that when an appropriate
From the above analysis, the DOA location deception problem on interferometer using FDA can be converted into the following optimization problems,
Converting the optimization problem to a minimizing optimization problems, we have
Let
where
However, in practice, there will be noise in the process, so the noise should be also taken into consideration. The RMSE is used to solve this problem, that is,
Therefore, in the noise environment, the DOA location deception problem on interferometer using FDA can be expressed as
Let
where
Eqs 33, 36 give the closed form of optimization to realize the DOA location deception problem on the interferometer in the case of no noise and noise, respectively. However, since the phase is periodic, the optimizations are non-convex problems, thus, the particle swarm immune optimization (PSO-IMMU) algorithm is used to solve this problem. According to the particle swarm optimization (PSO), the position and speed of the particle update with the following equation,
where Pi and Pg denote the local optimal solutions and global optimal solutions, respectively. c1 andc2 are constant learning factors, and ω denotes the inertia weight. Thus, the flowchart of the optimization is given in Figure 5.
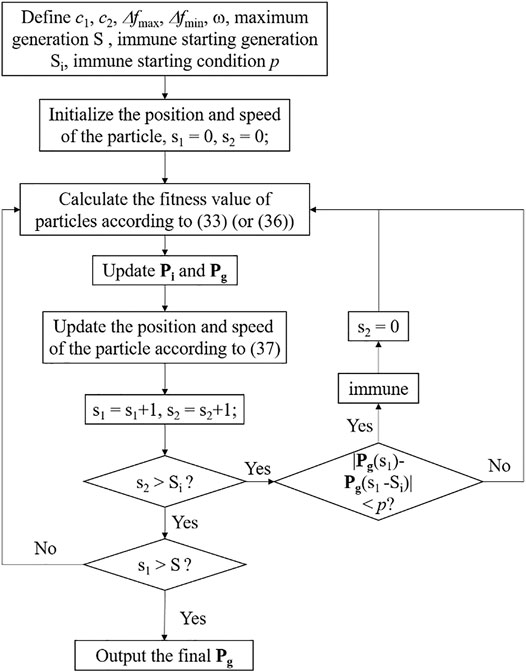
FIGURE 5. Flowchart of the optimization.
In summary, the output of the PSO-IMMU is the optimal frequency increment sequence, based on which, the FDA can realize DOA location deception on the dual baseline phase interferometer.
As we know, the beam of the FDA is time-dependent. This means, in the constant noise environment, the SNR of the FDA signal is varying with time, and thus we derive the instantaneous by
where Pw is the average noise power. During the sampling time, the average SNR (ASNR) is
Actually, for the PA signal, the SNR is constant, that is,
where,
Therefore, we can learn that the ASNR of the PA is always higher than that of the FDA.
To analyzes the proposed method in the noise environment, the CRLB is important. Let
where d0 = 0.
Similar to [42], the CRLB for the dual baseline phase interferometer is
In general, for the signals of the different array, the higher the CRLB is, the better the deception performance is.
To verify the proposed method, we divide the numerical simulation into 3 parts: 1) The deception effect of the FDA counter the dual baseline phase interferometer. 2) The optimal deception method without noise. 3) The optimal deception method in the noise environment. Here the FDA radar and dual baseline phase interferometer is considered, the main simulation parameters are listed in Table 1.
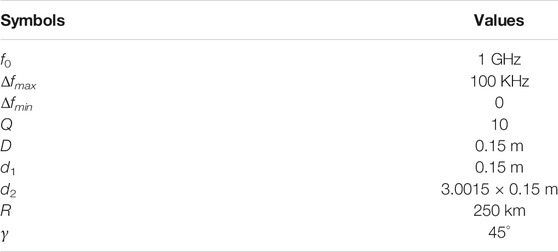
TABLE 1. Main simulation parameters.
Example 1: The deception effect of the FDA counter the dual baseline phase interferometer: In this example, we analyze different parameters the influence of different parameters on the deception effect, and three array structures are considered: 1) Phased array 2) FDA with frequency increment
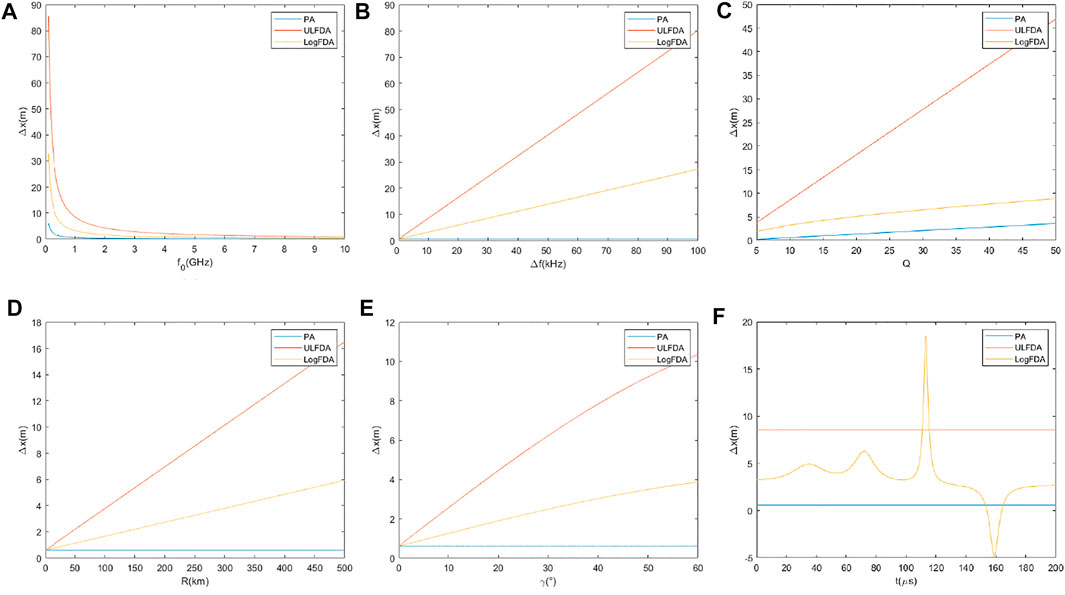
FIGURE 6. The DOA deception effect of the FDA (A)x-intercept deviation with f0(B)x-intercept deviation with Δf(C)x-intercept deviation with Q (D)x-intercept deviation with R(E)x-intercept deviation with γ(F)x-intercept deviation with t.
Example 2: The optimal deception method without noise. Supposing
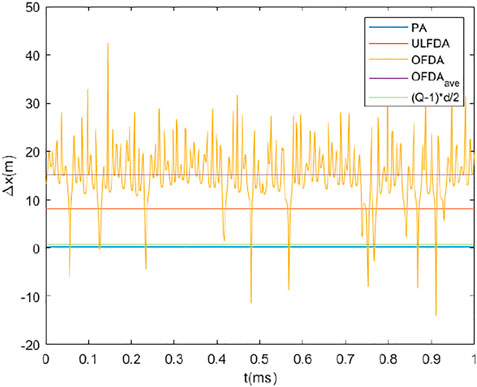
FIGURE 7. The Difference of Arrival deception effect of the OFDA.
Example 3: The optimal deception method in the noise environment. With the Gaussian white noise assumption, and setting the sampling time of the interferometer as 1ms, we derive the optimal frequency increment sequence according to (Eq. 36). Generally, assuming that the array structures are all in the same noise environment, and taking the SNR of PA as reference, Figure 8 gives the variation of deception effect with SNR, we can see that compared with PA and ULFDA, the proposed OFDA can achieve better deception effect on the interferometer than ULFDA. Then, Figure 9 gives the variation of location error with SNR, we can see the proposed OFDA has better DOA location deception effect. However, compared with the ULFDA, the OFDA perform better while the SNR is high, but for the case that the SNR is low, there is little difference between the OFDA and the ULFDA. To explain this phenomenon, Figure 10 gives the beampattern of the three array structures, we can see that compared with the other two structures, there are many times when the energy is zero in the beampattern of FDA, which means in those times, the ISNR of FDA will be infinitesimal, and the interferometer can only receive the noise, and that will make the average estimation of x-intercept inaccurate, especially when the SNR is low. In summary, the proposed method performs a better DOA location deception effect in the case of noise, especially when the SNR is high.

FIGURE 8. The variation of deception effect with SNR (A) RMSE of DOA (B) RMSE of location.
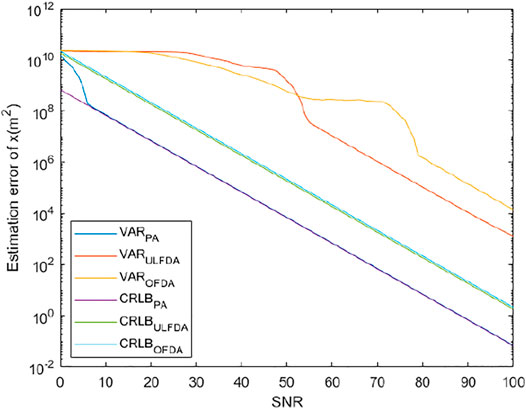
FIGURE 9. The variation of location error with SNR.
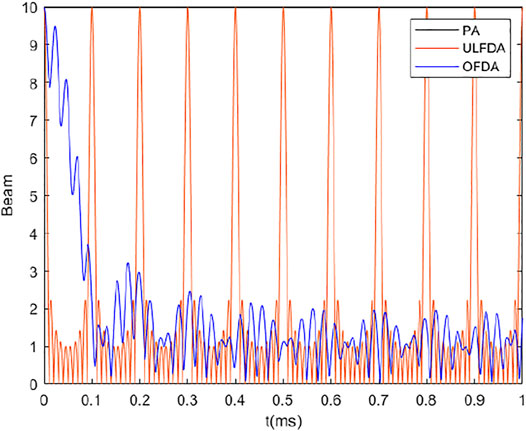
FIGURE 10. The beam pattern of three array structures.
In this paper, to counter the dual baseline phase interferometer, we proposed a DOA location deception method based on the FDA with non-linear frequency increment. The dual baseline phase interferometer measures the DOA by processing the phase difference of the same signal received by different receivers, however, the phase difference of the FDA signal contains the range parameter owing to its frequency increment, and thus the interferometer cannot measure the indicated angle accurately. Therefore, by analyzing the regulating ability of frequency increment sequence on the deception effect, considering the sampling time, we formulate the DOA location deception optimization problem in the no noise and noise environment, respectively. Considering the periodicity of the phase, the PSO-IMMU algorithm is used to solve this non-convex problem. The numerical simulations show that the proposed method can realize good deception effect on the dual baseline phase interferometer, however, since there are multiple zero energy points in the FDA signal during sampling time, the superiority of the proposed method is not more obvious than the ULFDA in the high noise environment, the higher the SNR is, the better the deception effect of the proposed method is. In summary, the proposed method is a good countermeasure for the interferometry reconnaissance.
The original contributions presented in the study are included in the article/Supplementary Material, further inquiries can be directed to the corresponding author.
JG: Conceptualization, Methodology, Simulation, Writing the original draft. JX: Validation, review and editing, Supervision. CC: Formal analysis, review and editing. BW: Supervision, Visualization.
The authors declare that the research was conducted in the absence of any commercial or financial relationships that could be construed as a potential conflict of interest.
1. Trinh-Hoang M, Viberg M, Pesavento M. Partial Relaxation Approach: An Eigenvalue-Based DOA Estimator Framework. IEEE Trans Signal Process (2018) 66(23):6190–203. doi:10.1109/tsp.2018.2875853
2. Cheung KW, So HC, Ma W-K, Chan YT. Least Squares Algorithms for Time-Of-Arrival-Based Mobile Location. IEEE Trans Signal Process (2004) 52(4):1121–8. doi:10.1109/tsp.2004.823465
3. Ho KC. Bias Reduction for an Explicit Solution of Source Localization Using TDOA. IEEE Trans Signal Process (2012) 60(5):2101–14. doi:10.1109/tsp.2012.2187283
4. Ho KC, Lu X, Kovavisaruch L. Source Localization Using TDOA and FDOA Measurements in the Presence of Receiver Location Errors: Analysis and Solution. IEEE Trans Signal Process (2007) 55(2):684–96. doi:10.1109/tsp.2006.885744
5. Wang G, Yang K. A New Approach to Sensor Node Localization Using RSS Measurements in Wireless Sensor Networks. IEEE Trans Wireless Commun (2011) 10(5):1389–95. doi:10.1109/twc.2011.031611.101585
6. Yang J-R. Measurement of Amplitude and Phase Differences between Two RF Signals by Using Signal Power Detection. IEEE Microw Wireless Compon Lett (2014) 24(3):206–8. doi:10.1109/lmwc.2013.2293665
7. Antonik P, Wicks MC, Griffiths HD, Baker CJ. Frequency Diverse Array Radars. In: IEEE Conference on Radar. IEEE (2006). doi:10.1109/RADAR.2006.1631800
8. Huang J, Tong KF, Baker C. Frequency Diverse Array: Simulation and Design. In: Radar Conference. IEEE (2009). doi:10.1109/RADAR.2009.4976998
9. Huang J, Tong KF, Baker CJ. Frequency Diverse Array with Beam Scanning Feature. In: Antennas & Propagation Society International Symposium. IEEE (2008). doi:10.1109/APS.2008.4619415
10. Khan W, Qureshi IM, Saeed S. Frequency Diverse Array Radar with Logarithmically Increasing Frequency Offset. Antennas Wirel Propag Lett (2015) 14:499–502. doi:10.1109/lawp.2014.2368977
11. Shao H, Dai J, Xiong J, Chen H, Wang W-Q. Dot-Shaped Range-Angle Beampattern Synthesis for Frequency Diverse Array. Antennas Wirel Propag Lett (2016) 15:1703–6. doi:10.1109/lawp.2016.2527818
12. Liu Y, Ruan H, Wang L, Nehorai A. The Random Frequency Diverse Array: A New Antenna Structure for Uncoupled Direction-Range Indication in Active Sensing. IEEE J Sel Top Signal Process (2017) 11(2):295–308. doi:10.1109/jstsp.2016.2627183
13. Xiong J, Wang W-Q, Shao H, Chen H. Frequency Diverse Array Transmit Beampattern Optimization with Genetic Algorithm. Antennas Wirel Propag Lett (2017) 16:469–72. doi:10.1109/lawp.2016.2584078
14. Wang W-Q. Subarray-based Frequency Diverse Array Radar for Target Range-Angle Estimation. IEEE Trans Aerosp Electron Syst (2014) 50(4):3057–67. doi:10.1109/taes.2014.120804
15. Liao Y, Wang W-Q, Zheng Z. Frequency Diverse Array Beampattern Synthesis Using Symmetrical Logarithmic Frequency Offsets for Target Indication. IEEE Trans Antennas Propagat (2019) 67(5):3505–9. doi:10.1109/tap.2019.2900353
16. Wen-Qin Wang W, Huaizong Shao S. Range-Angle Localization of Targets by A Double-Pulse Frequency Diverse Array Radar. IEEE J Sel Top Signal Process (2014) 8(1):106–14. doi:10.1109/jstsp.2013.2285528
17. Wang Y, Wang W-Q, Shao H. Frequency Diverse Array Radar Cramér-Rao Lower Bounds for Estimating Direction, Range, and Velocity. Int J Antennas Propagation (2014) 2014:1–15. doi:10.1155/2014/830869
18. Xu J, Liao G, Zhu S, So HC. Deceptive Jamming Suppression with Frequency Diverse MIMO Radar. Signal Process. (2015) 113:9–17. doi:10.1016/j.sigpro.2015.01.014
19. Abdalla A, Wang W-Q, Yuan Z, Mohamed S, Bin T. Subarray-Based FDA Radar to Counteract Deceptive ECM Signals. EURASIP J Adv Signal Process (2016) 2016:104. doi:10.1186/s13634-016-0403-6
20. Li Z, et al. A Robust Deceptive Jamming Suppression Method Based on Covariance Matrix Reconstruction with Frequency Diverse Array MIMO Radar. In: 2017 IEEE International Conference on Signal Processing, Communications and Computing (ICSPCC); Xiamen, China. IEEE (2017). p. 1–5. doi:10.1109/ICSPCC.2017.8242590
21. Li S, Zhang L, Liu N, Zhang J, Zhao S. Adaptive Detection with Conic Rejection to Suppress Deceptive Jamming for Frequency Diverse MIMO Radar. Digital Signal Process. (2017) 69:32–40. doi:10.1016/j.dsp.2017.06.008
22. Lan L, Liao G, Xu J, Zhang Y, Fioranelli F. Suppression Approach to Main-Beam Deceptive Jamming in FDA-MIMO Radar Using Nonhomogeneous Sample Detection. IEEE Access (2018) 6:34582–97. doi:10.1109/access.2018.2850816
23. Li G-m., Zhang Q, Liu Q-y., Liang J, Wang D, Zhu F. Mainlobe Jamming Suppression Using Improved Frequency Diverse Array with MIMO Radar. J Sensors (2019) 2019:1–12. doi:10.1155/2019/3948597
24. Jones AM, Rigling BD. Frequency Diverse Array Radar Receiver Architectures. In: International Waveform Diversity & Design Conference; Kauai, HI, USA. IEEE (2012). doi:10.1109/WDD.2012.7311296
25. Jones AM, Rigling BD. Planar Frequency Diverse Array Receiver Architecture. In: Radar Conference; Atlanta, GA, USA. IEEE (2012). doi:10.1109/RADAR.2012.6212127
26. Gui R, Wang W-Q, Cui C, So HC. Coherent Pulsed-FDA Radar Receiver Design with Time-Variance Consideration: SINR and CRB Analysis. IEEE Trans Signal Process (2018) 66(1):200–14. doi:10.1109/tsp.2017.2764860
27. Ji S, Wang W-Q, Chen H, Zheng Z. Secrecy Capacity Analysis of AN-Aided FDA Communication over Nakagami- ${m}$ Fading. IEEE Wireless Commun Lett (2018) 7(6):1034–7. doi:10.1109/lwc.2018.2850896
28. Eker T, Demir S, Hizal A. Exploitation of Linear Frequency Modulated Continuous Waveform (LFMCW) for Frequency Diverse Arrays. IEEE Trans Antennas Propagat (2013) 61(7):3546–53. doi:10.1109/tap.2013.2258393
29. Cetintepe C, Demir S. Multipath Characteristics of Frequency Diverse Arrays over a Ground Plane. IEEE Trans Antennas Propagat (2014) 62(7):3567–74. doi:10.1109/tap.2014.2316292
30. Yao A-M, Wu W, Fang D-G. Frequency Diverse Array Antenna Using Time-Modulated Optimized Frequency Offset to Obtain Time-Invariant Spatial fine Focusing Beampattern. IEEE Trans Antennas Propagat (2016) 64(10):4434–46. doi:10.1109/tap.2016.2594075
31. Yao A-M, Wu W, Fang D-G. Solutions of Time-Invariant Spatial Focusing for Multi-Targets Using Time Modulated Frequency Diverse Antenna Arrays. IEEE Trans Antennas Propagat (2017) 65(2):552–66. doi:10.1109/tap.2016.2633902
32. Yao A-M, Rocca P, Wu W, Massa A, Fang D-G. Synthesis of Time-Modulated Frequency Diverse Arrays for Short-Range Multi-Focusing. IEEE J Sel Top Signal Process (2017) 11(2):282–94.
33. Xu Y, Shi X, Xu J, Li P. Range-angle-dependent Beamforming of Pulsed Frequency Diverse Array. IEEE Trans Antennas Propagat (2015) 63(7):3262–7. doi:10.1109/tap.2015.2423698
34. Ahmad Z, Shi Z, Zhou C. Time-Variant Focused Range-Angle Dependent Beampattern Synthesis by Frequency Diverse Array Radar. Iet Signal Processing (2020). doi:10.1049/rsn2.12014
35. Wang W-Q. Adaptive RF Stealth Beamforming for Frequency Diverse Array Radar. In: 2015 23rd European Signal Processing Conference (EUSIPCO). Nice: IEEE (2015). p. 1158–61. doi:10.1109/EUSIPCO.2015.7362565
36. Xiong J, Wang WQ, Cui C, Gao K. Cognitive FDA‐MIMO Radar for LPI Transmit Beamforming. IET Radar, Sonar & Navigation (2017) 11(10):1574–80. doi:10.1049/iet-rsn.2016.0551
37. Antonik P . An Investigation of a Frequency Diverse Array. Doctoral Thesis. UCL (University College London) (2009).
38. Wang L, Ye P, Wen-Qin W, Jingran L. On FDA RF Localization Deception under Sum Difference Beam Reconnaissance. In: 2018 IEEE Radar Conference (RadarConf18), Oklahoma City (2018). p. 269–73. doi:10.1109/RADAR.2018.8378569
39. Ge J, Xie J, Wang B. A Cognitive Active Anti-jamming Method Based on Frequency Diverse Array Radar Phase Center. Digital Signal Process. (2021) 109:102915. doi:10.1016/j.dsp.2020.102915
40. Zhang X, Yan Y, Wang WQ, Zhang S. On RF Localisation Deception Capability of FDA Signal under Interferometry Reconnaissance. J Eng (2019) 2019:6695–8. doi:10.1049/joe.2019.0253
41. Hou Y, Wang W-Q. Active Frequency Diverse Array Counteracting Interferometry-Based DOA Reconnaissance. Antennas Wirel Propag Lett (2019) 18(9):1922–5. doi:10.1109/lawp.2019.2933547
Keywords: RF stealth, frequency diverse array, deception, passive localization, interferometer analysis
Citation: Ge J, Xie J, Chen C and Wang B (2021) The Direction of Arrival Location Deception Model Counter Duel Baseline Phase Interferometer Based on Frequency Diverse Array. Front. Phys. 9:598047. doi: 10.3389/fphy.2021.598047
Received: 23 August 2020; Accepted: 14 May 2021;
Published: 28 June 2021.
Edited by:
Gang Zhang, Nanjing Normal University, ChinaReviewed by:
Yuqian Mao, Nanjing University of Aeronautics and Astronautics, ChinaCopyright © 2021 Ge, Xie, Chen and Wang. This is an open-access article distributed under the terms of the Creative Commons Attribution License (CC BY). The use, distribution or reproduction in other forums is permitted, provided the original author(s) and the copyright owner(s) are credited and that the original publication in this journal is cited, in accordance with accepted academic practice. No use, distribution or reproduction is permitted which does not comply with these terms.
*Correspondence: Jiaang Ge, Z2VqaWFhbmcwMzEzQDE2My5jb20=
Disclaimer: All claims expressed in this article are solely those of the authors and do not necessarily represent those of their affiliated organizations, or those of the publisher, the editors and the reviewers. Any product that may be evaluated in this article or claim that may be made by its manufacturer is not guaranteed or endorsed by the publisher.
Research integrity at Frontiers
Learn more about the work of our research integrity team to safeguard the quality of each article we publish.