
94% of researchers rate our articles as excellent or good
Learn more about the work of our research integrity team to safeguard the quality of each article we publish.
Find out more
ORIGINAL RESEARCH article
Front. Phys. , 24 May 2021
Sec. Interdisciplinary Physics
Volume 9 - 2021 | https://doi.org/10.3389/fphy.2021.591651
This article is part of the Research Topic Physics and Seismicity of Rocks View all 18 articles
A correction has been applied to this article in:
Corrigendum: Study on the acoustic emission characteristics of different rock types and its fracture mechanism in brazilian splitting test
In order to investigate the relationship between rock microfracture mechanism and acoustic emission (AE) signal characteristic parameters under split loads, the MTS322 servo-controlled rock mechanical test system was employed to carry out the Brazilian split tests on granite, marble, sandstone, and limestone, while FEI Quanta-200 scanning electron microscope system was employed to carry out the analysis of fracture morphology. The results indicate that different scales of mineral particle, mineral composition, and discontinuity have influence on the fracture characteristics of rock, as well as the b-value. The peak frequency distribution of the AE signal has obvious zonal features, and these distinct peak frequencies of four types of rock fall mostly in ranges of 0–100 kHz, 100–300 kHz, and above 300 kHz. Due to the different rock properties and mineral compositions, the proportions of peak frequencies in these intervals are also different among the four rocks, which are also acting on the b-value. In addition, for granite, the peak frequencies of AE signals are mostly distributed above 300 kHz for granite, marble, and limestone, which mainly derive from the internal fracture of k-feldspar minerals; for marble, the AE signals with peak frequency are mostly distributed in over 300 kHz, which mainly derive from the internal fracture of dolomite minerals and calcite minerals; AE signals for sandstone are mostly distributed in the range of 0–100 kHz, which mainly derive from the internal fracture of quartz minerals; for limestone, the AE signals with peak frequency are mostly distributed in over 300 kHz, which mainly derive from the internal fracture of granular-calcite minerals. The relationship between acoustic emission signal frequency of rock fracture and the fracture scale is constructed through experiments, which is of great help for in-depth understanding of the scaling relationship of rock fracture.
From a microscopic point of view, solids are made up of strong and rigid phases or crystalline grains, especially ceramic, rock, and concrete materials. Due to the diversity of chemical composition or crystal orientation, the different elastic moduli among crystalline grains could lead to local high stress under external stress, and microscopic processes would be activated by crack tips under the stress and would eventually cause crack expansion and propagation, which could result in intergranular or transgranular cracks generated by cracks propagating along grains or grain boundaries [1]. From a macroscopic perspective, however, rocks are mostly polycrystalline and brittle, containing natural structural planes such as joints and weak intercalated layers; thus, the nucleation and propagation of cracks generated by rock failure emit energy outward as elastic waves when subjected to loading conditions. Such elastic waves are derived from microscopic dislocations; twinned crystals; crystal interfaces and the slip; and separation of macroscopic mineral grains, joints, and other weak planes; all of these are referred to as AE activity [2–6]. It is because of the complex composition of rock material that the cracks inside the rock sample, from microscopic to macroscopic level, will be in different scales and have different fracturing mechanisms under various loading conditions. These different cracking scales and fracturing mechanisms have close relationship with AE signal feature parameters [7, 8].
One of the critical AE parameters is signal frequency which could be used to infer the change of the internal stress state of a rock mass and reveal the rock fracture mechanism [6, 8, 9]. As a matter of fact, there is a natural correspondence between the rupture scale and the signal frequency; it is considered that the high frequency AE signals corresponded to the small scale crack, while the low frequency AE signals corresponded to the large scale crack [2, 5, 10–12]. Meanwhile, some researches based on laboratory AE experiments have shown that the AE signals of rock samples were characterized by a long duration time and a wide frequency spectrum when subjected to shear failure, whereas the results contrasted in tensile failure [11, 13, 14]. In field AE monitoring, it was also demonstrated that there were two typical signals, durative and attenuative, which were derived from the sliding and tensile failure or separation of faults, respectively [15, 16]. This derivation was mainly due to the larger part of energy transmitted in the form of shear waves, which were slower. Therefore, the maximum peak of the waveform delayed considerably compared with the onset of the initial longitudinal arrivals, and AE signals exhibited a higher frequency in tensile mode compared with a lower frequency in shear mode. For these frequency features given above, the AE signals at different stress stages and loading conditions have different dominant frequency characteristics because of various fracture modes generated [17, 18]. Therefore, the frequency spectrum of collected AE signal is determined by the loading condition, rock type, failure process, etc., and the development characteristics of signal frequency could provide a basis for the prediction of rock stability and localization of microseismic/acoustic emission sources [19]. Another characteristic parameter is the b-value. b-value is known to be an important scaling parameter in faulting evaluation, and the spatial and temporal variations of the b-value are always regarded as an essential clue for earthquake precursors. The variation of the b-value obtained in rock AE deformation tests has always been used to perform damage process and precursory analysis [3, 20–22].
As b-value is a rupture size scaling parameter, the structure composition, loading mode, and water content of the rock will affect the calculation result of b-value. Rocks with larger mineral particles and complex compositions will have more large-scale fractures with smaller b-value, while rocks with smaller mineral particles and simple compositions will have more small-scale fractures with larger b-value. Therefore, the b-value will reflect the composition of the rock sample to some extent.
Rock failure is a multi-scale and non-linear dynamic process. AE signals generated in an individual mineral particle are different from that on the boundaries of mineral particles. Some researchers found that the AE signals with high-energy and short pulse were produced by the failure process along particles while the signals with low energy and long pulse were generated by the slip of particle boundary and fracture surface under uniaxial compression tests. In addition, the microfracture mechanism depends on the number and distribution of weak mineral particles [23]. The internal structures of rock are composed of different mineral particles. Generally, the strength of a single intact crystal is the highest, followed by the coupling between crystals, and the strength of coupling between mineral grains and structural planes is the smallest. It is due to the complexity of the rock structure that the final macrofracture is often closely related to its internal microstructure and microcrack propagation after deformation, and the morphology characteristics of rupture surface of various structures are different [24, 25]. As mentioned above, the cracking of different structures in a rock sample will generate different types of AE signals; thus, the fracture morphology of various cracking can be related with AE parameters.
Scanning electron microscopes (SEM) has long been employed in metallurgy and material science. It has also been widely used to observe fracture surface morphology to reveal the microfracture mechanism of rocks, owing to its direct observation of sample surface and high magnification [26, 27]. Li et al. [28] found that different fracture modes have different morphological features: tensile fracture has 10 types of morphologies and shear fracture has eight. However, some morphologies, such as smoothly curving conchoidal appearance, are yet a specific feature of quartz; it was considered that river and step patterns belonged to transgranular failure while parallel slip line pattern belonged to intragranular failure [29–31]. The characteristics of fracture surface imply that the microscopic fracture mechanism is greatly influenced by loading conditions and the composition of the rock material, such as mineral components, grain bonding property, and joints. Under uniaxial compression, the microfracture mode of granite changes from intergranular fracture to transgranular fracture as the strain rate increases [32, 33]; under quasi-static loads, the intergranular fractures are in majority due to the toughness of grain boundary or due to the substantial weakness of the cement than that of the grain [34, 35]; whereas under dynamic loads, cleavage steps, multiple micro-conchoidal fracture, and transgranular fractures associated with smooth planar surfaces are frequently observed [33, 36, 37]. Kranz [33] and Alkan et al. [38] also explained that the proportion of transgranular cracks and intergranular cracks appeared to depend on mineral composition, rock types, stress state, etc. For polycrystalline rock materials, given that tensile fracture is the main fracture mode in rock deformation tests, the tensile fracture would occur in different microstructures, which could release elastic wave signals with various characteristics. Therefore, the combination of SEM and AE technology will provide excellent insights into the microscopic fracture mechanism and the characteristics of corresponding AE signals.
For this purpose, four types of rock materials were used to perform Brazilian splitting tests for this study: granite, marble, sandstone, and limestone. By comparing the AE signals of four types of rocks and the SEM observations, we could explore more deeply the relationship of microfracture mechanisms and AE characteristic parameters from a microscopic perspective.
Granite, marble, sandstone, limestone were the four rock types selected as research objects of this experiment. They were all made into cylindrical samples with a diameter of 50 mm and length of 50 mm. Before the experiment, the mineral compositions of the four rock types were measured by transparent refractive index experiment (see Figure 1). The image indicates the preexisting microcracks and microcavities. The granite contains quartz, plagioclase, k-feldspar, and a small amount of biotite; the marble mainly consists of calcite and dolomite; and the main mineral component of the sandstone is quartz while that of the limestone is calcite.
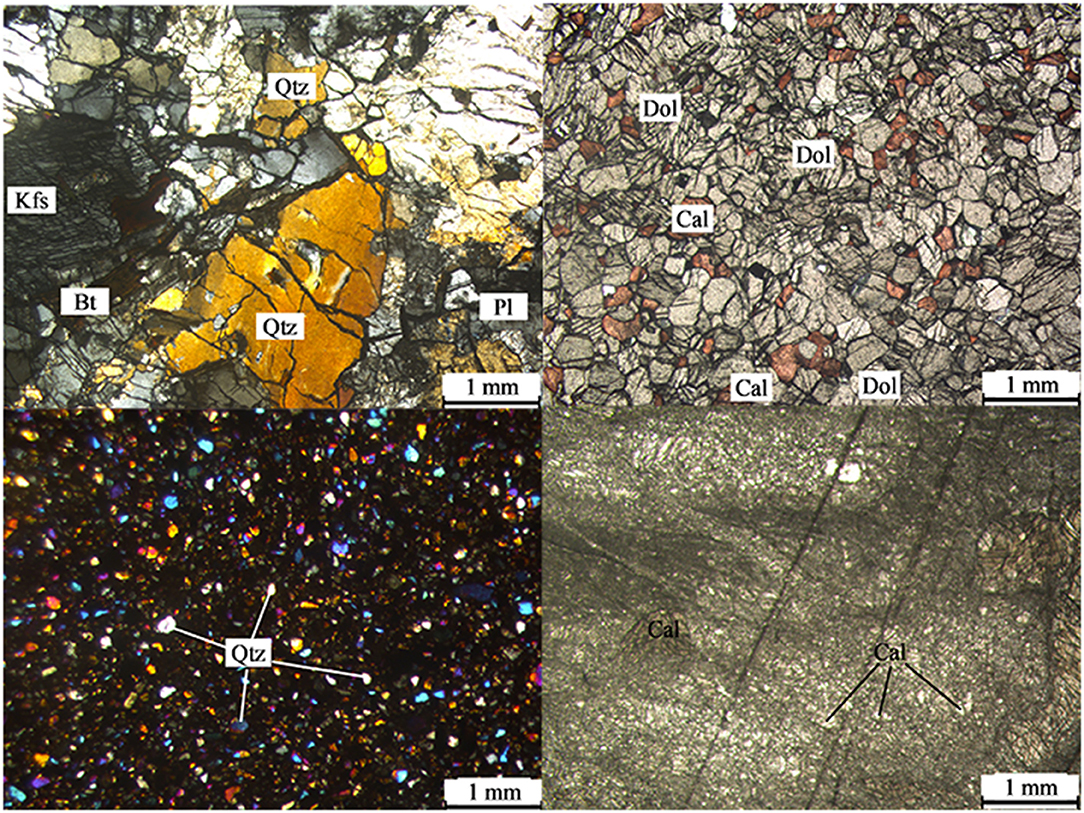
Figure 1. The microstructure of rocks in transparent refractive index experiment, granite (top left), marble (top right), sandstone (bottom left), and limestone (bottom right) (Qtz, quartz; Kfs, k-feldspar; Bt, biotite; PI, plagioclase; Dol, dolomite; Cal, calcite) [39].
The MTS322 servo-controlled rock mechanical test system is employed to carry out Brazilian split tests; its loading and sampling rates are set to 30 kN/min and 50 Hz, respectively. A PCI-2 system (Physical Acoustics Corporation, New Jersey, USA) is used for the collection of AE signals. The threshold, preamplifier gain, sampling length, and sampling rate are set at 45 dB, 40 dB, 5 K, and 10 MSPS, respectively. The PDT, HDT, and HLT are set at 50, 200, and 300 μs. Two ultra-mini sensor-NANO-30 with 140 kHz resonant frequency are glued onto the end face of the specimen, as shown in Figure 2.
The size distribution of earthquake commonly follows a relationship which is given as follows:
where M is magnitude, N is the number of earthquakes with a magnitude ≥M, and a and b are the constants [40]. Here, the parameter b describes the size distribution scaling, which is often referred to as b-value, and the spatial and temporal variations of b-value are always regarded as an essential clue for earthquake precursor. In the calculation, magnitude in the G-R relation is replaced by amplitude [41]:
where a, b, and N refer to the same as Formula (1). AdB is the maximum amplitude of an acoustic emission event expressed in decibels:
where Amax is the maximum amplitude value of AE event expressed in microvolts.
The integral b-value of those rock samples were calculated by using FGS method proposed by Liu et al. [42]. As shown in Figure 3, the b-value of marble is the largest, followed by sandstone, granite, and limestone. As the heterogeneity and internal structure of the rock material plays an important role in b-value, different rock samples with various mineral particle size and uniformity will result in different calculated b-value. As shown in Figure 1, marble and sandstone are composed of fine-grained particles and seldom have large size discontinuities. With dolomite and calcite granules being closely related to mosaic crystal structures, the particles are small and uniform, a feature that accounts for a high proportion of small-scale ruptures in the loading process, so the b-value is high. Granite has various large-sized mineral grains and defects; more large-scale fractures will be generated during the whole loading process, so the b-value is low. Limestone contains a large number of joints during deposition and ruptures mainly along these joints, which would generate more large-scale ruptures, so the b-value of it is the lowest. Therefore, the b-value of the rock is inversely proportional to the size of its fracture scale.
Generally, earthquake signal frequency is below a few Hertz, and microseismic signal frequency ranges from a few Hertz to thousands of Hertz, while AE signal frequency is between several thousand Hertz and a number of megahertz [43]. In fact, many previous studies have shown that frequency is an important parameter to characterize the elastic wave [2–34]. For AE of rocks, different types of sources produce different scales of fracture, which release the AE signals with different frequencies. The signals generated by large-scale cracks contain significant low-frequency components, and the signals generated by small-scale cracks contain significant high-frequency components. In spectra analysis, peak frequency is an important parameter to analyze the spectral characteristics of signal, which is the frequency of the maximum energy spectrum, and can be approximately regarded as the main frequency of the signal, and the source type can be recognized by analyzing the value of peak frequency.
The peak frequencies of the four rock types mostly present the zonal distribution feature as shown in Figure 4. These signal peak frequencies mainly distribute in the range of 0–100, 100–300, and 300 kHz and above, and the proportion of each frequency band is listed in Table 1. Under splitting loads, the rock samples are dominated by tensile cracks, and tensile cracks are characterized by spectra with a rapid decay in high frequency, whereas shear sources are characterized by a broader spectra and a lower decay [11, 14, 44, 45]; this indicates the presence of more high-frequency content in the spectra of signals generated by tensile cracks. Besides, in the Brazilian split test, rock samples will split along axial center surface, which greatly reduces the probability of fracture along the internal discontinuous planes joints, in which the AE signals are mainly generated by the separation of mineral particles on the splitting surface. These smaller scale fractures usually release AE signals with high frequency. Therefore, for granite, marble, and limestone, the signal peak frequencies larger than 300 kHz are in the majority, whereas for sandstone, the high frequency component of AE signal will be greatly attenuated due to high porosity [46–49], thus resulting in relatively larger proportion of low frequency signals being collected.
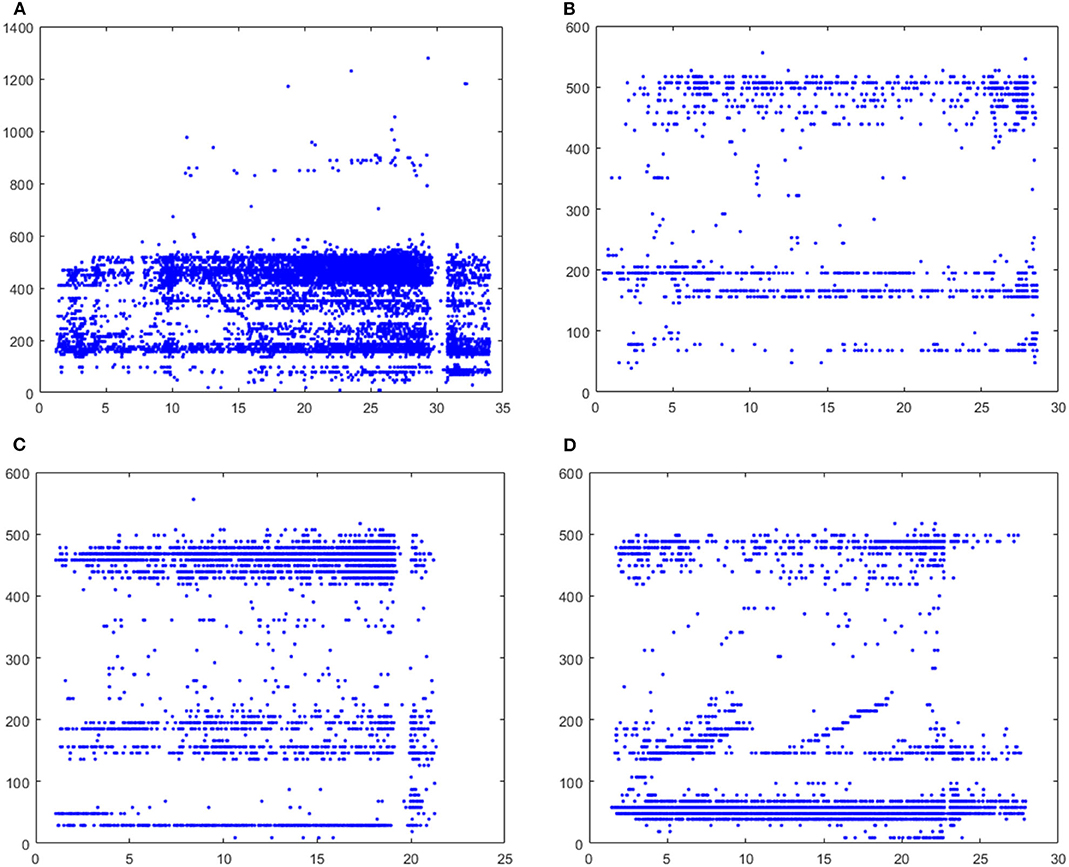
Figure 4. Peak frequency distribution with loading time. (A) is the peak frequency distribution and corresponding density contours of granite; (B) is the peak frequency distribution and corresponding density contours of limestone; (C) is the peak frequency distribution and corresponding density contours of the peak frequency distribution with loading time of sandstone; (D) is the peak frequency distribution and corresponding density contours of the peak frequency distribution with loading time of marble.
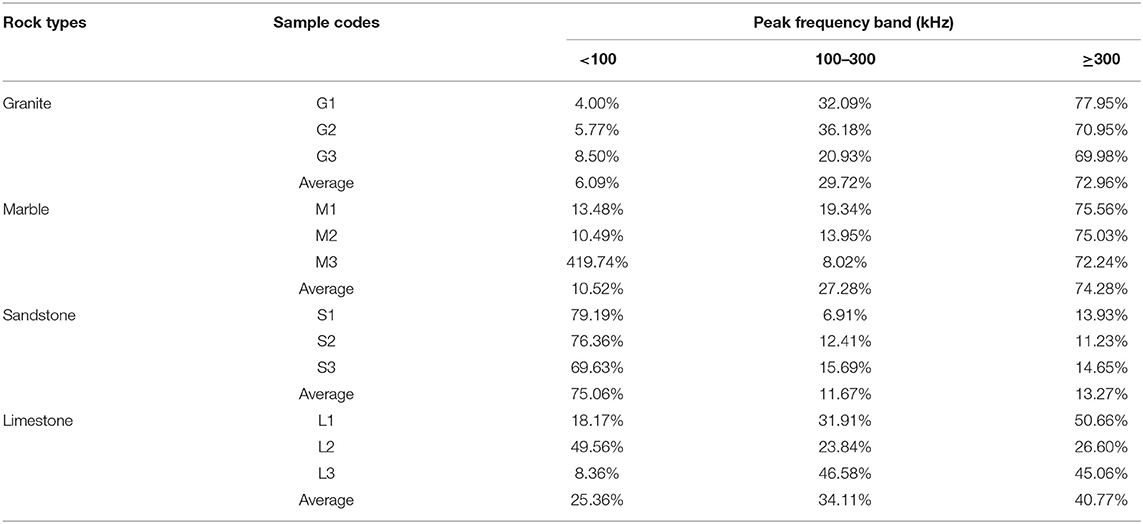
Table 1. Distribution percentage of AE peak frequency for four rock types under Brazilian split test.
After the loading test, the FEI Quanta-200 was used to conduct fracture surface scanning. The rupture morphology of granite is mainly composed of three patterns, as shown in Figures 5A–C, according to the following energy spectrogram. The morphology of Figure 5A is derived from quartz mineral grains, showing smooth planar surfaces and shear sliding marks, while the morphology of Figures 5B,C is derived from k-feldspar mineral grains, showing noticeably rugged surfaces. It can be clearly seen in Figure 1 (top lift) that there is a variety of coupling among mineral grains, as well as defects or voids within a single mineral particle, which determines the macroscopic physical properties of rocks. The integrity of quartz and plagioclase is better when k-feldspar has laminar fragmentized structure and its layer-to-layer is attracted by the coulomb force with relatively weak potassium ionic bond [1], all of which greatly reduces the strength of k-feldspar. For k-feldspar, the resulting fracture surface morphology when the direction of stress is vertical to the laminar plates is shown in Figure 5B, namely, the laminar pattern, whereas the morphology of when the direction of stress is parallel to the plates is shown in Figure 5C, namely, flaky patterns. The microscopic fracture characteristics of the rock samples depend on the number and distribution of weak mineral particles under stress [23], and the fracture is more likely to occur in weak mineral particles. For granite in this experiment, k-feldspar belongs to the typical weak mineral grains and the internal microfracture within the samples subjected to splitting loads occurs more easily in k-feldspar mineral grains, which is also the reason why morphology in Figures 5B,C can be often observed. Compared with k-feldspar, there are also obvious discontinuity surfaces in quartz mineral grains; the cracks in quartz will propagate along its internal discontinuity surfaces or boundaries in a tensile failure manner. The smooth and flat surfaces, a special feature of quartz, are frequently observed and shown in Figure 5A [30, 34]. Meanwhile, the samples will be split along their center of loading direction under Brazilian split loads. The opportunity of the main cracks propagating through the quartz mineral grains is larger due to its main mineral components within granite, so the micromorphology of quartz is frequently observed as shown in Figure 5A.
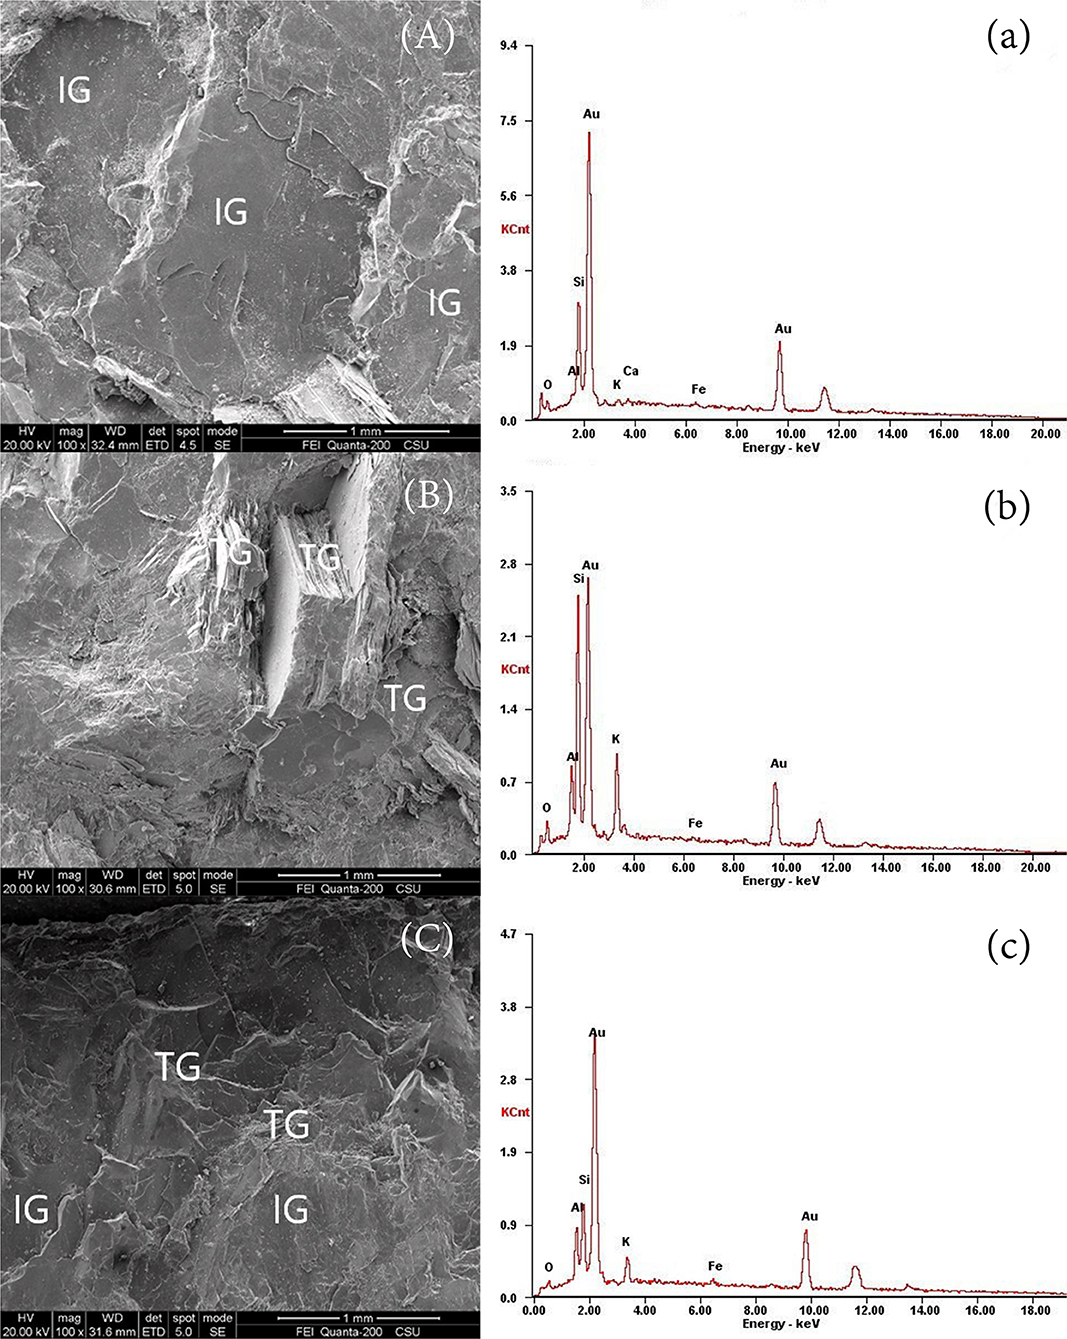
Figure 5. Scanning electron miscroscope (SEM) photos of the fracture surfaces for granite under the Brazilian split test (A), most of fracture surfaces have clear inter-granular cracks and shows “smooth planar” morphology of quartz, (a) energy spectrogram corresponding with (A). (B) This is a typical transgranular crack surface and shows “sidestep” morphology of k-feldspar, (b) energy spectrogram corresponding with (B). (C) There are intergranular and transgranular cracks and shows “stack-up” morphology of k-feldspar, (c) energy spectrogram corresponding with (C).
Generally, marble has a typical granular crystalloblastic texture, as shown in Figure 1 (top right), containing large amounts of dolomite mineral grains and a small amount of calcite mineral grains and with dolomite and calcite granules being closely related mosaic crystal structures. The microfracture morphologies, as shown in Figures 6A,B, are derived from dolomite and calcite particles, respectively. Because dolomite and calcite have similar crystal structures and the crystalline form belongs to the rhombohedral crystal system, gathering with massive and granular patterns, their morphologies are also similar, as shown in Figures 6C,D. Due to the closely related mosaic of dolomite and calcite after metamorphism, whether the cracks propagate between mineral grains or along the internal boundary, smooth crystal boundary surfaces are all frequently observed as shown in Figures 6A,B. Furthermore, there is also a common polysynthetic twinning in calcite as shown in Figures 6B,D.
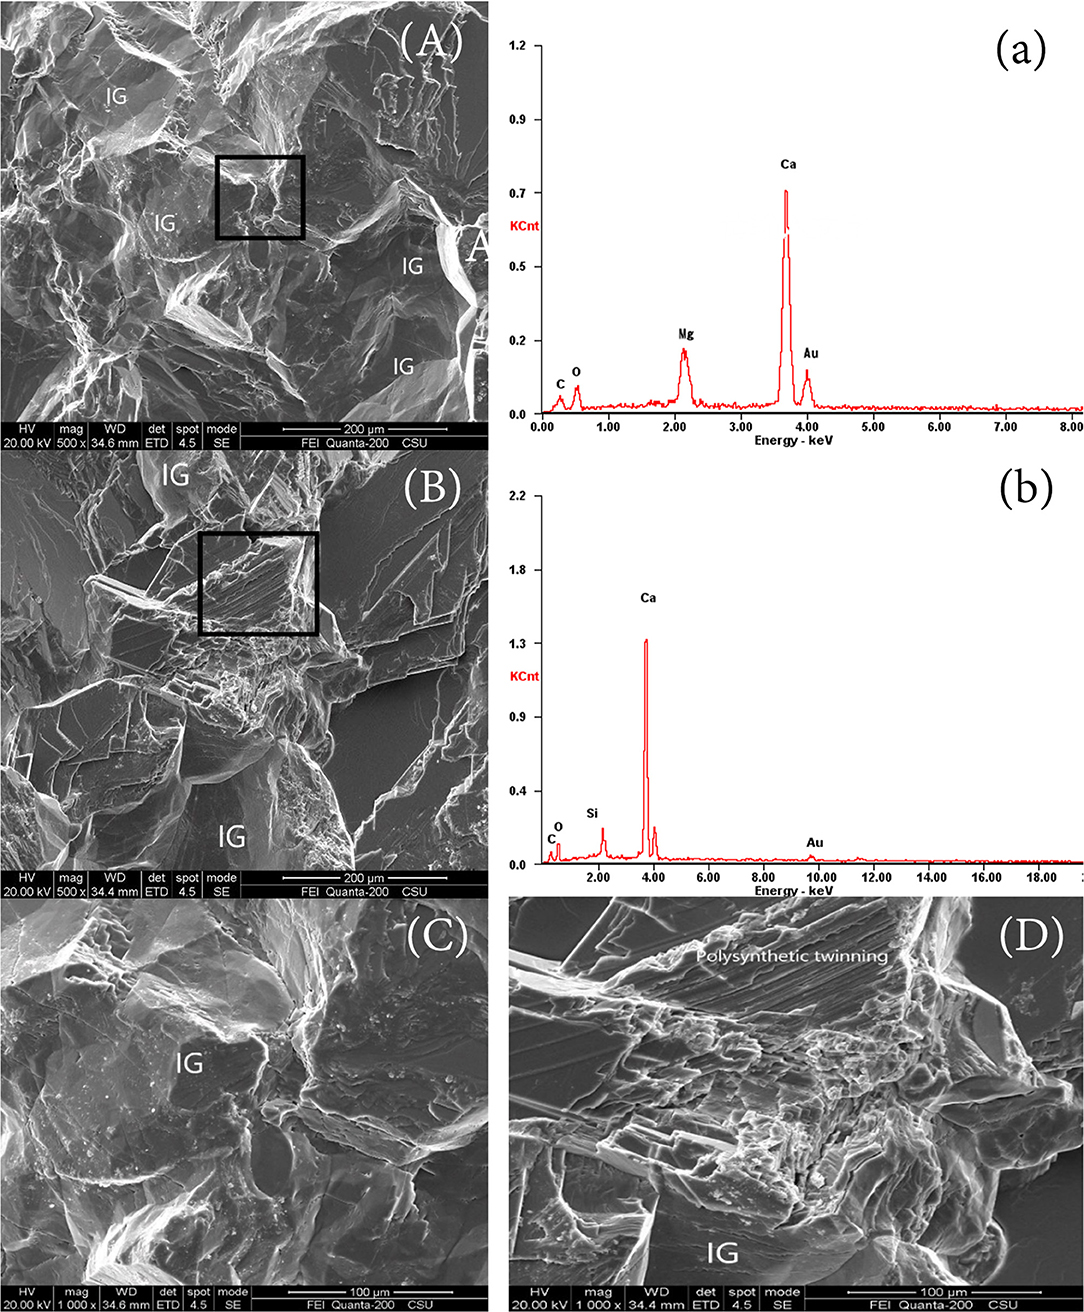
Figure 6. SEM photos of the fracture surfaces for marble under the Brazilian split test. (a,b) The energy spectrogram corresponding with the black square in (A,B) and its mineral composition is dolomite and calcite, respectively; (C,D) represents the high magnification morphology of the black square in (A,B), respectively.
Red sandstone is composed of numerous small-grained particles, so the bonding strength among grains is lower and its gap is larger. The internal microfracture of samples subjected to splitting loads occurs mainly in the cementation region of granules, and the rugged and rough surfaces will be formed by the separation of the cementations; therefore, the “candy shape” morphology is frequently observed in Figures 7A,B.
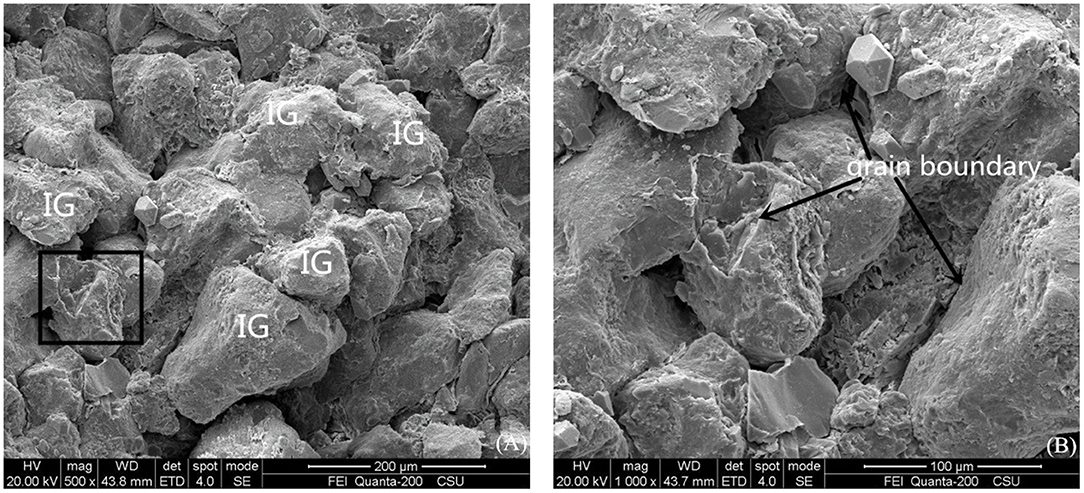
Figure 7. SEM photos of the fracture surfaces for sandstone under the Brazilian split test. (B) is an inter-granular fracture surface which is amplified in black square for (A) and shows “candy” shape.
The limestone used in this experiment is bioclastic limestone and consists of small-grained calcium carbonate and bioclast. Its structure is dense and contains a small number of granular calcite veins and a large number of discontinuities during deposition, as shown in Figure 1 (bottom right). The microfracture morphologies of the samples subjected to splitting loads are mostly observed as shown in Figure 8A, which are mainly the separation of the calcium carbonate cementite and also the apparent separation of the discontinuous surface of calcium carbonate cementite. and there is a secondary cracks (SC) on the fracture surface shown in Figure 8B. In addition, if the fracture surface occurs in granular calcite veins, it will have the morphology shown in Figure 8C, showing a typical rupture feature of calcite and there are smooth steps with streamline patterns on the fracture surface shown in Figure 8D.
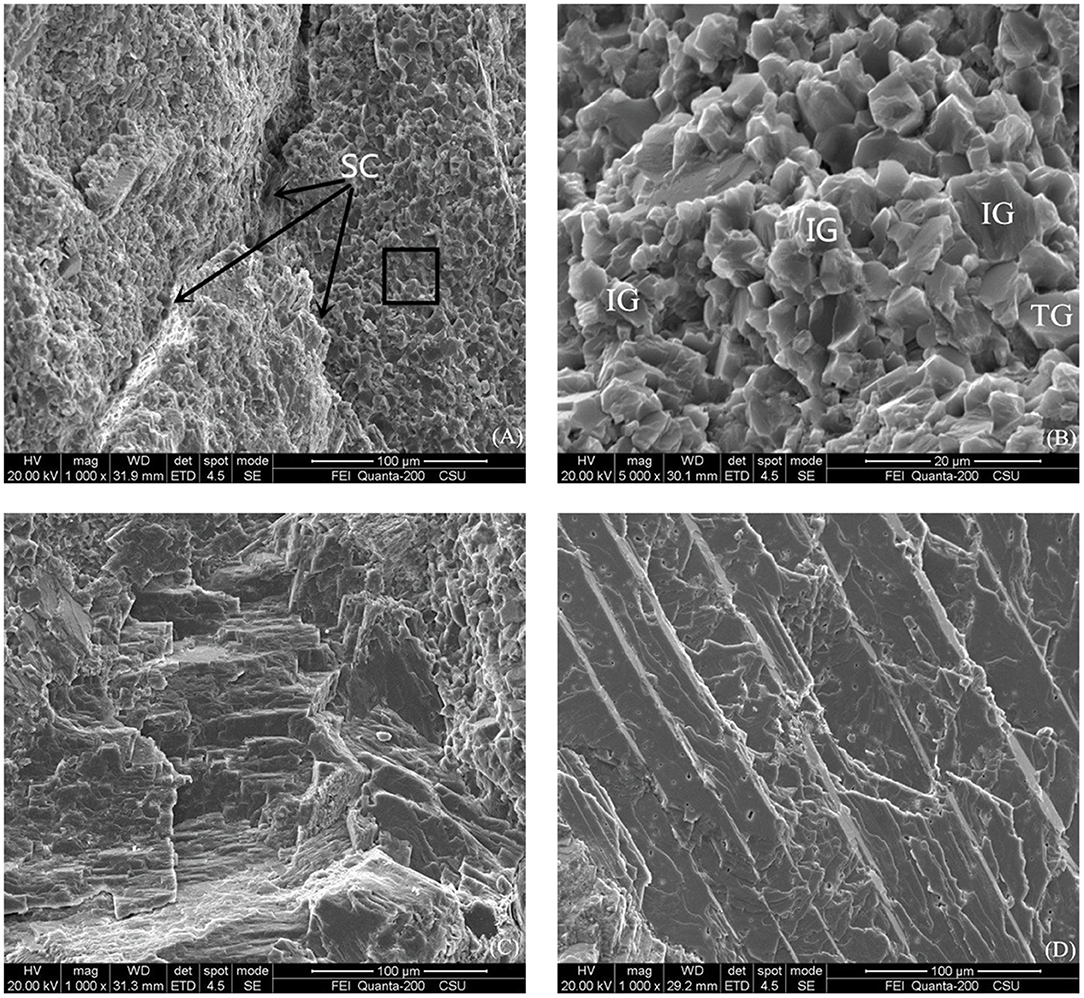
Figure 8. SEM photos of the fracture surfaces for limestone under Brazilian split test. (A) Secondary Cracks (SC) on the fracture surface; (B) inter-granular and trans-granular cracks; (C) coarse sidesteps on fracture surface; (D) smooth steps with streamline patterns on the fracture surface.
Rock AE signal frequency has a close relationship with its internal crack scale, by constructing the relevant earthquake model and simulating the earthquake process in the laboratory. It is concluded that the rupture scale (or magnitude) M0 is proportional to the −3 power of the frequency f. The scaling relation of size-frequency can be used to estimate the scale of the source of different frequency signals [12, 48, 49], and the relationship between source scale and frequency can be as follows [50]:
where dL is the laboratory length, fV is the laboratory frequency, dV is the source dimensions, and fV is the source dimensions.
The rock samples will be split along the center surface under Brazilian splitting loads, according to the above morphology. The cracks within rock samples mostly propagate along the grain boundaries or its internal discontinuous surfaces. On the one hand, the fracture scale is smaller due to its small-grained particles; on the other, it is accepted that AE signals exhibit a higher frequency in tensile mode compared with a lower frequency in shear mode [51–55], so the AE signals are dominated by high frequency signals under splitting loads. Moreover, the fixed rupture surface under Brazilian splitting loads reduces the opportunity of fracture along large-grained discontinuous surfaces, thus reducing the chance of producing low frequency signals. As mentioned above in the “Peak frequency distribution” section, the AE signals with peak frequencies of 100–300 kHz and over 300 kHz are in the majority, and the proportion of the signals with peak frequency of more than 300 kHz accounted for more than 50%. The signals with over 300 kHz are derived from the rupture of fracture dimension of < 2.5 mm based on the above equation, so the high frequency signals are mainly from the fracture of grain boundaries or grains whether in granite, marble, sandstone, or limestone. Lower frequency signals are mainly generated by large scale discontinuous surfaces within rock samples. For sandstone, however, the high frequency signals are also from the fracture of small-scale mineral grains, but the attenuation of elastic wave becomes greater due to higher porosity of sandstone. The attenuation of high frequency signal becomes faster in the sandstone medium, so AE signal frequency is mostly < 100 kHz. The micro-fracture characteristics of four type rocks under Brazilian split test are listed in Table 2.
The b-value of marble is the largest followed by sandstone, granite, and limestone, mainly determined by their compositions and internal structure. It was found in the microscopic morphology analysis that marble contains a large number of small mineral particles, and between dolomite and calcite granules are closely related mosaic crystal structures. Sandstone is composed of fine-grained particles and seldom has large size discontinuities, which account for a high proportion of small-scale ruptures. Granite has various large size mineral grains and defects or voids. Limestone contains a large number of joints during deposition, which would generate more large-scale ruptures. All of the above facts indicate that heterogeneity and internal structure of the rock material influence the G-R relationship.
Because the rock samples are subjected to tensile force of expansion under splitting loads, the cracks within samples always propagate along the weak surface. Due to gap or filled impurities between grains and grain boundaries, the strength of discontinuous surfaces will be greatly weakened, and these small-scale discontinuities will first be separated under the tensile stress, which also determines the macro-mechanism of rocks. Whether the separation of mineral grain boundaries or internal discontinuous surfaces, these fractures are all extended along the grain boundary. Therefore, rock samples show more preference for intergranular cracking from microlevel under the tensile stress, which is also the reason why the smooth fracture surfaces occur commonly in the microscopic morphologies of this paper. Because the length of cracks along the grain boundaries are small, a large number of higher frequency signals are generated. In addition, the fixed rupture surface under splitting loads reduces the opportunity of fracture along large-grained discontinuous surfaces, thus reducing the chance of producing low frequency signals. Therefore, large amounts of small-scale fractures along the fixed rupturing surface in the rock split loading test led to the collected AE signals being dominated by high frequency waveforms. It is notable that, due to the high porosity of sandstone, the attenuation of elastic wave is greater and the signal with high frequency is difficult to be collected by AE sensors, thus resulting in a relatively small proportion of high frequency signals.
The original contributions presented in the study are included in the article/Supplementary Material, further inquiries can be directed to the corresponding author/s.
LS and XQ are responsible for the implementation of the experiment and writing the main part of the paper. LY and CD are responsible for experiments and paper data processing and so on. LXil and LXib are responsible for the overall idea of the paper and the design of the experimental scheme. LXil was also responsible for writing part of the paper. All authors contributed to the article and approved the submitted version.
This study was funded by the Research Fund of The State Key Laboratory of Coal Resources and Safe Mining, CUMT (SKLCRSM21KF005).
The authors declare that the research was conducted in the absence of any commercial or financial relationships that could be construed as a potential conflict of interest.
The Supplementary Material for this article can be found online at: https://www.frontiersin.org/articles/10.3389/fphy.2021.591651/full#supplementary-material
1. Derek H. Fractography: Observing, Measuring, and Interpreting Fracture Surface Topography. Cambridgeshire: Cambridge University Press (1999).
2. Mogi K. Study of the elastic shocks caused by the fracture of heterogeneous materials and its relation to earthquake phenomena. Bull Earthq Res Inst. (1962) 40:125–73.
3. Scholz CH. The frequency-magnitude relation of microfracturing in rock and its relation to earthquakes. Bull Seismol Soc Am. (1968) 58:399–415.
4. Scholz CH. Experimental study of the fracturing process in brittle rock. J Geophys Res Atmosph. (1968) 73:1447–54. doi: 10.1029/JB073i004p01447
5. Scholz CH. Microfracturing and inelastic deformation of rock in compression. J. Geophys. Res. (1968) 73:1417–32. doi: 10.1029/JB073i004p01417
6. Chugh YP, Hardy HR Jr, Stefanko R. An Investigation of the Frequency Spectra of Microseismic Activity in Rock Under Tension, Proceedings Tenth Rock Mechanics Symposium. New York, NY: AIME (1972). p. 73–113.
7. Shiotani T, Ohtsu M, Ikeda K. Detection and evaluation of AE waves due to rock deformation. Construct Build Mater. (2001) 15:235–46. doi: 10.1016/S0950-0618(00)00073-8
8. He MC, Miao JL, Feng JL. Rock burst process of limestone and its acoustic emission characteristics under true-triaxial unloading conditions. Int J Rock Mech Mining Sci. (2010) 47:286–98. doi: 10.1016/j.ijrmms.2009.09.003
9. Peng H, Feng G, Zhang Z, Yang Y, Teng T. Evaluation method of rock brittleness based on acoustic emission and energy evolution. J China University Min Technol. (2016) 45:702–8.
10. Cai M, Kaiser PK, Morioka H, Minami M, Maejima T, Tasaka Y, et al. Flac/pfc coupled numerical simulation of AE in large-scale underground excavations. Int J Rock Mech Min Sci. (2007) 44:550–64. doi: 10.1016/j.ijrmms.2006.09.013
11. Willxam RW, James NB. Spectra of seismic radiation from a tensile crack. J Geophys Res. (1993) 98:4449–59. doi: 10.1029/92JB02414
13. Bucheim WW. Geophysical methods for the study of rock pressure in coal and potash salt mining. In: International Strata Control Congress. Leipzig (1958). p. 222.
14. David WE, van der Baan M, Birkelo B, Tary J-B. Scaling relations and spectral characteristics of tensile microseisms: evidence for opening/closing cracks during hydraulic fracturing. Geophys J Int. (2014) 196:1844–57. doi: 10.1093/gji/ggt498
15. Vinagradov SD. Acoustic Observations in Collieries of the Kizelsk Coal Basin. Bulletin (Izvestiya), Academy of Sciences of the USSR, Geophysics Series (1957).
16. Vinagradov SD. Experimental Study of the Distribution of Fractures in Respect to the Energy Liberated by the Destruction of Rocks. Bulletin (Izvestiya), Academy of Sciences of the USSR, Geophysical Series (1962). p. 171–80.
17. Ohnaka M, Mogi K. Correction to ‘frequency characteristics of acoustic emission in rocks under uniaxial compression and its relation to the fracturing process to failure’ by Mitiyasu Ohnaka and Kiyoo Mogi. J Geophys Res Atmospheres. (1982) 87:6975. doi: 10.1029/JB087iB08p06975
18. Mogi K. Magnitude-Frequency Relation for Elastic Shocks Accompanying Fractures of Various Materials and Some Related problems in Earthquakes (2nd Paper). Tokyo: Journal of university of Tokyo earthquake research institute (1962).
19. Dong LJ, Zou W, Li XB, Shu WW, Wang ZW. Collaborative localization method using analytical and iterative solutions for microseismic/acoustic emission sources in the rockmass structure for underground mining. Eng Fracture Mech. (2019) 210:95–112. doi: 10.1016/j.engfracmech.2018.01.032
20. Lockner DA, Byerlee JD, Kuksenko V, Ponomarev A, Sidorin A. Quasi-static fault growth and shear fracture energy in granite. Nature. (1991) 350:39–42. doi: 10.1038/350039a0
21. Goebel THW, Schorlemmer D, Becker TW, Dresen G, Sammis CG. Acoustic emissions document stress changes over many seismic cycles in stick-slip experiments. Geophys Res Lett. (2013) 40:2049–54. doi: 10.1002/grl.50507
22. Dong LJ, Johan W, Yves P, Li XB. Discriminant models of blasts and seismic events in mine seismology. Int J Rock Mech Min Sci. (2016) 86:282–91. doi: 10.1016/j.ijrmms.2016.04.021
23. Zang A, Wagner CF, Dresen G. Acoustic emission, microstructure, and damage model of dry and wet sandstone stressed to failure. J Geophys Res. (1996) 101:17507–22. doi: 10.1029/96JB01189
24. Srivatsan TS. A review of: “fractography: observing, measuring, and interpreting fracture surface topography, D. Hull.” Mater Manufact Process. (2009) 24:1229–30. doi: 10.1080/10426910902984033
25. Ravi-Chandar K, Knauss WG. An experimental investigation into dynamic fracture: II. Microstructural aspects. Int J Fract. (1984) 26:65–80. doi: 10.1007/BF01152313
26. Menendez B, David C, Darot M. A study of the crack network in thermally and mechanically cracked granite samples using confocal scanning laser microscopy. Phys Chem Earth Part A: Solid Earth Geod. (1999) 24:627–32. doi: 10.1016/S1464-1895(99)00091-5
27. Liu J, Li B, Tian W, Wu X, et al. Investigating and predicting permeability variation in thermally cracked dry rocks. Int J Rock Mech Mining Sci. (2018) 103:77–88. doi: 10.1016/j.ijrmms.2018.01.023
28. Li XW, Lan YR, Zou JX. A study of rock fractures. J China University Min Technol. (1983) 1983:18–24.
29. Xie HP, Chen ZD. Analysis of rock fracture micro-mechanism. J China Coal Soc. (1989) 1989:57–67.
30. Norton MG, Atkinson BK. Stress-dependent morphological features on fracture surfaces of quartz and glass. Tectonophysics. (1981) 77:283–95. doi: 10.1016/0040-1951(81)90267-5
31. Liu XM, Lee CF. Microfailure mechanism analysis and test study for rock failure surface. Chin J Rock Mech Eng. (1997) 16:509–13. doi: 10.13722/j.cnki.jrme.2014.0701
32. Liang CY, Wu SR, Li X. Reserch on micro-meso characteristics of granite fracture under uniaxial compression at low and intermedia strain rates. Chin J Rock Mech Eng. (2015) 2015:2977–86.
33. Kranz RL. Microcracks in rocks: a review. Tectonophysics. (1983) 100:449–80. doi: 10.1016/0040-1951(83)90198-1
34. Zhang QB, Zhao J. Effect of loading rate on fracture toughness and failure micromechanisms in marble. Eng Fracture Mech. (2013) 102:288–309. doi: 10.1016/j.engfracmech.2013.02.009
35. Zhang QB, Zhao J. Quasi-static and dynamic fracture behaviour of rock materials: Phenomena and mechanisms. Int J Fracture. (2014) 189:1–32. doi: 10.1007/s10704-014-9959-z
36. Mecholsky JJ, Mackin TJ. Fractal analysis of fracture in Ocala chert. J Mater Sci Lett. (1988) 7:1145–7. doi: 10.1007/BF00722319
37. Manthei G. Characterization of acoustic emission sources in a rock salt specimen under triaxial load. Bull Seismol Soc America. (2004) 95:1674–700. doi: 10.1785/0120040076
38. Alkan H, Cinar Y, Pusch G. Rock salt dilatancy boundary from combined acoustic emission and triaxial compression tests. Int J Rock Mech Min Sci. (2007) 44:108–19. doi: 10.1016/j.ijrmms.2006.05.003
39. Liu XL, Cui JH, Li XB, Liu Z. Study on attenuation characteristics of elastic wave in different types of rocks. Chin J Rock Mech Eng. (2018) 37:3223–30. doi: 10.13722/j.cnki.jrme.2017.0604
40. Gutenberg B, Richter CF. Frequency of earthquakes in California. Bull Seismol Soc Am. (1944) 34:185–8.
41. Qin SQ, Li ZD. Research on the fractal spatial distribution in space of rock acoustic emission events. Appl Acoustics. (1992) 11:19–21.
42. Liu X, Han M, He W, Li X, Chen D. A new b value estimation method in rock acoustic emission testing. J Geophys Res Solid Earth. (2020) 125:e2020JB019658. doi: 10.1029/2020JB019658
43. Grosse CU, Ohtsu M. Acoustic Emission Testing: Basics for Research-Applications in Civil Engineering. International Institute of Acoustics and Vibrations (2008). doi: 10.1007/978-3-540-69972-9
44. Majer EL, Doe TW. Studying hydrofractures by high frequency seismic monitoring. Int J Rock Mech Min Sci Geomech Abstr. (1986) 23:185–99. doi: 10.1016/0148-9062(86)90965-4
46. Winkler KW. Frequency dependent ultrasonic properties of high-porosity sandstones. J Geophys Res Solid Earth. (1983) 88:9493–9. doi: 10.1029/JB088iB11p09493
47. Mashinskii EI. Nonlinear amplitude frequency characteristics of attenuation in rock under pressure. J Geophys Eng. (2006) 3:291. doi: 10.1088/1742-2132/3/4/001
48. Wanniarachchi WAM, Ranjith PG, Perera MSA, Rathnaweera TD, Lyu Q, Mahanta B. Assessment of dynamic material properties of intact rocks using seismic wave attenuation: an experimental study. R Soc Open Sci. (2017) 4:170896. doi: 10.1098/rsos.170896
49. Burlini L, Vinciguerra S, Toro GD, De Natale G, Meredith P, Burg JP. Seismicity preceding volcanic eruptions: new experimental insights. Geology. (2007) 35:183–6. doi: 10.1130/G23195A.1
50. Benson PM, Vinciguerra S, Meredith PG, Young RP. Laboratory simulation of volcano seismicity. Science. (2008) 322:249–52. doi: 10.1126/science.1161927
51. Aggelis DG, Mpalaskas AC, Ntalakas D, Matikas TE. Effect of wave distortion on acoustic emission characterization of cementitious materials. Constr Build Mater. (2012) 35:183–90. doi: 10.1016/j.conbuildmat.2012.03.013
52. Aggelis DG, Matikas TE. Effect of plate wave dispersion on the acoustic emission parameters in metals. Comp Struct. (2012) 98–99:17–22. doi: 10.1016/j.compstruc.2012.01.014
53. Aggelis DG, Mpalaskas AC, Matikas TE. Investigation of different fracture modes in cement-based materials by acoustic emission. Cement Concrete Res. (2013) 48:1–8. doi: 10.1016/j.cemconres.2013.02.002
54. Aggelis DG. Classification of cracking mode in concrete by acoustic emission parameters. Mech Res Commun. (2011) 38:153–7. doi: 10.1016/j.mechrescom.2011.03.007
Keywords: Brazilian split tests, b-value, AE frequency characteristic, scanning electron microscope, micro-fracture morphology
Citation: Shengxiang L, Qin X, Xiling L, Xibing L, Yu L and Daolong C (2021) Study on the Acoustic Emission Characteristics of Different Rock Types and Its Fracture Mechanism in Brazilian Splitting Test. Front. Phys. 9:591651. doi: 10.3389/fphy.2021.591651
Received: 05 August 2020; Accepted: 26 March 2021;
Published: 24 May 2021.
Edited by:
Guoyang Fu, Monash University, AustraliaReviewed by:
Hai Pu, China University of Mining and Technology, ChinaCopyright © 2021 Shengxiang, Qin, Xiling, Xibing, Yu and Daolong. This is an open-access article distributed under the terms of the Creative Commons Attribution License (CC BY). The use, distribution or reproduction in other forums is permitted, provided the original author(s) and the copyright owner(s) are credited and that the original publication in this journal is cited, in accordance with accepted academic practice. No use, distribution or reproduction is permitted which does not comply with these terms.
*Correspondence: Liu Xiling, bHhsZW5nbGlzaEAxNjMuY29t
Disclaimer: All claims expressed in this article are solely those of the authors and do not necessarily represent those of their affiliated organizations, or those of the publisher, the editors and the reviewers. Any product that may be evaluated in this article or claim that may be made by its manufacturer is not guaranteed or endorsed by the publisher.
Research integrity at Frontiers

Learn more about the work of our research integrity team to safeguard the quality of each article we publish.