 Ruslan M. Sarimov
 Vasily N. Lednev1
 Sergey V. Gudkov
94% of researchers rate our articles as excellent or good
Learn more about the work of our research integrity team to safeguard the quality of each article we publish.
Find out more
BRIEF RESEARCH REPORT article
Front. Phys. , 28 January 2021
Sec. Interdisciplinary Physics
Volume 8 - 2020 | https://doi.org/10.3389/fphy.2020.640887
This article is part of the Research Topic Gas, Liquid and Solid Nanoparticles in Aqueous Media and their Possible Applications in Medicine and Biology View all 20 articles
Using Fluorescence Spectrometer Lumina, fluorescence spectra of surface slices of apples and potatoes were measured. Some of the samples were healthy, some were infected: apples had scabs, potatoes had rot and mechanical damage. For apples, two zones were found where the emission spectra of healthy and scab-affected samples differed significantly from each other. This is the region of 400–450 nm with excitation of 300–350 nm, as well as the region of 680–750 nm with excitation of 400–450 nm. For potatoes, the differences between a healthy and rot-affected sample were found only in the region of 400–450 nm with excitation at 300–350 nm. The found differences are clearly manifested in the correlation coefficients between the spectra - the minimum correlation coefficient for healthy apples and scab at 450 nm excitation r = 0.51. Also, healthy and diseased samples are well separated using principal component analysis (PCA). The revealed differences in the fluorescence spectra can be used for the detection and separation of diseased and healthy fruits and vegetables.
The growth of the planet's population leads to a quantitative and qualitative increase in technologies used in agriculture. Fluorescence spectroscopy is one of the high-tech solutions in this field. Fluorescence is used to analyze the quality of fruits [1], diagnose plant diseases [2, 3], obtain information about the influence of environmental stress factors [3–7], about the concentration of chlorophyll in the leaves of crops [8]. Usually, the analysis uses the ratios of the intensities of the fluorescence peaks in the blue 440 nm, green 520 nm, red 680 nm, and far red 740 nm regions [9]. Many vegetative indices have been invented, using mainly these peaks, to detect diseases in spectroscopic studies [10]. Blue-green fluorescence is associated mainly with phenolic compounds [11]. The latter are usually localized in the cell wall [12, 13] and perform mainly antioxidant functions and functions of protectors of fungal and viral diseases [14]. The red and far red fluorescence region is associated with chlorophyll, which is contained in chloroplasts - compartments of eukaryotic cells responsible for photosynthesis [11].
Today, the advent of cheap and sensitive detectors has led to the appearance of portable devices that can diagnose the content of anthocyanins, flavonols and chlolrophyll in fruits and leaves with an accuracy comparable to laboratory studies [15]. With the development of video technologies, methods appear that use not only the spectrally obtained ratios of the above peaks. Recently, the methods of multispectral or hyperspectral imaging have been actively developed [10, 16, 17]. These methods are based on the detection of spectral information not only in the visible, but also in the UV and IR ranges, while the information is usually taken from a sufficiently large area of the object under study. The resulting large amount of spectral information needs to be processed. The most commonly used data reduction methods are principal component analysis (PCA), various discriminant analysis (DA) methods, and artificial neural networks (ANN). The methods used for processing spectral information are often used to separate plants and their fruits by quality and for early diagnosis of diseases.
One of these diseases - apple scab, caused by the fungus Venturia inaequalis, is considered the most serious disease of the apple tree [18]. Although fluorescence as a method is widely used in agriculture, there is no work devoted to the use of fluorescence for the diagnosis of this disease. There are about a dozen matches in the WoS database using “apple scab”/”venturia inaequalis” and “fluorescence”. Basically, fluorescence imaging was used in conjunction with other methods (reflection, thermography in IR), and the work was carried out on apple leaves [19, 20]. The situation is similar for potato root or other potato diseases. However, in recent years, studies have begun to appear that use fluorescence to diagnose fungal diseases or substances harmful to humans in potato tubers [21, 22].
In our opinion, the fluorescence spectra of the main diseases of fruit crops are certainly of interest not only from a scientific point of view, but also for solving many applied problems in the agricultural industry. The main goal of the work is to determine the optimal zones of excitation and emission in the UV and light range using a precision laboratory fluorimeter for diagnostics in order to separate/quantify diseases (scab and rot) and damage to the surface tissues of fruit and vegetable crops (apples, potatoes).
Studying the fluorescence of apples and potatoes using the Fluorescence Spectrometer Lumina. Precision fluorescence measurements of apples and potatoes were performed using a Fluorescence Spectrometer Lumina (Thermo Scientific, Waltham, Massachusetts, United States). The radiation source of the fluorimeter is a 150 W xenon lamp. The spectral width of the slit of the excitation and registration monochromators during the measurement of the spectra was 5 nm. Voltage across PMT (Photomultiplier tube) 800 V, integration time 20 ms, scan time 1,200 nm/min. Cuts from the surface (peel) of apples (Figures 1A,B) and potatoes (Figures 2A–C) were used as samples. In the device, the excitation inlet and emission outlet are at an angle of 90°; therefore, a standard quartz cuvette (10 × 10 × 45 mm) transparent on all sides was used as a sample holder. Sections of superficial tissues (skin with epidermis trapping) ∼0.5 mm thick using quartz plates ∼12 mm wide were fixed along the diagonal of a quartz cuvette at the beam height and placed in the sample holder of the device.
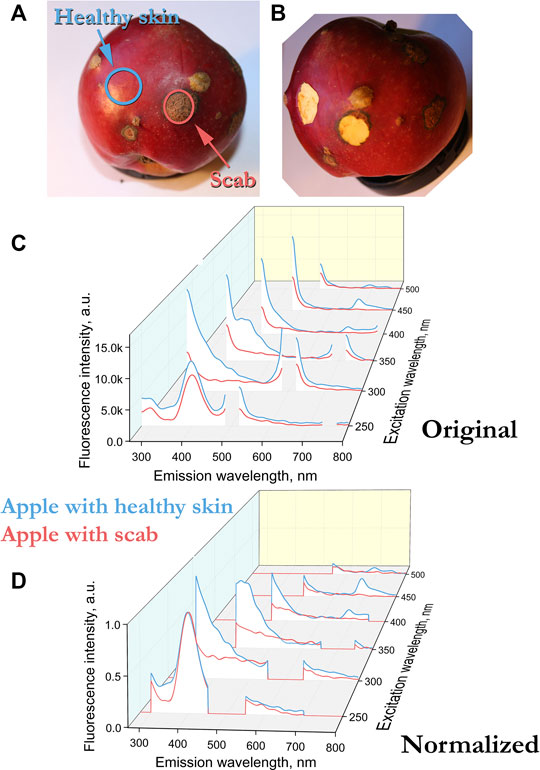
FIGURE 1. (A) Senator apple with scab infestation. The surface layer was examined and cut off, the cut contour is indicated in the photograph by a solid line. (B) Apple after sampling. (C) Fluorescence spectra of uninfected (blue) and scab-infected (red) surfaces of Senator apples. (D) Normalized peak height at 400 nm (excitation 250 nm) fluorescence spectra of Senator apples.
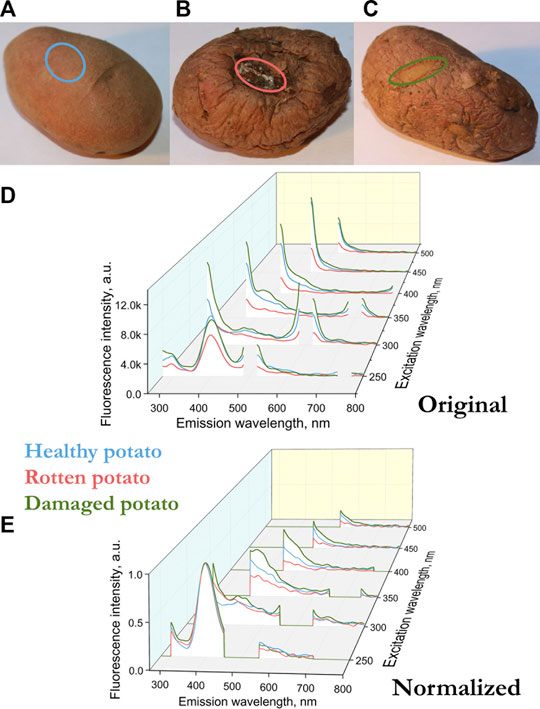
FIGURE 2. (A) Sampling areas for healthy potatoes (blue), (B) when rotting (red), (C) a place of mechanical damage, a new skin has grown in place of the damaged one (green). (D) Fluorescence spectra of the surface of the potato variety Kumach (blue), with rotting (red), a place of mechanical damage with a new skin (green). (E) Normalized by the height of the peak at a wavelength of 400 nm (excitation 250 nm) fluorescence spectra of the surface of the potato variety Kumach.
Samples of horticultural crops. We used apples of the Senator variety with scab, potatoes of the Kumach variety, some of the potatoes had mechanical damage and new skin in their place, some of the potato tubers (“potato tuber”) were subject to rotting caused by fungi (fusarium wilt). Before use, the apple samples were kept in the refrigerator for a long time (∼1–2 months). Potatoes were kept in the dark (∼1–2 months) at room temperature. Before measurements, the samples were exposed to light at room temperature for 2–3 h. Slices of apple and potatoes were made immediately before measurements. Measurement time for one sample ∼20 min. During this time, the fluorescence spectra of the samples did not change significantly.
Processing and analysis of the main components of fluorescence spectra. Usually, to compare the spectra of different samples, they are normalized. Due to small changes in the spatial arrangement of the samples, their fluorescence spectra can differ significantly. Normalization can be done in several ways. One of them is the spectrum area normalization. In this case, the area under any spectrum is equal to one. This normalization works well when the fluorescence spectra (peaks at certain frequencies) are similar for the samples, and the difference in peak amplitude arises from differences in spatial arrangement.
In our case, the fluorescence spectra differ not only in amplitude, but also in the presence of peaks. For example, for an apple sample infected with scab, there is no peak at 680 nm, which is in the control sample in the spectrum with excitation at 400–450 nm (Figure 1C). In such cases, normalization is usually performed by the peak, that is, the intensity of the most pronounced peak is taken as a unit. In our case, the peak for all apple and potato samples is observed at 400 nm with excitation at 250 nm. The fluorescence can depend on both the geometry of the object and the number of fluorescent molecules. By normalizing to the 400 nm peak at 250 nm excitation, we compare different samples in geometry and in the number of fluorescent molecules, which makes it possible to compare spectra at other excitation lengths of 300–500 nm.
To compare a set of spectra and their classification, spectral analysis usually uses methods that reduce data and select the most significant ones. The most popular of these is Principal Component Analysis (PCA). The method replaces similar correlated spectral variables with fewer uncorrelated linear combinations covering most of the data variation. Principal component analysis was performed using Statistica (Stat Soft) software.
Figures 1C and 2D show the fluorescence spectra of apple and potato surfaces. In order to be able to compare the spectra at different wavelengths, the measurements were performed without using filters. Because of this, it was necessary to shift the beginning of emission spectra measurements by 30 nm from the exciting radiation and make a gap in the spectrum at the place of the second order of excitation. Discontinuities in the graphs (Figures 1, 2) at wavelengths of 500 ± 30, 600 ± 30,700 ± 30, 800 ± 30 nm are due to the presence of a high-intensity second-order excitation from radiation in the wavelength range of 250–400 nm. One of the simplest methods for comparing multiple spectra is to find and analyze their correlations. Table 1 shows the correlation coefficients for the spectra excited at different wavelengths for apple (top) and potato (bottom). The smallest correlation, and, consequently, the largest differences, were found for an apple for excitation wavelengths of 300–350 nm, and for potatoes for 300 nm. Figures 1D and 2E show the normalized spectra for apple and potato samples. In addition to direct normalization, the spectral regions associated with the first, second (for 250–400 nm excitation) and third (for 250 nm excitation) orders of the incident radiation were expanded (up to 50 nm) and zeroed. The normalization procedure brightened the differences between the apple samples (Figure 1D). This is especially noticeable upon excitation at 450 nm, where the correlation coefficient decreased from 0.98 to 0.51 (Table 1).
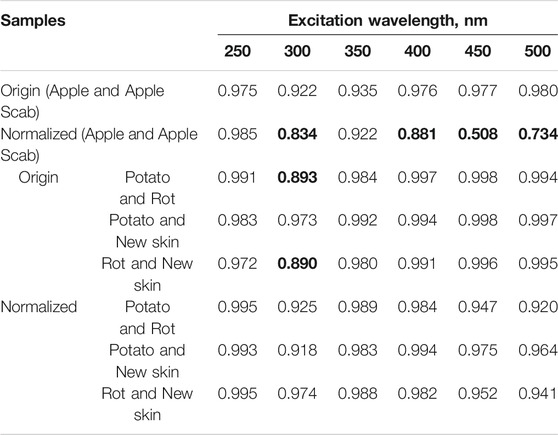
TABLE 1. Correlation coefficients of the spectra of a healthy apple surface and an infected scab for excitations with different wavelengths (highlighted in gray). Below are the correlation coefficients of the spectra of the healthy surface of potatoes, potatoes prone to rot and the place of new skin after mechanical damage. Correlation coefficient values <0.9 are marked in bold.
Figure 3 shows the results of principal component analysis for apple (Figure 3A) and potato (Figure 3B) for the original and normalized data. Here the 530-dimensional space (emission wavelength from 270 to 800 nm) is reduced to a two-dimensional representation covering more than 50% of the original dispersion. To avoid a discontinuity in the data in the PCA analysis (the beginning of the emission spectra and the second-order excitation zone in Figures 1, 2), the intensity values in these zones were taken to be zero, as in Figures 1D and 2E. Figure 3 shows the data normalization improves data separation using the PCA method. The main contribution to the separation of the healthy apple and apple surfaces with scab is made by measurements at excitation of 300 nm and, to a lesser extent, at 350 and 450 nm. In addition, data normalization increased the variance described by the first two components PC1 and PC2, from 50.8 to 62.2%. The main differences in the emission spectra of a healthy and scab-infected apple lie in the range of 400–450 nm with excitation of 300–400 nm, as well as in the wavelength range of 680–750 nm with excitation of 400–500 nm. In general, the use of the PCA method (Figure 3) gives a similar picture with the earlier analysis of correlations (Table 1).
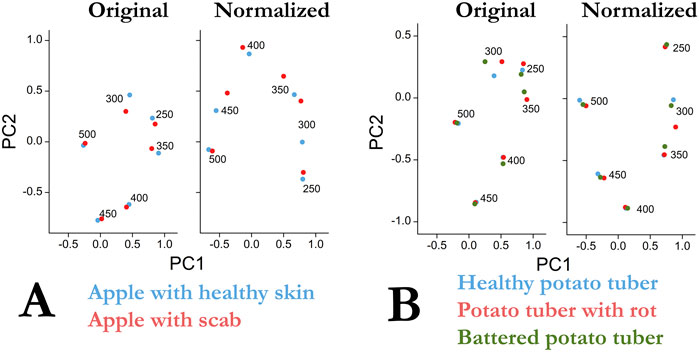
FIGURE 3. (A) Results of principal component analysis of primary data and after normalization for uninfected (blue) and infected scab (red) Senator apple samples. (B) Results of the analysis of the main components of the primary data and after normalization for potato samples of the Kumach variety (blue), with rotting (red), the place of mechanical damage with a new skin (green).
In contrast to apple, the application of PCA to potato tubers leads to visible differences only at excitation of 300 nm (Figure 3 on the right). In this case, the normalization procedure increases the variance described by the first two components PC1 and PC2 from 51.4 to 63.0%. Interestingly, this result is not consistent with the correlation analysis where normalizing the data increased the correlation coefficients between control/broken and rotting potatoes (Table 1).
The emission spectra of apple peels excited in the UV and blue-green regions are generally similar to the emission spectra of green leaves [4, 7]. Upon excitation at 350 nm, the emission spectra of apple peel (Figures 1, 3) and leaves have a maximum in the region of 440 nm. However, there are also differences. Excitation of the apple in near UV does not expose the peaks associated with chlorophyll (680–740 nm). Earlier, it was shown for leaves that the ratio of the intensities of the peaks 740/680 depends on the chlorophyll concentration [8]. The presence of a peak at 680 and no peak at 740 nm with excitation of 400–450 nm confirms the presence of a small amount of chlorophyll in a healthy apple sample. The absence of a chlorophyll peak in a sample infected with scab (Figure 3, excitation at 450 nm, emission at 680 nm) indicates three possible variants: chlorophyll is destroyed in the area affected by the scab, the scab screens the excitation, or the emission is “quenched” by the scab. In any case, the observed differences in the emission spectra in the 680 nm region at an exposure of 400–450 nm are convenient and can be used for the problems of diagnostics and separation of healthy and diseased fetuses.
For potatoes, in the region of chlorophyll fluorescence (680–740 nm), no peaks were found in any of the samples (Figure 2). The absence of chlorophyll in the presented potato samples can be a good starting point for spectral detection of solanine, a poisonous glycoside, which is actively synthesized in potatoes together with chlorophyll under the influence of solar set [23]. It is noteworthy, but there are already works that use hyperspectral fluorescence methods to predict the solanine content in potato tubers [21]. For another spectral range in the blue-green spectrum (400–520 nm), there are many fluorophores that can induce fluorescence in plants [11]. Apple and potato fluorescence (Figures 1, 2) fluorescence in the green region of ∼520 nm is much lower than the fluorescence peak in the 400–440 region with excitation at 300–350 nm. The peaks in this range may be due to the fluorescence of cinnamic acids (ferulic, sinapic and caffeic acid), chlorogenic acid, coumarin acids (esculetin and scopoletin) (coumarins aesculetin) and scopoletin, stilbenes [11, 13, 24] And if the maximum of the fluorescence peak for the presented acids lies in the range of 440–450 nm, for stilbenes the maximum lies in the region of 400 nm [11].
As already noted, all of the above substances are used by plants for antioxidant protection, as well as for protection against viruses and fungi [14]. From the point of view of identifying causal relationships, it is interesting to trace the development of diseases in the early stages and find out whether the occurrence of scab and rot on fruits is associated with initially lower levels of flavonoid concentration or the development of the disease led to a significant decrease in fluorescence peaks in the blue-green area (Figures 1D, 2E).
The data obtained already now make it possible to single out the range of excitation and emission necessary for the problems of detecting “bad” fetuses. In further studies with multiple samples, it is planned to additionally confirm the validity of the data obtained. Already at this stage of research, it is possible to draw several conclusions on the mathematical methods of data processing and separation. In the case of pronounced peaks in one sample and their absence in the other (peak at 680 nm in Figure 1D), the spectra are well separated and codified using the usual correlation coefficient (Table 1 data for an apple at 450 nm). However, when there are no pronounced peaks (Figure 2E), the correlation coefficients (Table 1 data for potatoes 300 nm), although different, do not provide reliable grounds for separating the data. In this case, the use of PCA is a necessary procedure and the results for potatoes confirm this (Figure 3, normalized). A small variance ∼60% of the first two components PC1 and PC2 for both apple and potatoes is certainly not a very good indicator. For comparison, in ref. 2, the variance of only the first component of PC1 was 89%. The low dispersion of the main components in our work is a consequence of the presence of many zero points in the spectra (Figures 1D, 2E), which arose due to the need to work without a filter to compare spectral data in a wide range of excitation and emission.
The spectra obtained on the healthy surface of the apple and from the area affected by scab differ significantly from each other. Especially in the blue–green region (400–450 nm) at 300–350 nm excitation, as well as in the red–far red region (680–740 nm) at 400–450 nm excitation. With scab disease in the blue-green area, there is a decrease in the concentration of phenolic compounds, which usually play a key role in antiviral and antifungal protection. It should be noted that the chlorophyll peak (680 nm, at 450 nm excitation) is almost completely absent on the scab-affected area of the apple in the red region. This is probably the best marker for scab detection. For potatoes, a significant difference in the spectra of the samples was revealed only for the blue-green region (400–450 nm, at 350 nm excitation). Under these conditions, the spectrum of a sample of a potato tuber affected by rot differs most significantly from the spectrum of a healthy potato tuber.
The raw data supporting the conclusions of this article will be made available by the authors, without undue reservation.
RS and VL conducting experiments. AS work with phytopathogens and biosamples. RS and SG discussion and article writing.
This work was supported by a grant of the Ministry of Science and Higher Education of the Russian Federation for large scientific projects in priority areas of scientific and technological development (grant number 075-15-2020-774).
The authors declare that the research was conducted in the absence of any commercial or financial relationships that could be construed as a potential conflict of interest.
The authors are grateful to the Center for Collective Use of the GPI RAS for the equipment provided.
1. Noh HK, Lu RF. Hyperspectral laser-induced fluorescence imaging for assessing apple fruit quality. Postharvest Biol. Technol (2007) 43(2):193–201. doi:10.1016/j.postharvbio.2006.09.006
2. Saleem M, Atta BM, Ali Z, Bilal M. Laser-induced fluorescence spectroscopy for early disease detection in grapefruit plants. Photochem. Photobiol. Sci (2020) 19(5):713–21. doi:10.1039/c9pp00368a
3. Belasque J, Gasparoto MC, Marcassa LG. Detection of mechanical and disease stresses in citrus plants by fluorescence spectroscopy. Appl. Opt (2008) 47(11):1922–6. doi:10.1364/ao.47.001922
4. Lichtenthaler HK, Miehé JA. Fluorescence imaging as a diagnostic tool for plant stress. Trends Plant Sci (1997) 2(8):316–20. doi:10.1016/S1360-1385(97)89954-2
5.Nutrient stress of corn plants: early detection and discrimination using a compact multiwavelength fluorescent lidar. In: Samson G, Tremblay N, Dudelzak A, Babichenko S, Dextraze L, and Wollring J, editors. Proceedings of the 20th EARSeL symposium; 2000 Jun 16–17. Dresden, Germany: EARSeL (2000). p. 214–23.
6. Chappelle EW, McMurtrey JE, Wood FM, Newcomb WW. Laser-induced fluorescence of green plants. 2: LIF caused by nutrient deficiencies in corn. Appl. Opt (1984) 23(1):139–42. doi:10.1364/ao.23.000139
7. Chappelle EW, Wood FM, McMurtrey JE, Newcomb WW. Laser-induced fluorescence of green plants. 1: a technique for the remote detection of plant stress and species differentiation. Appl. Optic (1984) 23(1):134–8. doi:10.1364/ao.23.000134
8. Hák R, Lichtenthaler HK, Rinderle U. Decrease of the chlorophyll fluorescence ratio F690/F730 during greening and development of leaves. Radiat. Environ. Biophys (1990) 29(4):329–36. doi:10.1007/bf01210413
9. Buschmann C, Langsdorf G, Lichtenthaler HK. Imaging of the blue, green, and red fluorescence emission of plants: an overview. Photosynthetica (2000) 38(4):483–91. doi:10.1023/a:1012440903014
10. Sankaran S, Mishra A, Ehsani R, Davis C. A review of advanced techniques for detecting plant diseases. Comput. Electron. Agric (2010) 72(1):1–13. doi:10.1016/j.compag.2010.02.007
11. Lang M, Stober F, Lichtenthaler HK. Fluorescence emission spectra of plant leaves and plant constituents. Radiat. Environ. Biophys (1991) 30(4):333–47. doi:10.1007/bf01210517
12. Harris PJ, Hartley RD. Detection of bound ferulic acid in cell walls of the Gramineae by ultraviolet fluorescence microscopy. Nature (1976) 259(5543):508–10. doi:10.1038/259508a0
13. Lichtenthaler HK, Schweiger J. Cell wall bound ferulic acid, the major substance of the blue-green fluorescence emission of plants. J. Plant Physiol (1998) 152(2–3):272–82. doi:10.1016/s0176-1617(98)80142-9
14. Vermerris W, Nicholson R. Phenolic compound biochemistry. Berlin/Heidelberg, Germany: Springer Science & Business Media (2007).
15. Cerovic ZG, Moise N, Agati G, Latouche G, Ben Ghozlen N, Meyer S. New portable optical sensors for the assessment of winegrape phenolic maturity based on berry fluorescence. J. Food Compos. Anal (2008) 21(8):650–4. doi:10.1016/j.jfca.2008.03.012
16. Lorente D, Aleixos N, Gomez-Sanchis J, Cubero S, Garcia-Navarrete OL, Blasco J. Recent advances and applications of hyperspectral imaging for fruit and vegetable quality assessment. Food Bioprocess Technol (2012) 5(4):1121–42. doi:10.1007/s11947-011-0725-1
17. Gowen AA, O'Donnell CP, Cullen PJ, Downey G, Frias JM. Hyperspectral imaging–an emerging process analytical tool for food quality and safety control. Trends Food Sci. Technol (2007) 18(12):590–8. doi:10.1016/j.tifs.2007.06.001
18. Bowen JK, Mesarich CH, Bus VG, Beresford RM, Plummer KM, Templeton MD. Venturia inaequalis: the causal agent of apple scab. Mol. Plant Pathol (2011) 12(2):105–22. doi:10.1111/j.1364-3703.2010.00656.x
19. Delalieux S, Auwerkerken A, Verstraeten WW, Somers B, Valcke R, Lhermitte S, et al. Hyperspectral reflectance and fluorescence imaging to detect scab induced stress in apple leaves. Remote Sens (2009) 1(4):858–74. doi:10.3390/rs1040858
20. Belin E, Rousseau D, Boureau T, Caffier V. Thermography versus chlorophyll fluorescence imaging for detection and quantification of apple scab. Comput. Electron. Agric (2013) 90:159–63. doi:10.1016/j.compag.2012.09.014
21. Lu B, Sun J, Yang N, Hang YY. Fluorescence hyperspectral image technique coupled with HSI method to predict solanine content of potatoes. J. Food Process. Preserv (2019) 43(11):9. doi:10.1111/jfpp.14198
22. Xie KZ, Yue Y, Qiu HZ. Effects of infection by Fusarium tricinctum on photosynthetic and chlorophyll fluorescence characteristics of potato. Basic Clin. Pharmacol. Toxicol (2020) 126:433–4.
23. Jadhav SJ, Sharma RP, Salunkhe DK. Naturally occurring toxic alkaloids in foods. Crit. Rev. Toxicol (1981) 9(1):21–104. doi:10.3109/10408448109059562
Keywords: fluorescence spectroscopy, principal component analysis, detection of scab, detection of rot, separation of diseased and healthy fruits and vegetables
Citation: Sarimov RM, Lednev VN, Sibirev AV and Gudkov SV (2021) The Use of Fluorescence Spectra for the Detection of Scab and Rot in Fruit and Vegetable Crops. Front. Phys. 8:640887. doi: 10.3389/fphy.2020.640887
Received: 12 December 2020; Accepted: 29 December 2020;
Published: 28 January 2021.
Edited by:
Nikolai F. Bunkin, Bauman Moscow State Technical University, RussiaReviewed by:
Nikolay Molochkov, Institute of Theoretical and Experimental Biophysics (RAS), RussiaCopyright © 2021 Sarimov, Lednev, Sibirev and Gudkov. This is an open-access article distributed under the terms of the Creative Commons Attribution License (CC BY). The use, distribution or reproduction in other forums is permitted, provided the original author(s) and the copyright owner(s) are credited and that the original publication in this journal is cited, in accordance with accepted academic practice. No use, distribution or reproduction is permitted which does not comply with these terms.
*Correspondence: Ruslan M. Sarimov, cnVzYUBrYXBlbGxhLmdwaS5ydQ==
Disclaimer: All claims expressed in this article are solely those of the authors and do not necessarily represent those of their affiliated organizations, or those of the publisher, the editors and the reviewers. Any product that may be evaluated in this article or claim that may be made by its manufacturer is not guaranteed or endorsed by the publisher.
Research integrity at Frontiers
Learn more about the work of our research integrity team to safeguard the quality of each article we publish.