- 1Prokhorov General Physics Institute of the Russian Academy of Sciences, Moscow, Russia
- 2MIREA - Russian Technological University, Moscow, Russia
- 3V.M. Gorbatov Federal Research Center for Food Systems of Russian Academy of Sciences, Moscow, Russia
The evolution of the size distribution of nanoparticles depending on the concentration of nanoparticles in a colloidal solution is investigated. The formation of new stable distributions shifted relative to the initial distribution is directly related to the processes of agglomeration of nanoparticles. Using successive two-fold dilutions of nanoparticles by 2–32 times, it was shown that the maximum of the nanoparticle size distribution shifts toward smaller sizes with a decrease in the concentration of nanoparticles, both for distributions by the number of nanoparticles and for distributions by mass of nanoparticles. Thus, with dilutions, the relative concentration of individual nanoparticles increases, while the number of particles in one aggregate decreases. A mathematical model has been created that predicts a change in distribution with a change in the concentration of nanoparticles in a colloid.
Introduction
Currently, the technique of laser ablation of metal targets in a liquid is a widespread method for producing nanoparticles [1–3]. Particle sizes obtained using this technique range from a few nanometers to tens of microns. One of the main characteristics of colloidal solutions of nanoparticles obtained by laser ablation in liquids is the size distribution of the number of nanoparticles. Typically, the distribution of nanoparticles is a unimodal lognormal distribution. However, there are cases in which the particle distribution becomes multimodal [4, 5].
Particles in a colloid are in constant motion and interact with each other forming stable agglomerates that contribute to the size distribution. After some time, the distribution of nanoparticles ceases to change, because the processes of creation and disintegration of agglomerates begin to balance each other [6–8]. The size distribution of nanoparticles in a colloidal solution can also change under the influence of various factors: temperature, nanoparticle size, concentration, and the type of solvent [9].
It is also known that non-metallic compounds are also unstable in aqueous solutions. For example, aqueous solutions of C60 fullerene form large aggregates several hundred nanometers in size [10]. It was found that the stabilization of such solutions is possible with the use of surfactants [11, 12], ultrasonic [13] or laser [14] treatment of the solution. It is assumed that a similar effect on the stability of solutions can be observed in the another anisotropic systems [15–18].
Obviously, the agglomeration process affecting the dynamics of the distribution of nanoparticles should depend on the initial concentration of nanoparticles in the colloid, since the probability of collision of particles with each other, and hence the rate of formation of agglomerates, directly depends on the concentration of particles in the colloid. The aim of this work is to experimentally study the effect of the concentration of nanoparticles in a colloid on the evolution of the size distribution of nanoparticles and to build a model that predicts changes in the distribution.
Methods
The Fe and Cu nanoparticles used in this work were obtained using the laser ablation technique in the water. The parameters of the laser radiation were selected so that the initial distribution of nanoparticles had a known average nanoparticle sizes. The greatest influence on the distribution of nanoparticles is exerted by the pulse duration and pulse energy. Radiation from a Nd: YAG laser (λ = 1,064 nm, τ = 100 ns, ν = 10 kHz, ε = 1 mJ) was focused using a system of lenses and mirrors onto the surface of a metal target placed in a flow glass cell. The flow cell was used to avoid fragmentation processes during nanoparticle generation. The distance from the water surface to the metal target was 1 mm. Pumping rate 150 ml per minute with a 10 mm2 flow section. The volume of water is 200 ml. the colloid production time was 20 min, the colloid was drained and clean water was poured into the system. The total volume of the colloid was 1 L. Details of the preparation of nanoparticles were described earlier [19]. Obtained colloidal solutions were analyzed using a DC24000 disk centrifuge (CPS Instruments). Thus, data were collected on the initial size distributions of nanoparticles. The resulting colloids were concentrated at room temperature to a volume of 50 ml using a rotary vacuum evaporator. Thus, a high concentration of nanoparticles was achieved. For iron, the concentration of nanoparticles in the initial colloid was approximately n = 660 μg/ml, for copper − n = 990 μg/ml. Concentrated colloidal solutions of Fe and Cu nanoparticles were successively diluted 2, 4, 8, 16, 32 times in deionized water (series 2n). To avoid hydrodynamic processes, dilutions were carried out in an ultrasonic bath VBS-3D (Vilitek, Russia) with ultrasonic power 120 W. The colloidal solution was placed in an ultrasonic bath for 5 min. One hour after dilution of the colloid, a new distribution was recorded on the disc centrifuge. The described procedure was applied to each step of the dilution of colloids of Fe and Cu nanoparticles. In some cases, a 200FE transmission electron microscope (Carl Zeiss) was used to confirm the size of nanoparticles. TEM micrographs were processed using the ImageJ software.
Results and Discussion
Figures 1 and 2 show TEM images of iron and copper nanoparticles, as well as size distributions reconstructed from TEM images of nanoparticles. For comparison, images of iron and copper nanoparticles in the original colloid and the colloid diluted 8 times are shown. In both cases, a shift of the distribution maximum toward smaller sizes is observed with a decrease in the concentration of nanoparticles in the colloid.
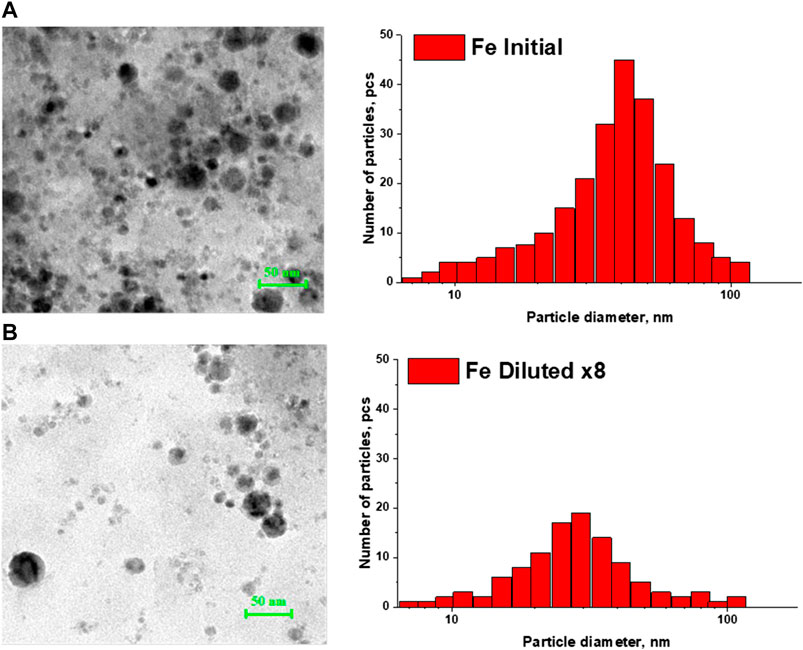
FIGURE 1. TEM - images of iron nanoparticles and their calculated nanoparticle size distributions in: (A) initial colloid; (B) colloid diluted 8 times.
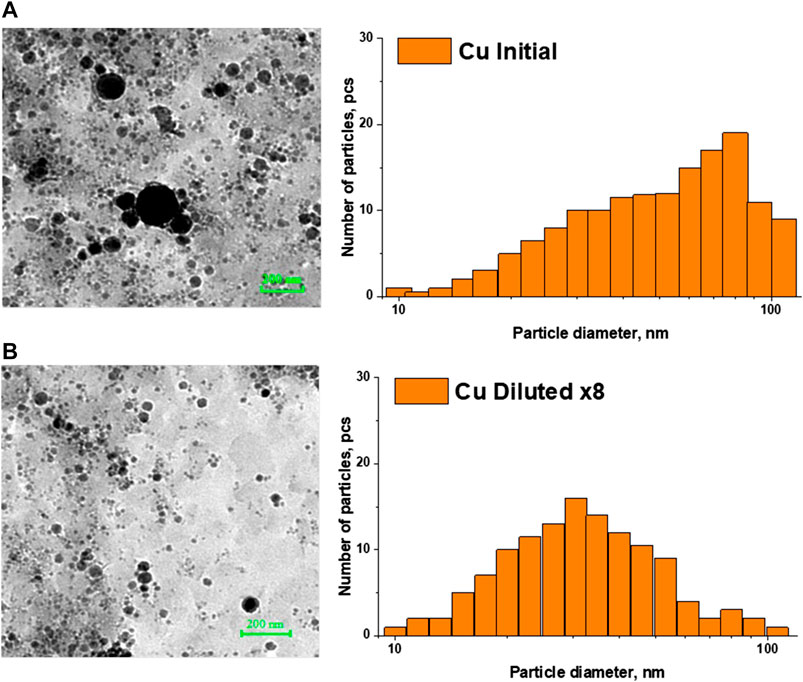
FIGURE 2. TEM - images of iron nanoparticles and reconstructed nanoparticle size distributions in: (A) the initial colloid; (B) colloid diluted 8 times.
Figures 3 and 4 demonstrate the distributions of Fe nanoparticles, obtained using a disk centrifuge, by the number of pieces and by weight, respectively, depending on the size of the nanoparticles. Figure 3 shows that the initial colloidal solution of nanoparticles has the largest number of particles with a diameter of 43 nm. When the colloidal solution of nanoparticles is diluted, a gradual decrease in the number of particles and a shift in the distribution maxima toward smaller sizes occur simultaneously. With a 32-fold dilution, the distribution maximum shifts to the left and is in the region of 33 nm.
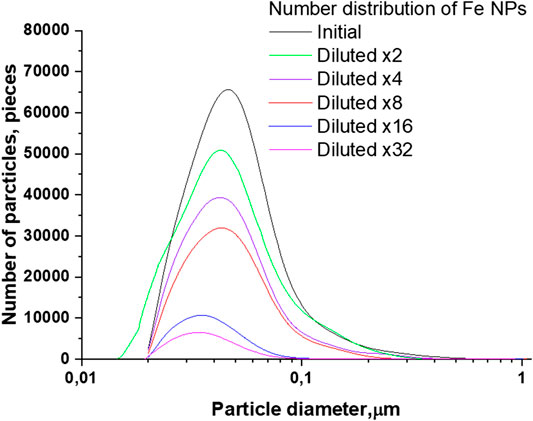
FIGURE 3. Size distribution of Fe nanoparticles depending on the amount of dilutions of the initial colloid.
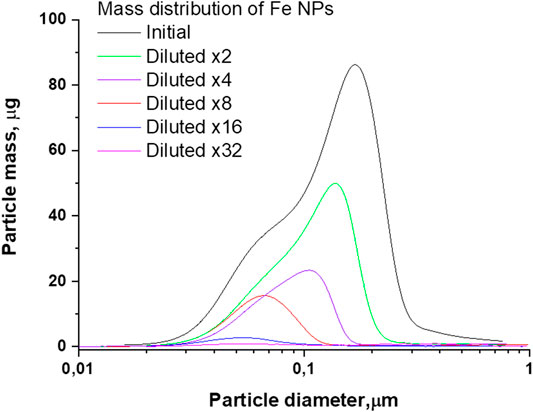
FIGURE 4. The distribution of the mass of Fe nanoparticles by size depending on the amount of dilutions of the initial colloid.
A similar situation occurs for the weight distributions of Fe nanoparticles. The initial distribution maximum located at 170 nm shifts toward smaller sizes and, as a result of dilutions by a factor of 32, turns out to be 52 nm, Figure 4.
Figures 5 and 6 represent changes in the distribution of Cu nanoparticles by the number of particles and by weight, depending on the size at multiple dilutions. As can be seen from Figures 5, when the initial colloidal solution of Cu nanoparticles is diluted, the distribution maximum shifts together with a decrease in the number of particles. The position of the maximum of the particle number distribution in the initial colloid corresponds to a particle size of about 120 nm. With subsequent dilutions, the distribution maximum shifts toward smaller sizes and is at 32 nm in a 32-fold diluted colloid.
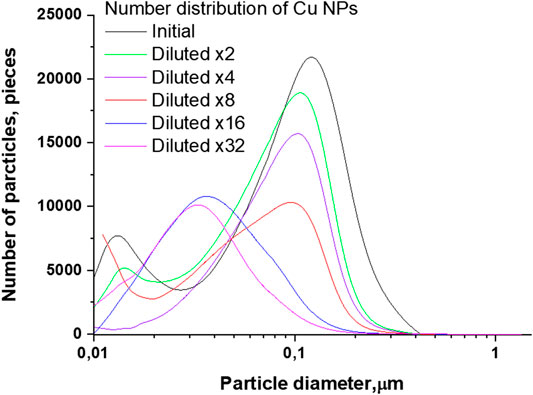
FIGURE 5. Size distribution of Cu nanoparticles depending on the amount of initial colloid dilution.
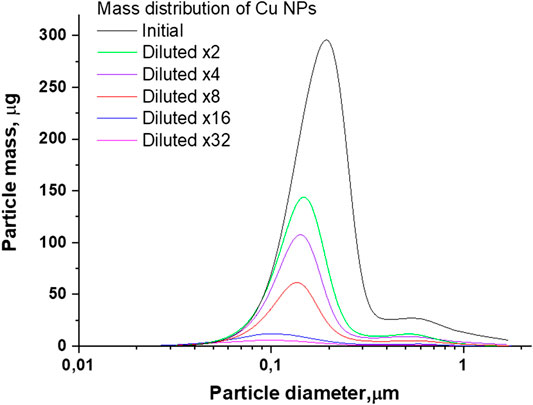
FIGURE 6. The distribution of the mass of Cu nanoparticles by size depending on the amount of dilutions of the initial colloid.
In contrast to the distributions obtained for Fe nanoparticles and characterized by a monotonic decrease in the number of particles, colloids of Cu nanoparticles diluted by a factor of 16 and 32 are characterized by an increase in the number of particles, which can be attributed to the presence in the colloid of large agglomerates composed of particles with a size of 30 nm. With dilution and a decrease in the concentration of nanoparticles, agglomerates cease to be stable and disintegrate into smaller particles, which in turn contributes to the distribution. Although this result is strictly explained by the physicochemical processes taking place in solutions, it can be opposed to the general logic that dilution is always associated with a decrease in concentration. The absence of small particles in the distribution of Fe nanoparticles may mean that the agglomerates are composed of smaller particles less than 10 nm in size.
As can be seen from Figure 6, for the distributions of Cu nanoparticles by weight depending on the size, a similar tendency to a decrease in the mass of particles and a shift in the maximum remains. The initial colloid of nanoparticles is characterized by a distribution maximum located at 200 nm. When the colloid is diluted, the maximum shifts to the left and is located in the region of 100 nm when diluted 32 times.
To sum up, the experimental results indicate that with a decrease in the initial concentration of particles in the colloid, the equilibrium state shifts toward a decrease in the average size of nanoparticles. In Figure 7 for clarity, the normalized particle size distributions for iron and copper are shown. In addition to Figure 7, graphs are plotted showing the dependence of the average size of nanoparticles in the colloid depending on the number of dilutions. The main aim at this stage of the study is to find the form of the dependence of the average size of nanoparticles depending on concentration.
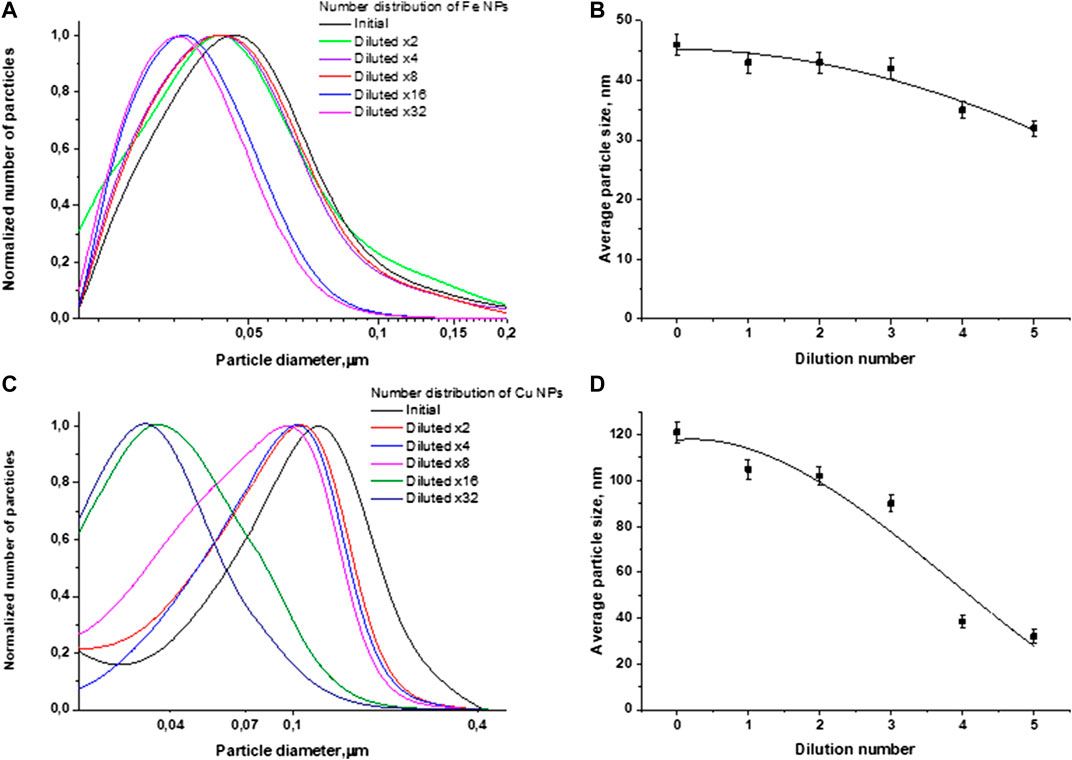
FIGURE 7. Normalized particle size distributions and the dependence of the average particle size on the number of dilutions in the case of: (A,B) iron nanoparticles; (C,D) copper nanoparticles.
In the following part, the dependency of particle distribution on time will be analyzed. It is assumed that the size distribution of nanoparticles has a lognormal form. The concentration of nanoparticles as a function of the nanoparticle diameter
Here
The evolution of the distribution of nanoparticles in time is described by the equation:
In a stationary state, when an equilibrium distribution is established in the colloid:
Differentiating the expression for concentration, we get:
The factor in brackets consists of two terms that describe the process of changing the number of particles in the colloid. Explicitly:
Equating both parts to each other and taking into account the type of distribution, where the parameter
The parameter
It is assumed here that
Now it will be analyzed from 8 how the average size
Figure 8 shows how the average particle size depends on time, according to Eq. 10. The figure shows that the average size of agglomerates in the colloid begins to increase sharply with an increase in the parameter proportional to the concentration of particles.
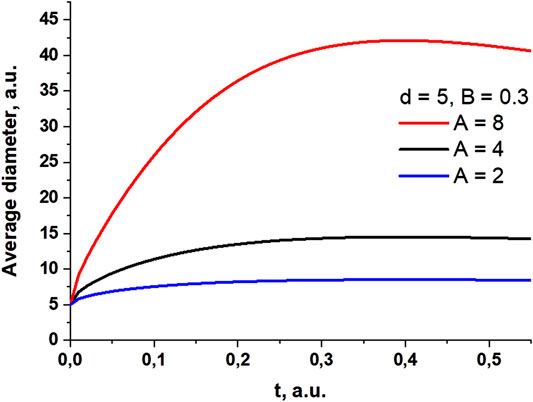
FIGURE 8. Change in average particle size with time. Data are given for several values of the parameter C, which is proportional to the concentration of particles.
Knowing the expression for
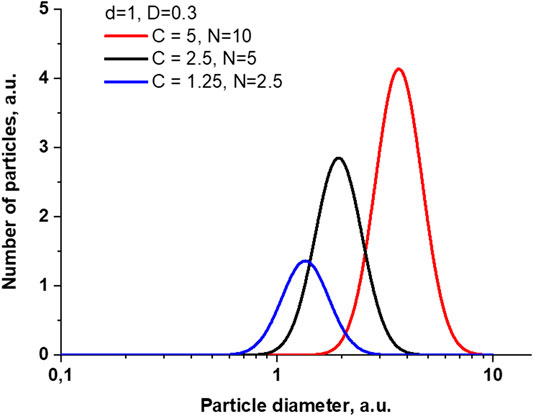
FIGURE 9. Changes in particle size distribution when changing parameters corresponding to changes in particle concentration.
Conclusion
In this work, the dynamics of changes in the distribution of iron and copper nanoparticles depending on the concentration of nanoparticles was investigated. The evolution of the size distribution of nanoparticles upon multiple dilutions is shown experimentally. It was found that with a decrease in the concentration of nanoparticles, the size of stable agglomerates decreases and, consequently, the initial distribution shifts toward smaller sizes. However, with the dilution of Cu nanoparticles, the relative concentration of individual nanoparticles increases, and the number of particles in one aggregate decreases. A mathematical model has been proposed to describe the change in the distribution function with a change in the concentration of nanoparticles. The paper shows a fact, strictly explainable from a physical point of view, that the dependence of the properties of solutions prepared using the sequential dilution technology with physical action at each stage on concentration may not obey the general logic (dilution should always be accompanied by a decrease in concentration), thereby confirming that during this technological action, complex physical processes take place in solutions that must be taken into account and studied.
Data Availability Statement
The original contributions presented in the study are included in the article/supplementary material, further inquiries can be directed to the corresponding author/s.
Author Contributions
IB, OU, VS, and MV conducted experiments. IB, AS, AL, and SG participated in the processing of the results and their discussion. IB and SG participated in writing the text of the manuscript.
Funding
This work was supported by a grant of the Ministry of Science and Higher Education of the Russian Federation for large scientific projects in priority areas of scientific and technological development (grant number 075-15-2020-775). Part of the research related to the production of nanoparticles was supported by the Russian Foundation for Basic Research (19-02-00061).
Conflict of Interest
The authors declare that the research was conducted in the absence of any commercial or financial relationships that could be construed as a potential conflict of interest.
Acknowledgments
The authors are grateful to the Center for Collective Use of the GPI RAS for the equipment provided.
References
1. Vadavalli S, Valligatla S, Neelamraju B, Dar M, Chiasera A, Ferrari M, et al. Optical properties of Germanium nanoparticles synthesized by pulsed laser ablation in acetone. Front Phys (2014). 2:1–9. doi:10.3389/fphy.2014.00057.
2. Letzel A, Reich S, Rolo T, Kanitz A, Hoppius J, Rack A, et al. On the time and mechanism of nanoparticle functionalization by macromolecular ligands during pulsed laser ablation in liquids. Langmuir (2019). 35:3038–47. doi:10.1021/acs.langmuir.8b01585.
3. Simakin A, Astashev M, Baimler I, Uvarov O, Voronov V, Vedunova M, et al. The effect of gold nanoparticle concentration and laser fluence on the laser-induced water decomposition. J Phys Chem B (2019). 123:1869–80. doi:10.1021/acs.jpcb.8b11087.
4. Koch J, von Bohlen A, Hergenröder R, Niemax K. Particle size distributions and compositions of aerosols produced by near-IR femto- and nanosecond laser ablation of brass. J Anal At Spectrom (2004). 19:2. doi:10.1039/B310512A.
5. Nichols W, Malyavanatham G, Henneke D, O'Brien D, Becker M, Keto J. Bimodal nanoparticle size distributions produced by laser ablation of microparticles in aerosols. J Nanoparticle Res (2002). 4:423–32. doi:10.1023/A:1021644123428.
6. Floyd R,, Sharp D. Aggregation of poliovirus and reovirus by dilution in water. Appl Environ Microbiol (1977). 33:159–67. doi:10.1128/AEM.33.1.159-167.1977.
7. Samal S,, Geckeler K. Unexpected solute aggregation in water on dilution. Chem Commun (2001). 2224. doi:10.1039/b105399j.
8. Guryev E, Volodina N, Shilyagina N, Gudkov S, Balalaeva I, Volovetskiy A, et al. Radioactive (90Y) upconversion nanoparticles conjugated with recombinant targeted toxin for synergistic nanotheranostics of cancer. Proc Natl Acad Sci Unit States Am (2018). 115–9695. doi:10.1073/pnas.1809258115.9690
9. Zyuzin M, Honold T, Carregal-Romero S, Kantner K, Karg M, Parak W. Influence of temperature on the colloidal stability of polymer-coated gold nanoparticles in cell culture media. Small (2016). 12, 1723. doi:10.1002/smll.201503232.
10. Prylutskyy Y, Buchelnikov AS, Voronin DP. С60 fullerene aggregation in aqueous solution. Phys Chem Chem Phys (2013). 15:9351–60. doi:10.1039/C3CP50187F.
11. Torres VM, Posa M, Srdjenovic B, Simplicio AL. Solubilization of fullerene C60 in micellar solutions of different solubilizers. Colloids Surf, B (2011). 82:46–53. doi:10.1016/j.colsurfb.2010.08.012.
12. Eastoe J, Crooks ER, Beeby A, Heenan RK. Structure and photophysics in C60-micellar solutions. Chem Phys Lett (1995). 245:571–7. doi:10.1016/0009-2614(95)01059-I.
13. Gataullin AR, Bogdanova SA, Galyametdinov YG. Dispersion of fullerene C60 in organized media. Liq. Cryst. Appl. (2019). 19:6–13. doi:10.18083/LCAppl.2019.1.6.
14. Gudkov SV, Guryev EL, Gapeyev AB, Sharapov MG, Bunkin NF, Shkirin AV, et al. Unmodified hydrated C60 fullerene molecules exhibit antioxidant properties, prevent damage to DNA and proteins induced by reactive oxygen species and protect mice against injuries caused by radiation-induced oxidative stress. Nanomedicine (2019). 15:37–46. doi:10.1016/j.nano.2018.09.001.
15. Sonin AS, Churochkina NA, Kaznacheev AV, Golovanov AV. Liquid crystals of carbon compounds. Liq Cryst Appl (2017). 17:5–28. doi:10.18083/LCAppl.2017.3.5.
16. Chausov DN, Kurilov AD, Belyaev VV. Liquid crystal nanocomposites doped with rare earth elements. Liq Cryst Appl (2020). 20–2. doi:10.18083/LCAppl.2020.2.6.6
17. Kaneko K, Iizuka Y, Ujihara Y, Hashishin T, Hanasaki T. Electrorheological properties of liquid crystalline gold nanoparticles in a nematic solvent. Liq Cryst Appl (2017). 17:28–34. doi:10.18083/LCAppl.2017.2.28.
18. Kamanina NV, Zubtsova YA, Toikka AS, Likhomanova SV, Zak A, Tenne R. Temporal characteristics of liquid crystal cell with ws2 nanoparticles: mesophase sensitization and relief features. Liq Cryst Appl (2020). 20:34–40. doi:10.18083/LCAppl.2020.1.34.
Keywords: laser radiation, nanoparticles, particle distribution, laser ablation, agglomeration
Citation: Gudkov SV, Baimler IV, Uvarov OV, Smirnova VV, Volkov MY, Semenova AA and Lisitsyn AB (2020) Influence of the Concentration of Fe and Cu Nanoparticles on the Dynamics of the Size Distribution of Nanoparticles. Front. Phys. 8:622551. doi: 10.3389/fphy.2020.622551
Received: 28 October 2020; Accepted: 11 November 2020;
Published: 27 November 2020.
Edited by:
Nikolai F. Bunkin, Bauman Moscow State Technical University, RussiaReviewed by:
Artem Tykhomyrov, Palladin Institute of Biochemistry (NAS Ukraine), UkraineDenis Chausov, Moscow State Regional University, Russia
Copyright © 2020 Gudkov, Baimler, Uvarov, Smirnova, Volkov, Semenova and Lisitsyn. This is an open-access article distributed under the terms of the Creative Commons Attribution License (CC BY). The use, distribution or reproduction in other forums is permitted, provided the original author(s) and the copyright owner(s) are credited and that the original publication in this journal is cited, in accordance with accepted academic practice. No use, distribution or reproduction is permitted which does not comply with these terms.
*Correspondence: Sergey V. Gudkov, c19tYWthcml5QHJhbWJsZXIucnU=
 Sergey V. Gudkov
 Ilya V. Baimler
 Oleg V. Uvarov1