- Institut Laue-Langevin, Grenoble, France
With the constantly improving performance of neutron spin echo (NSE) spectrometers it becomes possible to perform measurements on increasingly complex samples and to study more and more delicate effects. To properly study such effects, proper background correction becomes increasingly important. In this paper, we will review different methods to subtract the buffer from NSE measurements and study the effect of small errors in the subtraction of the background. In the large dynamic range of modern neutron spin-echo spectrometers multiple effects become visible in a single measurement. Specifically, for vesicles both membrane undulations and translational diffusion have an effect on the intermediate scattering function in the NSE time window and here, we will investigate how taking this into account differently affects the results obtained from data analysis.
1 Introduction
After the invention of neutron spin echo (NSE) spectroscopy by Mezei [1] in 1972 it took more than another decade before the technique was used to study membrane dynamics, at first using droplet microemulsions [2]. Later, bicontinuous microemulsions [3] and lipid bilayers [4] were studied. The development of the Zilman-Granek model [5], adapting a model for semi-flexible polymers by Farge and Maggs [6] for the two dimensional case of bilayers and starting from a Helfrich bending Hamiltonian [7] meant a major breakthrough for the field as it managed to explain the anomalous scaling of the relaxation rate
with the modulus of the scattering vector q, Fourier time t and
where kB is the Boltzmann constant, T is the temperature, η is the viscosity, κ is the bending rigidity and
Since then, membrane dynamics have become one of the major subjects studied by NSE. As an admittedly somewhat random example, in the last proposal round 2019, a little less than 40% of all proposals submitted for the NSE spectrometer IN15 [11] at the Institut Laue-Langevin were related to the study of membrane dynamics. Another (less random) example is the number of citations of papers mentioning NSE and membrane dynamics from the Web of Science core collection (November 2020) which has increased by almost a factor 30 between 2000 and 2020, accounting for more than 15% of all the citations of papers mentioning NSE compared to less than 2% in 2000.
It was realized early on that bending rigidities obtained from fitting the Zilman-Granek model to NSE data are usually too high by about a factor 10 [12, 13] while values obtained from DLS give reasonable values [8]. The simplest remedy for this problem is to use a higher effective viscosity (typically
with the monlayer elastic area compressibility modulus k and the height of the monolayer neutral surface from the bilayer midsurface d. Fortunately, the compressibility modulus of the bilayer Ka is proportional to the bending rigidity [15].
which is related to k for a symmetric bilayer by Ka = 2k [16] even though others claim to have found Ka = k [17]. The factor 24 in Eq. 4 stems from treating the chain entropy of the lipids as short polymers in non-coupling monolayers ignoring van der Waals interactions or effects from the headgroup. This yields excellent results in treating data from micropipette suction [15] but different theoretical treatments can lead to factors between 4 and 48 [18] instead of 24 in Eq. 4 depending on the level of coupling between the monolayers and the distribution of lateral pressure across the membrane. The remaining parameter in Eq. 4dbilayer is the mechanical thickness of the bilayer. For saturated and monounsaturated it can be replaced by the thickness of the hydrophobic part of the bilayer, but deviations are observed for more complicated bilayers such as systems with polyunsaturated lipids [15] or bilayers with cholesterol [19]. Inserting Eq. 4 in Eq. 3 with Ka = 2k gives
where the exact value of d is not known but is commonly assumed to be between 0.5 and 1 times the monolayer thickness [20, 21]. Watson and Brown [20] have shown that Eq. 5 can simply be used in the framework of the Zilman Granek model replacing κ by
Another complication comes from the fact that in the derivation of the approximate form of the Zilman-Granek model in Eq. 1 an averaging over the wavelengths of the undulations has to be performed. Monkenbusch et al. [13] have shown for length and time scales relevant for microemulsions that the explicit length scale influences the result when explicitly evaluating the nested integrals that are otherwise approximated to give Eq. 1.
Given these uncertainties in the theoretical treatment, the prefactor in Eq. 2 should be considered as a simple fudge factor and for a relative comparison between data from structurally similar vesicles Eq. 1 is perfectly sufficient as long as care is taken not to over interpret absolute values of κ.
This paper can not and will not try to resolve all the aforementioned theoretical uncertainties but focus on the effect of the exact fitting procedure of the data. While many publications simply fit data with Eq. 1, diffusion of vesicles certainly has an influence on the intermediate scattering function and in Section 2 we will investigate how values of κ are influenced by different methods of taking into account translational diffusion. In addition it will be investigated how the use of the explicit form of the Zilman-Granek model as in Monkenbusch et al. [13] influences the obtained results on length scales relevant to lipid vesicles.
In Section 3 the effect of the background subtraction will be examined in detail. While the details of the procedure for the subtraction of the background are comparably unimportant as long as the data is simply analyzed by fitting a single stretched exponential it becomes increasingly important as more subtle effects are investigated as for example thickness fluctuations [22, 24, 25] or short range motions of the lipids in the membrane [26, 27].
All of this is done in the hope that it will allow to extract more robust information from NSE experiments, which may in turn help to further develop the underlying theory.
2 Data Analysis
A closer look at Eq. 1 reveals that the q3 dependence of the undulation mode is merely the result of keeping the q dependence of the relaxation rate in the parentheses with the 2/3 exponent and Eq. 1 could equally well be rewritten as
and comparing it to the derivative of the simple exponential describing diffusion (
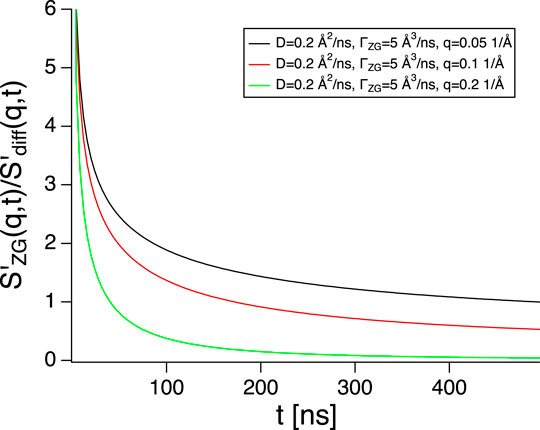
FIGURE 1. Ratio between the slope of the Zilman-Granek stretched exponential (see Eq. 6) and the derivative of simple exponential for diffusion with parameters typical for fluid phase lipid vesicles. Only at short times the contribution from diffusion is negligible.
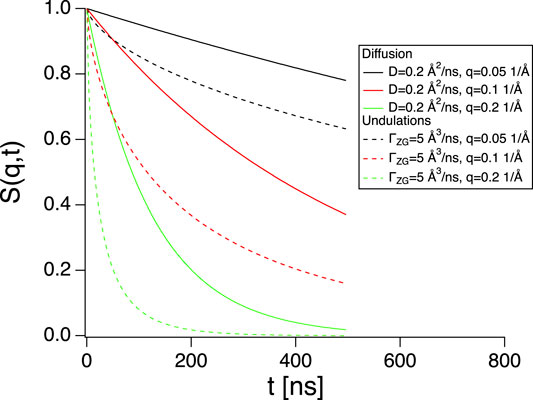
FIGURE 2. Intermediate scattering functions for diffusion (Sdiff(q, t), full lines) and membrane undulations (SZG(q, t), dashed lines) using parameters indicated in the graph. Diffusion gives a non-negligible contribution.
Let us now turn our attention to a practical example. Fluid phase phosphatidylcholine (PC) vesicles with a radius of about 100 nm at a lipid concentration of 2 mg/ml have been measured at IN15. Fitting a simple exponential to determine an apparent diffusion coefficient (
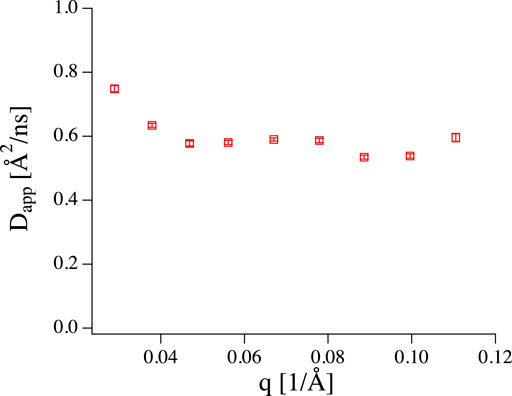
FIGURE 3. Apparent diffusion coefficient obtained from fitting NSE data of 100 nm vesicles (2 mg/ml) with a simple exponential. The value is too large for simple diffusion, but no q3 dependence is present.
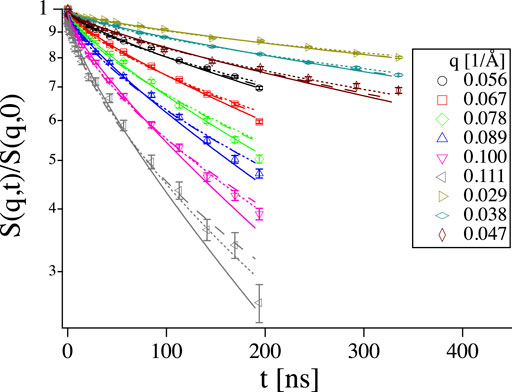
FIGURE 4. Intermediate scattering function of the same vesicles as in Figure 3 with different fits: Dashed lines: Eq. 8, full lines: Eq. 7, dotted lines: Eq. 1. All fit functions yield reasonable fits.
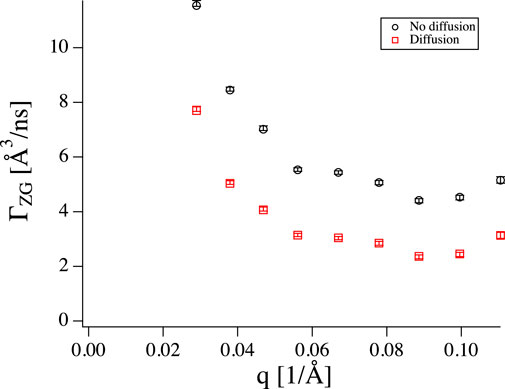
FIGURE 5. ΓZG obtained from fitting Eq. 1 (black circles) and Eq. 7 (red squares) to the vesicle data. Including diffusion leads to systematically lower values.
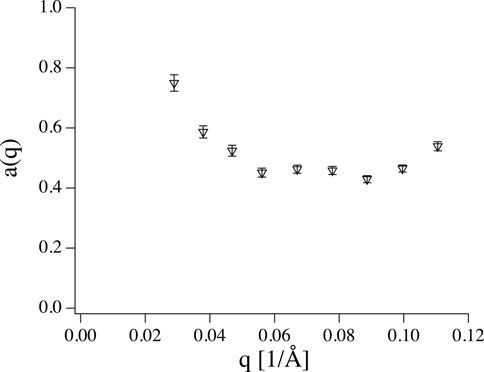
FIGURE 6. Amplitude a(q) obtained from fitting data shown in Figure 4 to Eq. 8 with ΓZG as shared parameter (dashed lines). Leaving a(q) free it takes values significantly smaller than 1.
The simplest way to include diffusion in the fit is by multiplication of the diffusion term with the Zilman-Granek expression:
Fitting two fairly similar relaxation rates which only differ in the exact shape of the curve is fairly difficult. Therefore, D should be known from an independent measurement such as DLS. Using D = 0.208 Å2/ns a value of ΓZG = 3 Å3/ns is obtained which would correspond to a fairly high
The undulation motion of the membrane has a limited amplitude and consequently its visibility depends on q. Therefore, it is in principle necessary to include an amplitude a(q):
where Eq. 7 is the special case where a = 1. Unfortunately, Eq. 8 inflates the number of fit parameters but conceptionally κ should be q independent and using a single κ for all q values reduces the number of fit parameter to a reasonable value. Performing the fit on the data in Figure 4 results in the amplitudes shown in Figure 6 and ΓZG = 12 Å3/ns, which is much higher than the value obtained by simply fitting Eq. 1 due to the reduced contribution of the Zilman-Granek term.
The Milner-Safran model [29] describes membrane fluctuations for small microemulsion droplets [30] and provides an explicit expression for the amplitude. Mell et al. [31] have tried to apply Zilman-Granek model but using the amplitudes from the Milner-Safran model. They found rather mediocre agreement between theory and data. The problem might result from the fact that in the Millner-Safran theory a sphere is expanded in spherical harmonics to describe the fluctuations. This requires some excess area, relative to a perfect sphere, which minimizes the surface to volume ratio and the volume is conserved since the material can not be exchanged on the nanosecond time scale of the undulations. The longest undulation wavelength corresponds to half the circumference of the sphere and with equipartition the amplitude of that mode (n = 2) is given by Eq. 6 of Schneider et al. [32].
which gives
This raises another interesting question. What is the range of undulation wavelengths that is actually relevant for NSE measurements of lipid vesicles? Half the vesicles circumference is an upper limit which is most likely not reached due to the lack of excess area in the vesicles. To satisfy equipartition, long wavelength undulations need rather large amplitudes, which results in a strong deformation of the vesicles from their ideal spherical shape and increases the surface to volume ratio. Since the volume of the vesicles is conserved over the nanosecond timescale of the undulations some excess surface are is needed to perform undulation motions [29] and the amount of excess area that would be needed for the long wavelength undulations with their large amplitudes may not be available in practice. Monkenbusch et al. [13] mapped the parameter space but in a range more relevant to microemulsions by evaluating the complete expression of the Zilman-Granek expression:
where J0 is the 0 order Bessel function, Rmax is the maximum length scale, related to the minimum undulation wavevector
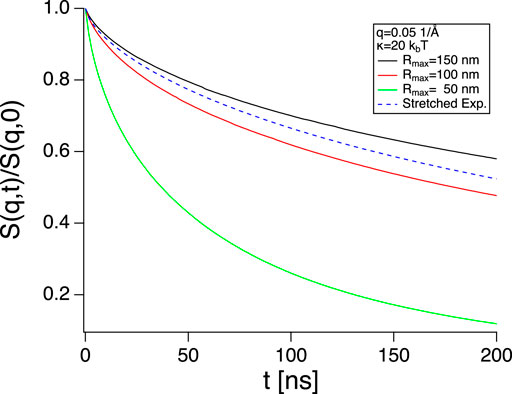
FIGURE 7. S(q, t) calculated using Eq. 10 with different Rmax (full lines) and Eq. 1 (dashed blue line, using κ not
3 Background Subtraction
As new experiments are looking for increasingly subtle effects in membranes using NSE, such as thickness fluctuations of the membrane [22, 25] or short scale motions of lipids [26] a careful background subtraction becomes increasingly important.
Background correction in NSE [33] is greatly complicated by the fact that the incoherent scattering process changes the polarisation of the beam to -1/3 of its initial value [34]. As a result the shape of the background can be a rather complicated combination of coherent and incoherent dynamics with an amplitude of opposite sign (see Figure 8).
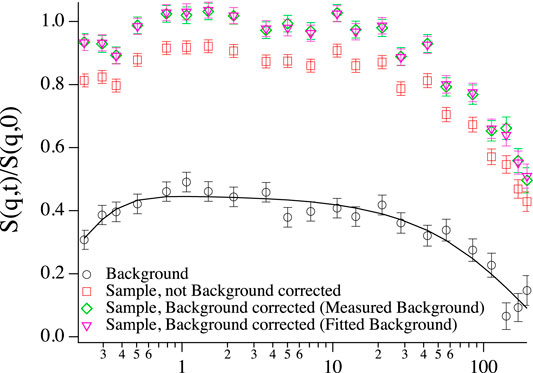
FIGURE 8. Intermediate scattering function of vesicles at low concentration (∼1 mg/ml) at q = 0.1 1/Å, background corrected with directly subtracted background (green diamonds), background corrected with fitted background (purple triangles), without background correction (red squares) and the corresponding background that was subtracted from the sample to give the background subtracted data sets (black circles, black line: double exponential fit) with fast incoherent dynamics at short times, which are still visible in the background corrected sample and background correction could not fully account for it.
In addition scattering from the instrument itself contributes a mostly elastic signal. This complicated shape of the background sets a high-q limit for the measurement of coherent dynamics in aqueous solution by NSE. The form factor typically decays as
After correcting for resolution effects [35] the non-normalized intermediate scattering function of a sample with coherent intensity
where f = 1 at t = 0. This signal is normalized by the difference of the polarized intensity in up and down direction with
A few remarks on Eq. 12 are in order. If the decay rate of
While it is possible to directly subtract the transmission weighted background measurement directly from the individual detector images that are afterward used to calculate the echo, this requires the phase of the echo to be extremely stable [36]. Therefore, the standard procedure on IN15 is to calculate s(q, t) for sample and background individually and subtract the background echo from the sample echo to obtain the background corrected non-normalized intermediate scattering function
where
Assuming that
and the subtraction according to Eq. 13 eliminates all background contributions but leaves both
Instead of subtracting a completely measured curve sbkg(q, t) in Eq. 13, in some situations it can be advantageous to subtract a curve that is the result of a fit to sbkg(q, t). If the shape is known and simple enough, it can save quite some time to only measure a few Fourier time points of sbkg(q, t) and fit the rest of the expression. To give an example, fully deuterated polymer melts show an essentially flat background with fast dynamics that are not in the time window of NSE. Even if the full curve has been measured, it can be preferable to use a fitted background to avoid extra noise from a noisy background measurement. On the other hand, one runs the risk of introducing artifacts by using an oversimplified fit function for the background. Sometimes, even a double exponential fit can fail to capture all subtleties of the background. To the author’s experience, it is generally preferable to measure the full background curve, whenever possible. After all, a fitted background can still be used after measuring the full curve, while the opposite case is more difficult. In Figure 8 both versions of background subtraction are shown. Since the double exponential fit (black line) nicely describes the measured background, there is not much of a difference between the two versions of background correction, except for the third to last point, which is artificially high in the green curve where the background was directly subtracted, since the same point seems somewhat low in the measured background and the background fit straightens out this artifact.
The intricate details of background subtraction do not matter too much as long as the signal from the sample is large compared to the background. Unfortunately, some of the most interesting phenomena are best seen where the intensity is weak. Both shape fluctuations of microemulsion droplets [30, 39] and thickness fluctuations of membranes [22, 24, 25, 40] are best seen in their respective form factor minima. The result of an imperfect background subtraction usually is a curve that does not have an amplitude of exactly one together with a slight increase or flattening of S(q, t) at short times, which is the result of a not perfectly subtracted incoherent contribution. Fitting such a curve with an amplitude fixed at 1, can lead to too high relaxation rates (see Figures 5 and 6), while leaving the amplitude as a free fit parameter leads to larger error bars and can potentially result in too low fitted relaxation rates.
Another kind of phenomenon where careful background subtraction is crucial are the short length scale motions observed by Gupta et al. [26], where a different exponent x in the evolution of the mean square displacement
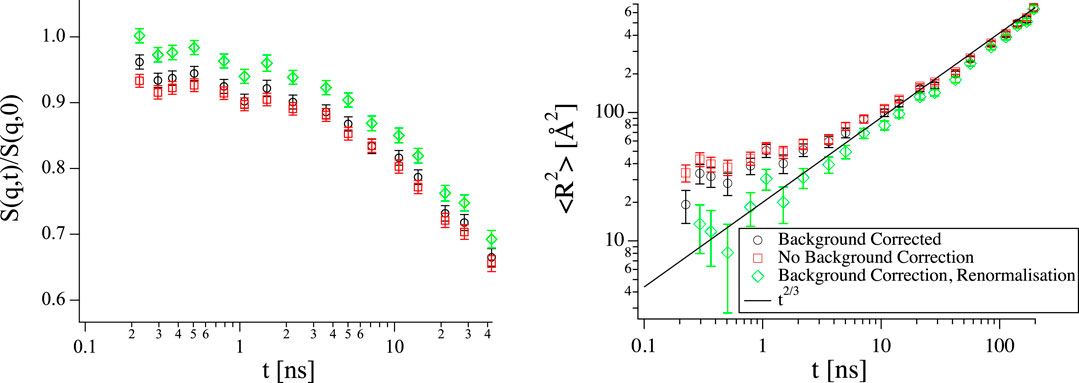
FIGURE 9. Left: Short time range of S(q, t) from the same vesicle sample as in Figure 4 at q = 0.11 1/Å with logarithmic x-axis, the same color code as in the right hand panel applies. Right: Mean square displacement calculated from the curves on the left. The black line shows scaling with t2/3 as expected for the Zilman-Granek model. The Background corrected sample does not exactly go up to one at short times (left). As a result a scaling with low scaling exponent x appears at short times in
4 Conclusion
In this paper the effect of background subtraction and data treatment on the information that can be gained from neutron spin echo (NSE) experiments on bilayers was discussed. The diffusion of typical lipid vesicles with radii between 50 and 100 nm as they are used in NSE experiments to investigate membrane dynamics does have an effect on the time and length scale covered by modern NSE spectrometers.
As long as vesicles of the same size and therefore same diffusion coefficient are compared, it is not strictly necessary to include translational diffusion in the analysis but it should be kept in mind that the absolute values of the bending rigidity that are obtained from the data without taking into account diffusion have only a limited significance. Unfortunately, the renormalization factors that are currently in use are based on data that was analyzed without diffusion to give values of the bending rigidity that agree with values obtained from other methods. If diffusion is taken into account when fitting data, there is still uncertainty concerning the value of the amplitude a(a) in Eq. 8. Depending on whether it is fixed at one or left as a free parameter in the fit, the apparent value of the bending rigidity can change in either direction compared to the case without contribution from diffusion.
Nevertheless, as soon as bending rigidities from vesicles with different radii are compared it is advised to include a contribution from diffusion. Given the similar time scales, the diffusion coefficient should be obtained from an independent measurement such as DLS, which has its intricacies as well, since in the relatively concentrated samples used in NSE, the diffusion coefficient obtained at low q by DLS is most likely affected by de Gennes narrowing [28] (
While usually background subtraction is not discussed in too much detail in NSE, it becomes increasingly important as more subtle effects are being studied and incorrect background subtraction and it was shown how imperfect background subtraction can lead to artifacts.
All of this shows that there are some challenges ahead on the way to gaining even more detailed information on membrane dynamics from NSE measurements.
Data Availability Statement
The datasets presented in this study can be found in online repositories. The names of the repository/repositories and accession number(s) can be found below: dx.doi.org/10.5291/ILL-DATA.TEST-2861 dx.doi.org/10.5291/ILL-DATA.TEST-2712.
Author Contributions
The author confirms being the sole contributor of this work and has approved it for publication.
Conflict of Interest
The author declares that the research was conducted in the absence of any commercial or financial relationships that could be construed as a potential conflict of interest.
Acknowledgments
Raw data of the NSE curves shown here are available under dx.doi.org/10.5291/ILL-DATA.TEST-2861 and dx.doi.org/10.5291/ILL-DATA.TEST-2712. The author would like to thank Andrew Dennison, Andrew Parnell and Michael Gradzielski for letting him use their data in this paper as much as Olaf Holderer for sharing his Python code for Eq. 10. Financial support from the BMBF Project No. 05K13KT1 is gratefully acknowledged.
References
1. Mezei F. Neutron spin echo: a new concept in polarized thermal neutron techniques. Z Phys A Hadrons Nuclei (1972) 255:146–60. doi:10.1007/BF01394523
2. Huang JS, Milner ST, Farago B, Richter D. Study of dynamics of microemulsion droplets by neutron spin-echo spectroscopy. Phys Rev Lett (1987) 59:2600–3. doi:10.1103/PhysRevLett.59.2600
3. Farago B, Monkenbusch M, Goecking K, Richter D, Huang J. Dynamics of microemulsions as seen by neutron spin echo. Physica B (1995) 213–214:712–7. doi:10.1016/0921-4526(95)00257-A
4. Pfeiffer W, König S, Legrand JF, Bayerl T, Richter D, Sackmann E. Neutron spin echo study of membrane undulations in lipid multibilayers. Europhys Lett (1993) 23:457. doi:10.1209/0295-5075/23/6/013
5. Zilman AG, Granek R. Undulations and dynamic structure factor of membranes. Phys Rev Lett (1996) 77:4788–91. doi:10.1103/PhysRevLett.77.4788
6. Farge E, Maggs AC. Dynamic scattering from semiflexible polymers. Macromolecules (1993) 26:5041–4. doi:10.1021/ma00071a009
7. Helfrich W. Elastic properties of lipid bilayers - theory and possible experiments. Z Naturforsch C Biosci: J Biosci (1973) 28:693–703. doi:10.1515/znc-1973-11-1209
8. Freyssingeas E, Roux D, Nallet F. Quasi-elastic light scattering study of highly swollen lamellar and sponge phases. J Phys II (1997) 7:913–29. doi:10.1051/jp2:1997162
9. Nagao M, Seto H, Kawabata Y, Takeda T. Temperature and pressure effects on structural formations in a ternary microemulsion. J Appl Crystallogr (2000) 33:653–6. doi:10.1107/S0021889899013679
10. Mihailescu M, Monkenbusch M, Endo H, Allgaier J, Gompper G, Stellbrink J, et al. Dynamics of bicontinuous microemulsion phases with and without amphiphilic block-copolymers. J Chem Phys (2001) 115:9563–77. doi:10.1063/1.1413509
11. Farago B, Falus P, Hoffmann I, Gradzielski M, Thomas F, Gomez C. The IN15 upgrade. Neutron News (2015) 26:15–7. doi:10.1080/10448632.2015.1057052
12. Komura S, Takeda T, Kawabata Y, Ghosh SK, Seto H, Nagao M. Dynamical fluctuation of the mesoscopic structure in ternary -water-n-octane amphiphilic systems. Phys Rev E (2001) 63:041402. doi:10.1103/PhysRevE.63.041402
13. Monkenbusch M, Holderer O, Frielinghaus H, Byelov D, Allgaier J, Richter D. Bending moduli of microemulsions; comparison of results from small angle neutron scattering and neutron spin-echo spectroscopy. J Phys Condens Matter (2005) 17:S2903–9. doi:10.1088/0953-8984/17/31/017
14. Seifert U, Langer SA. Viscous modes of fluid bilayer membranes. Europhys Lett (1993) 23:71–6. doi:10.1209/0295-5075/23/1/012
15. Rawicz W, Olbrich K, McIntosh T, Needham D, Evans E. Effect of chain length and unsaturation on elasticity of lipid bilayers. Biophys J (2000) 79:328–39. doi:10.1016/j.bpj.2009.11.026
16. Nagle JF. Area compressibility moduli of the monolayer leaflets of asymmetric bilayers from simulations. Biophys J (2019) 117:1051–6. doi:10.1016/j.bpj.2019.08.016
17. Doktorova M, Levine MV, Khelashvili G, Weinstein H. A new computational method for membrane compressibility: bilayer mechanical thickness revisited. Biophys J (2019) 116:487–502. doi:10.1016/j.bpj.2018.12.016
18. Bloom M, Evans E, Mouritsen OG. Physical properties of the fluid lipid-bilayer component of cell membranes: a perspective. Q Rev Biophys (1991) 24:293–397. doi:10.1017/S0033583500003735
19. Pan JJ, Tristram-Nagle S, Nagle JF. Effect of cholesterol on structural and mechanical properties of membranes depends on lipid chain saturation. Phys Rev E (2009) 80:021931. doi:10.1103/PhysRevE.80.021931
20. Watson MC, Brown FLH. Interpreting membrane scattering experiments at the mesoscale: the contribution of dissipation within the bilayer. Biophys J (2010) 98:L9–11. doi:10.1016/j.bpj.2009.11.026
21. Lee J, Choi S, Doe C, Faraone A, Pincus PA, Kline SR. Thermal fluctuation and elasticity of lipid vesicles interacting with pore-forming peptides. Phys Rev Lett (2010) 105:038101. doi:10.1103/PhysRevLett.105.038101 |
22. Nagao M, Kelley EG, Ashkar R, Bradbury R, Butler PD. Probing elastic and viscous properties of phospholipid bilayers using neutron spin echo spectroscopy. J Phys Chem Lett (2017) 8:4679–84. doi:10.1021/acs.jpclett.7b01830
23. Gupta S, de Mel JU, Schneider GJ. Dynamics of liposomes in the fluid phase. Curr Opin Colloid Interface Sci (2019) 42:121–36. doi:10.1016/j.cocis.2019.05.003
24. Nagao M, Chawang S, Hawa T. Interlayer distance dependence of thickness fluctuations in a swollen lamellar phase. Soft Matter (2011) 7:6598–605. doi:10.1039/C1SM05477E
25. Woodka AC, Butler PD, Porcar L, Farago B, Nagao M. Lipid bilayers and membrane dynamics: insight into thickness fluctuations. Phys Rev Lett (2012) 109:058102. doi:10.1103/PhysRevLett.109.058102
26. Gupta S, de Mel JU, Perera RM, Zolnierczuk P, Bleuel M, Faraone A, et al. Dynamics of phospholipid membranes beyond thermal undulations. J Phys Chem Lett (2018) 9:2956–60. doi:10.1021/acs.jpclett.8b01008
27. Gupta S, Schneider GJ. Modeling the dynamics of phospholipids in the fluid phase of liposomes. Soft Matter (2020) 16:3245–56. doi:10.1039/C9SM02111F
28. de Gennes PG. Liquid dynamics and inelastic scattering of neutrons. Physica (1959) 25:825–39. doi:10.1016/0031-8914(59)90006-0
29. Milner ST, Safran SA. Dynamical fluctuations of droplet microemulsions and vesicles. Phys Rev A (1987) 36:4371–9. doi:10.1103/PhysRevA.36.4371
30. Farago B, Gradzielski M. The effect of the charge density of microemulsion droplets on the bending elasticity of their amphiphilic film. J Chem Phys (2001) 114:10105–22. doi:10.1063/1.1362690
31. Mell M, Moleiro L, Hertle Y, Fouquet P, Schweins R, López-Montero I, et al. Bending stiffness of biological membranes: what can be measured by neutron spin echo? Eur Phys J E (2013) 36:1–13. doi:10.1140/epje/i2013-13075-2
32. Schneider M, Jenkins J, Webb W. Thermal fluctuations of large quasi-spherical bimolecular phospholipid vesicles. J Phys France (1984) 45:1457–72. doi:10.1051/jphys:019840045090145700
33. Farago B. The basics of neutron spin-echo (2003). Available at: https://www.osti.gov/etdeweb/servlets/purl/20009251.
34. Mezei F. The principles of neutron spin echo. In: F Mezei, editor Neutron spin echo spectroscopy: basics, trends and applications. Berlin, Heidelberg: Springer Berlin Heidelberg (1980). p. 1–26.
35. Mezei F. Fundamentals of neutron spin echo spectroscopy. In: Neutron spin echo spectroscopy: basics, trends and applications. Berlin, Heidelberg: Springer Berlin Heidelberg (2003). p. 5–14.
38. Shibayama M, Nagao M, Okabe S, Karino T. Evaluation of incoherent neutron scattering from softmatter. J Phys Soc Jpn (2005) 74:2728–36. doi:10.1143/JPSJ.74.2728
39. Nagao M, Seto H. Concentration dependence of shape and structure fluctuations of droplet microemulsions investigated by neutron spin echo spectroscopy. Phys Rev E (2008) 78:011507. doi:10.1103/PhysRevE.78.011507
Keywords: neutron spin echo, membrane dynamics, phospholipid, neutron scattering, quasielastic scattering, vesicles
Citation: Hoffmann I (2021) Data Analysis and Background Subtraction in Neutron Spin Echo Spectroscopy. Front. Phys. 8:620082. doi: 10.3389/fphy.2020.620082
Received: 21 October 2020; Accepted: 23 November 2020;
Published: 10 February 2021.
Edited by:
Alexandros Koutsioumpas, Helmholtz Association of German Research Centers (HZ), GermanyReviewed by:
Elizabeth Kelley, National Institute of Standards and Technology (NIST), United StatesPiotr Adam Zolnierczuk, Oak Ridge National Laboratory (DOE), United States
Copyright © 2021 Hoffmann. This is an open-access article distributed under the terms of the Creative Commons Attribution License (CC BY). The use, distribution or reproduction in other forums is permitted, provided the original author(s) and the copyright owner(s) are credited and that the original publication in this journal is cited, in accordance with accepted academic practice. No use, distribution or reproduction is permitted which does not comply with these terms.
*Correspondence: Ingo Hoffmann, aG9mZm1hbm5AaWxsLmZy
 Ingo Hoffmann