- Departamento de Física, Facultad de Ciencias, Universidad Nacional Autónoma de México, Ciudad Universitaria, México, Mexico
We introduce a lattice gas model with a modified Hamiltonian considering different energy for cycles of connected atoms. The system can be interpreted as a chalcogenide glass with pollutants forming floppy and rigid structures. We consider an energetic penalization for redundant bonds in the network. This penalization allows us to incorporate the topology constraints of rigidity in the network to study the thermodynamics of the system. We observe, depending on the parameter used for the penalization, that the system exhibits a typical first-order phase transition, or a stepped transition between the low and high density while varying the chemical potential. We also observe a hysteresis loop in the density and energy of the system. We use the area of these loops to calculate the irreversible enthalpy. There are two regimes, one where the enthalpy decreases linearly and the other with almost constant enthalpy. As the enthalpy is almost constant and very low, we interpreted this as the intermediate phase of the chalcogenide glasses.
1 Introduction
Lattice gas models are among the simplest thermodynamic models that exhibit a phase transition with an exact solution in 2D. The nearest neighbor interaction and limitation of occupation in volume allows emulating a real gas in potentials such as Lennard-Jones [1]. This model has proven to be useful in different contexts, such as condensation of DNA [2], or the absorption in controlled-pore Glasses [3]. There is also a direct relationship with the Ising model, which was first used to study ferromagnetic materials [4], and then many other materials as spin-crossover materials [5], or spin glasses [6] among others. On the other hand, chalcogenide glasses seem to be some of the most promising materials for future technology, with important applications [7–9], ranging from solid state batteries [10, 11] to optics and photonics infrared devices [12, 13]. Topology and rigidity of the network are characterizing properties of these glasses [14, 15].
Experimental modulated differential scanning calorimetry (MDSC) and computational molecular dynamics (MD) studies near the glass transition over chalcogenide materials have found anomalies in the behavior of the macroscopic variables of these materials, giving rise to what is known as the intermediate phase [16–18]. Although theoretical explanations regarding the significance and existence of this phase exist, as far as we know, no microscopic model which recovers the thermodynamic macroscopic properties of the system has been constructed to this date. The purpose of the paper is to provide a simplified microscopic model that reproduces the behavior of thermodynamic variables in the intermediate phase.
2 Intermediate Phase and Rigidity in Chalcogenide Glasses
The anomalies mentioned previously, along with most of the bulk properties of chalcogenide glasses, have been related to a microscopic property of their covalent network called rigidity [19]. It can be defined as the property of atoms being able to move without deforming current bond angles and lengths. More precisely, a whole mathematical formalism can be developed to study rigidity [20].
Independently of the mathematical theory of rigid networks, simplified models have been extensively used to study the rigidity of glasses, with particular focus on reproducing the transition between rigid and floppy modes [21]. The most relevant of them is the percolation rigidity model, based on constraint counting, which can be exactly solved using mean-field approximations [22].
Besides the obvious complexity arising from the absence of long-range order in amorphous solids, the challenge in building a model that recovers macroscopic properties relies on the difficulty of representing the vibrational entropy accumulated near the boson peak and the inherent degeneracy of most of the configurations [23].
Such difficulty is directly related to the problem of effectively quantifying the rigidity of the network so it can be incorporated into the microscopic model. Mean-field theories are incapable of describing the microscopic scale accurately. In the particular case of two-dimensional networks, the pebble game algorithm [24] is capable of decomposing a network onto its rigid components with sufficient speed, but it does not give a method of relating rigidity to thermodynamic variables.
The algorithm relies on Laman’s theorem [25] which characterizes exactly the rigidity of a network embedded in a two-dimensional Euclidean space. The referred theorem hasn’t been successfully extended to other dimensions due to the difficulty of the exactly characterizing the rigid components of a network embedded in an arbitrary geometry. For dimensions greater than two, approximations are commonly used [26]. As we are only interested in quantifying the rigidity as a function of thermodynamic variables in a more accurate way than the mean-field theories, we could aim to use a non-precise but a simplified model of the network by using a modified lattice gas model. This model should take into account the results obtained by the pebble game algorithm when simulating the transition to a rigid system.
2.1 Description and Behavior of Chalcogenide Glasses
Chalcogenide glasses are amorphous solids built upon members of the 16 group of the periodic table (S, Se, Te) by doping them with members of another group, most commonly group 15 (As,Sb). To a molecular level they can be completely described by a continuous random network (CRN) [27]: a molecular network where each edge represents a covalent bond. Although van der Waal forces between pairs of free electrons are normally present in the system, those interactions are weak enough to be left out of the CRN model.
Raman Spectroscopy allows us to obtain the resonant frequencies of the vibrational modes of the network, which is related to the different molecular structures (components) of the network. This information allows to calculate the entropy by using the formula
The relationship between the topology of the network and its rigidity to the macroscopic properties of the system via the changes in its density of states was first proposed by Phillips [14, 15] and further confirmed from mean-field constraint counting approaches to rigidity by Thorpe [19, 29]. Experiments have also shown that when examining glasses of the same compound but different stoichiometries, which is equivalent to changing the mean coordination number of the network, macroscopic properties change as a function of the stoichiometries and present a transition when passing for coordination numbers similar to the theoretically predicted by mean-field theory [30, 31]. In addition, when performing experimental MDSC calorimetry studies of chalcogenide glasses, we can measure the heatflow during endothermic and exothermic processes of the system. With these measurements, the irreversible enthalpy when passing through the glass transition can be obtained. When analyzing such data as a function of the stoichiometry of the glass, a reversibility window is found, in which the irreversible enthalpy vanishes [16]. Such a window can not be directly associated with a rigid or floppy phase of the CRN; it forms a new phase called intermediate phase [16].
The importance and existence of the intermediate phase are confirmed by the exotic behavior of other macroscopic properties of the glasses in such a window [32], such as ionic conduction [33] and infrared reflectance [34]. The intermediate phase has also been observed by measuring the configurational entropy of the system [23, 28, 35, 36]. Studies on other chalcogenide glasses and oxide glasses also exhibit an intermediate phase with similar anomalies in the macroscopic variables [17], and it can also be observed in molecular dynamics simulations [18].
Such experiments have also measured quantities that are directly related to the average coordination number and the number of floppy modes (see for example [17] and references inside), which can be used to quantify the constraint density [16]. Those quantities have been also developed in analytical and numerical treatment of this materials [14, 17].
Despite the experiments and simulations carried out the intermediate phase is still controversial especially due to contradicting experimental studies in which a structural origin of the phase isn’t found [37–41].
2.2 Microscopic Models
Besides the experimental controversy, some efforts have been made in order to construct a microscopic (structural) model that reproduces the exotic behavior of the macroscopic variables of the system. Outside of the intermediate phase context, several microscopic models have been developed [27, 42], more recently putting effort into describing the glass transition and the Arrhenius-like behavior [43, 44].
One of the first models [45], uses a random bond network that allowed to control the number of rings of bonds, which are problematic in the rigidity percolation theory. The authors used a computer simulation that allowed constructing the network beginning in a floppy mode and growing it by adding bonds that restrict movement in a non-redundant way (i.e., the bonds reduce the degrees of freedom of the system). After all of the independent bonds have been placed, the bond allocation continues and its performed at random. With this model, the authors were able to observe a transition from a floppy state to a rigid, non stressed (i.e., without redundant bonds) and from there to a stressed network. The key element in the model is in the procedure of the building that allows for self-organization in the network.
This model was further developed by Chubynsky et al. Ref. 46 in order to work with networks in thermodynamic equilibrium, as the network construction process of the original model could lead to highly atypical networks for the system. This model changes the original only in a small way: it grows the network from a floppy state by adding independent bonds, but every time it adds a bond it deletes and creates a bond that doesn’t change the stress (i.e., the redundancy of another bond) of the network.
Another model Ref. 47 also uses the self-organization of the network, in this case by explicitly describing the Hamiltonian as the number floppy modes. The network is restricted to a Bethe-like lattice (of finite size). The system is then studied using Monte Carlo simulations, switching configurations by rewiring two randomly selected nodes. The intermediate phase is found in terms of changes in the probability of a stressed cluster that exists and percolates through the entire lattice.
It must be acknowledged that the three mentioned models depend on the Pebble Game algorithm in order to describe the independent bonds of the network. Other models have been studied before those mentioned [48]. They do not depend directly on the exact description of the rigid components of the network, but instead approximate those components via loops or cycles of the covalent graph. They are also known as tree-like percolation models. Most of these models do not produce a uniform ensemble with equal probability for all tree-like structures, although they can be treated as if they were in thermodynamic equilibrium. Tree-like percolation models also include self-organization by avoiding the building of loops.
Models that directly attack the thermodynamic properties from the hamiltonian either analytically [49] or numerically via stochastic descriptions [23] have also been developed. Another important aspect of the models in this subsection is the fact that most of them are designed only to describe the system in moments where we can accurately characterize the vibrational entropy of the atoms. Such an assumption implies that the temperature T of our systems is much smaller than the Debye temperature
3 Model
Similar to tree-like percolation models, we can argue that in two-dimensions the redundant constraints put by adding a bond to an atom with zero degrees of freedom is equivalent to whether the connectedness of the graph will depend on such bond. In a lattice gas model, an independent bond will be a bridge edge of the graph, and rigid components become equivalent to components isomorphic to cycles. To obtain the macroscopic variables from the microscopic model, we need its hamiltonian. We will base our model in the lattice gas model, which has the following hamiltonian:
where μ is the chemical potential,
This hamiltonian will be modified to take into account the energy cost of stress (redundant constrains). In our model these redundant constrains are the bonds forming cycles. Then, adding a cost energy of the bonds belonging to a cycle to Eq. 1, we obtain:
here L is the set of all the nearest neighbors that form clusters without bridge edges. This is equal to the set of all the edges between vertices in cycles.
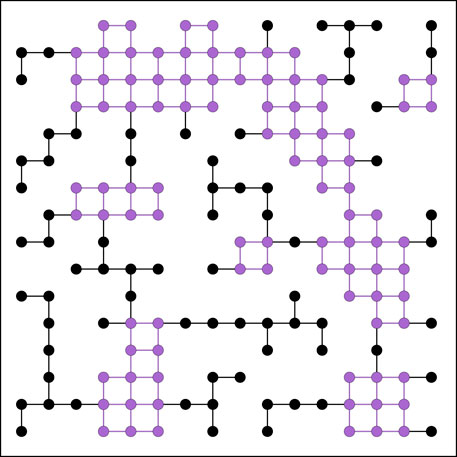
FIGURE 1. Search of rigid clusters for a 16×16 square lattice system with closed boundary conditions.
Our model differs from the original tree-like percolation [50] due to the fact that, although it is also an Ising-like model, in the tree-like model the connectedness problem arises as an interpretation of the system, meanwhile that in our model we are explicitly modifying the hamiltonian with a new term.
In the limit
For
which gives a critical value
and suggests a change between medium and high density. Physically, this medium density corresponds to the case where adding particles in rigid, non stressed components is favored. This can be related to the constrain density
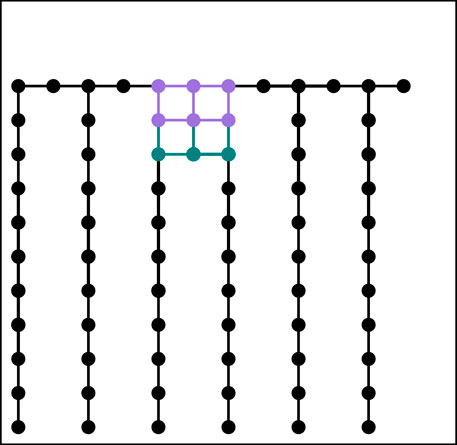
FIGURE 2. New bonds (green) created by adding a new atom next to a rigid cluster (purple) in a square lattice.
For
For sufficiently high values of
which happens for
Summarizing,
4 Simulations
We studied the model performing Markov Chain Monte Carlo simulations, based on the Metropolis-Hastings algorithm. The stability and convergence of chains were analyzed to determine the number of Monte Carlo Sweeps (algorithm steps per lattice site) needed to achieve convergence. For
We simulated for 41×31 equally spaced values of
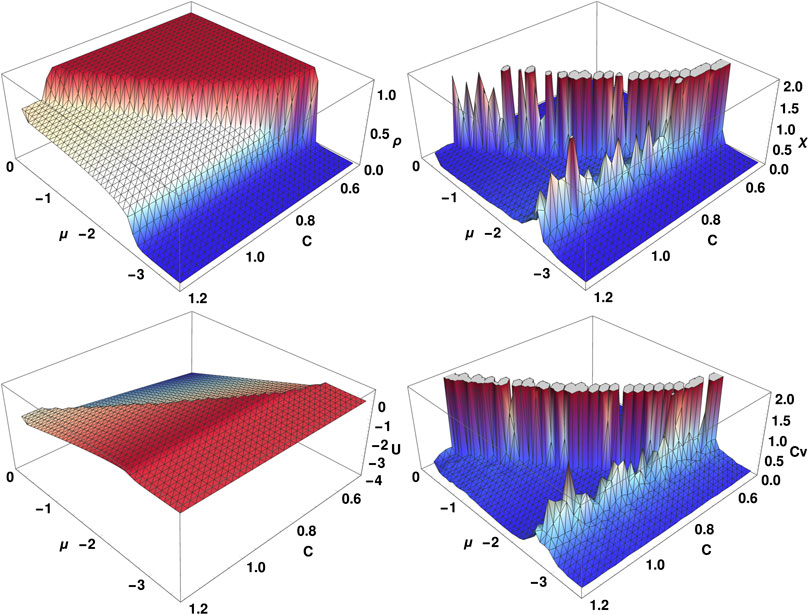
FIGURE 3. Macroscopic variables for a square lattice model: density ρ (top left), internal energy U (top right), density susceptibility χ (bottom left) and heat capacity at constant volume
The simulation was coded in the Julia Language [51], and can be found online in a public repository at: https://github.com/sayeg84/latticeModels
5 Discussion
5.1 Macroscopic Variables
In a canonical ensemble, the probability to be in a particular state is proportional to
Changing pressure on the system is equivalent to deforming the lattice (change the volume V) which translates into a change of the potential energy because
Average coordination number
The susceptibility χ and the specific heat
Because a medium-density state could be unexpected for a model of this kind, we checked that its existence is independent of system size by performing simulations for smaller sizes. It occurs for every size and even becomes more stable as N grows. We define
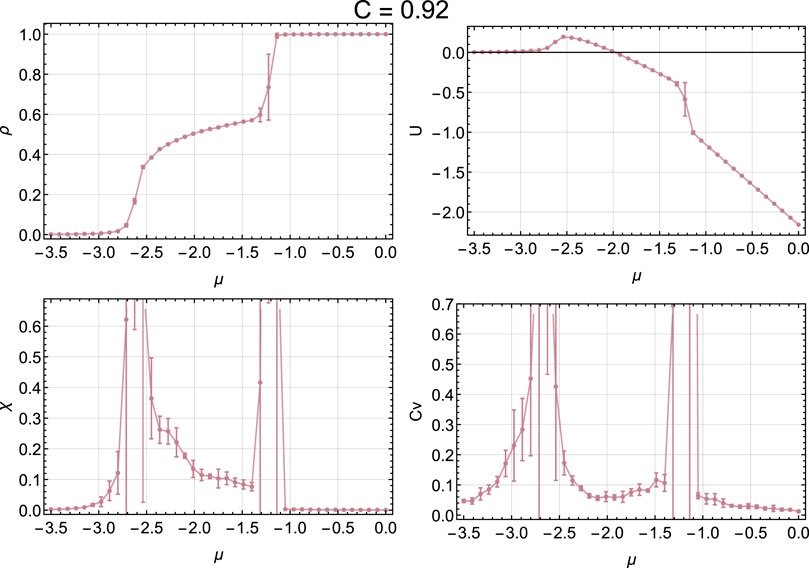
FIGURE 4. Macroscopic variables for a square lattice: density ρ (top left), internal energy U (top right), density susceptibility χ (bottom left) and heat capacity at constant volume
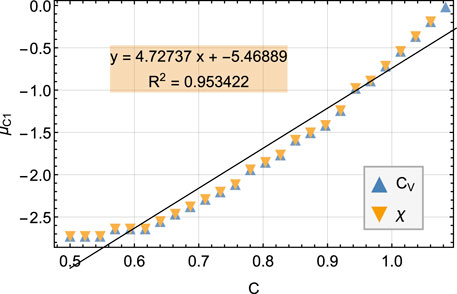
FIGURE 5.
The linear fit of the data displays parameters close to the theoretical analysis done previously (section 3, and equation refeq: mu1) with a high correlation coefficient even if the analysis was very rough. An analysis of hexagonal and triangular 2D lattices revels that the macroscopic variables exhibit the same behavior for those values of μ but for a different interval of C. This is expected from a theoretical point of view due to the critical point dependence of the average rigid bonds added when going from the spanning tree configuration to a rigid configuration.
5.2 Hysteresis
The simulations presented in the previous subsection were all performed by initializing the system with a random low-density configuration and making the simulations over it in a μ-increasing direction. When performing the same procedure but for μ-decreasing and beginning with a high-density configuration, the macroscopic thermodynamic variables show a different path. This difference in the path is called hysteresis.
Hysteresis is usually related to loss of internal energy and the work that the system produces [55, 56]. The area of the hysteresis loop in the density of the lattice gas is directly proportional to the work
The hysteresis loops and their areas, corresponding to the work produce by the system
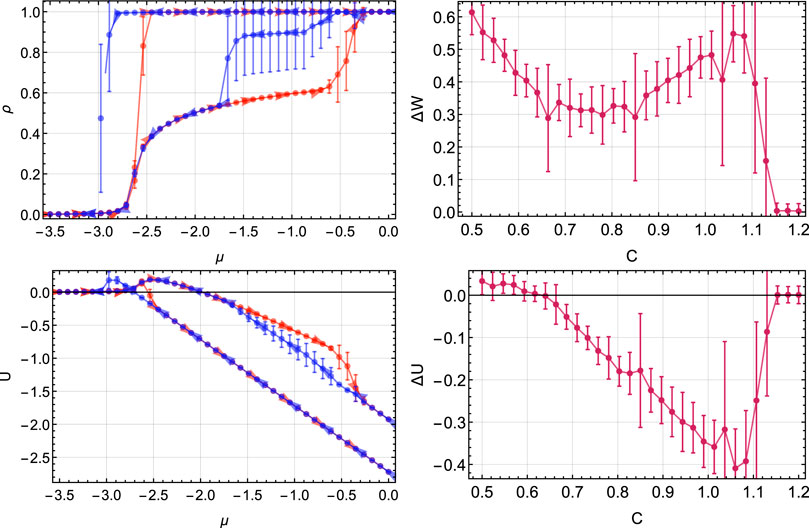
FIGURE 6. Hysteresis in the thermodynamic variables for different values of C. Light colors are for
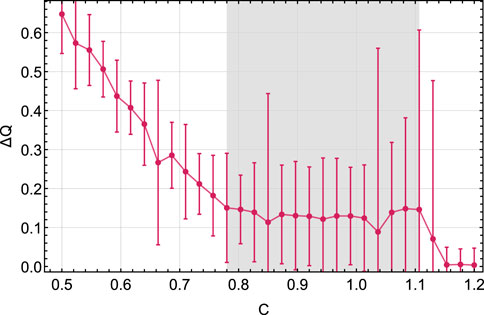
FIGURE 7.
Comparing Figures 3, 6 we can see that the difference in internal energy
As a result
Recalling the association of the parameter C with
6 Conclusion
We present a simple model that exhibits a change in enthalpy behavior when varying the rigidity of the system, a behavior similar to that reported in chalcogenide glasses when increasing the amount of added pollutants. The fact that the model is simple results in efficient simulations, that allows us to make large enough systems and study how they change by varying different parameters. In addition, this model allows us to obtain density, internal energy, density susceptibility, and specific heat.
For certain parameters, the model exhibits a step transition in the density, while for others the transition is with no medium values of density. From the values of
We were able to analytically approximate the parameter range where the transitions would appear. Our numerical results are in close agreement with such rudimentary approximations. Furthermore, our model is the first to connect the microscopic properties with the macroscopic thermodynamic variables.
Studying the hysteresis loops we were able to observe a change in behavior of the enthalpy, which is related to the change in density observed when the chemical potential (or temperature) varies when the transition becomes stepped width a medium density.
Despite success in qualitatively describing the first transition (flexible-rigid) to the intermediate phase, we were not able to reproduce the transition to stressed systems. We speculate that to see such a transition we would need to vary the temperature instead of the chemical potential.
Data Availability Statement
The raw data supporting the conclusions of this article will be made available by the authors, without undue reservation.
Author Contributions
AP performed the simulations and both authors contributed to designing the simulations, discussing the results, and writing and revising the manuscript prior to submission.
Funding
This work was partially funded by Universidad Nacional Autónoma de México via PAPIIT project IA106618.
Conflict of Interest
The authors declare that the research was conducted in the absence of any commercial or financial relationships that could be construed as a potential conflict of interest.
Acknowledgments
The authors appreciate the computing platform provided by the Laboratorio de Cómputo de Alto Rendimiento, under coordination of Departamento de Matemáticas of Facultad de Ciencias, UNAM. We also thank David P. Sanders and Adrian Huerta for fruitful discussions regarding the direction of this paper.
References
1. Lavis DA, Bell GM. Statistical mechanics of lattice systems. Chichester: Springer Berlin Heidelberg (1999).
2. Vtyurina NN, Dulin D, Docter MW, Meyer AS, Dekker NH, Abbondanzieri EA. Hysteresis in dna compaction by dps is described by an ising model. Proc Natl Acad Sci U.S.A. (2016) 113:4982–7. doi:10.1073/pnas.1521241113
3. Gelb LD, Salazar R. Adsorption in controlled-pore glasses: comparison of molecular simulations with a mean-field lattice gas model. Adsorption (2005) 11:283–8. doi:10.1007/s10450-005-5938-z
4. Ising E. Beitrag zur theorie des ferromagnetismus. Z Phys (1925) 31:253–8. doi:10.1007/bf02980577
5. Muraoka A, Boukheddaden K, Linares J, Varret F. Two-dimensional ising-like model with specific edge effects for spin-crossover nanoparticles: a monte carlo study. Phys Rev B (2011) 84:054119. doi:10.1103/PhysRevB.84.054119
6. Saccone M, Scholl A, Velten S, Dhuey S, Hofhuis K, Wuth C, et al. Towards artificial ising spin glasses: thermal ordering in randomized arrays of ising-type nanomagnets. Phys Rev B (2019) 99:224403. doi:10.1103/PhysRevB.99.224403
7. Zakery A, Elliott S. Optical properties and applications of chalcogenide glasses: a review. J Non-Cryst Solids (2003) 330:1–12. doi:10.1016/j.jnoncrysol.2003.08.064
8. Seddon A. Chalcogenide glasses: a review of their preparation, properties and applications. J Non-Cryst Solids (1995) 184:44–50. doi:10.1016/0022-3093(94)00686-5
9. Eggleton BJ, Luther-Davies B, Richardson K. Chalcogenide photonics. Nat Photon (2011) 5:141–8. doi:10.1038/nphoton.2011.309
10. Tatsumisago M, Hayashi A. Chalcogenide glasses as electrolytes for batteries In: Chalcogenide glasses. Elsevier (2014). p 632–54.
11. Asobe M. Nonlinear optical properties of chalcogenide glass fibers and their application to all-optical switching. Opt Fiber Technol (1997) 3:142–8. doi:10.1006/ofte.1997.0214
12. Shaw LB, Cole B, Thielen PA, Sanghera JS, Aggarwal ID. Mid-wave ir and long-wave ir laser potential of rare-earth doped chalcogenide glass fiber. IEEE J Quant Electron (2001) 37:1127–37. doi:10.1109/3.945317
13. Boolchand P, Bresser W. Mobile silver ions and glass formation in solid electrolytes. Nature (2001) 410:1070–1073. doi:10.1038/35074049
14. Phillips J. Topology of covalent non-crystalline solids i: short-range order in chalcogenide alloys. J Non-Cryst Solids (1979) 34:153–81. doi:10.1016/0022-3093(79)90033-4
15. Phillips J. Topology of covalent non-crystalline solids ii: medium-range order in chalcogenide alloys and a si(ge). J Non-Cryst Solids (1981) 43:37–77. doi:10.1016/0022-3093(81)90172-1
16. Boolchand P, Georgiev D, Goodman B. Discovery of the intermediate phase in chalcogenide glasses. J Optoelectron Adv Mater (2001) 3:703–20.
17. Micoulaut M. Relaxation and physical aging in network glasses: a review. Rep Prog Phys (2016) 79:066504. doi:10.1088/0034-4885/79/6/066504
18. Bauchy M, Micoulaut M. Densified network glasses and liquids with thermodynamically reversible and structurally adaptive behaviour. Nat Commun (2015) 6:6398. doi:10.1038/ncomms7398
19. Thorpe M. Continuous deformations in random networks. J Non-Cryst Solids (1983) 57:355–70. doi:10.1016/0022-3093(83)90424-6
20. Demaine ED, O’Rourke J. Geometric folding algorithms: linkages, origami, polyhedra. Cambridge University Press (2007).
21. Thorpe M. Rigidity percolation in glassy structures. J Non-Cryst Solids (1985) 76:109–16. doi:10.1016/0022-3093(85)90056-0
22. Thorpe M, Jacobs D, Chubynsky N, Rader A. Generic rigidity of network glasses In: Fundamental materials research. Kluwer Academic Publishers (2002). p 239–77.
23. Yan L. Entropy favors heterogeneous structures of networks near the rigidity threshold. Nat Commun (2018) 9, 1359. doi:10.1038/s41467-018-03859-9
24. Jacobs DJ, Hendrickson B. An algorithm for two-dimensional rigidity percolation: the pebble game. J Comput Phys (1997) 137:346–65. doi:10.1006/jcph.1997.5809
25. Laman G. On graphs and rigidity of plane skeletal structures. J Eng Math (1970) 4:331–40. doi:10.1007/BF01534980
26. Chubynsky MV, Thorpe MF. Algorithms for three-dimensional rigidity analysis and a first-order percolation transition. Phys Rev E (2007) 76:041135. doi:10.1103/PhysRevE.76.041135
28. Gjersing EL, Sen S, Aitken BG. Structure, connectivity, and configurational entropy of GexSe100-x glasses: results from 77se MAS NMR spectroscopy. J Phys Chem C (2010) 114:8601–8. doi:10.1021/jp1014143
29. Feng S, Thorpe MF, Garboczi E. Effective-medium theory of percolation on central-force elastic networks. Phys Rev B (1985) 31:276–80. doi:10.1103/PhysRevB.31.276
30. Tanaka K. Structural phase transitions in chalcogenide glasses. Phys Rev B (1989) 39:1270–9. doi:10.1103/PhysRevB.39.1270
31. Narayanan RA, Asokan S, Kumar A. Evidence concerning the effect of topology on electrical switching in chalcogenide network glasses. Phys Rev B (1996) 54:4413–5. doi:10.1103/PhysRevB.54.4413
32. Chen P, Holbrook C, Boolchand P, Georgiev DG, Jackson KA, Micoulaut M. Intermediate phase, network demixing, boson and floppy modes, and compositional trends in glass transition temperatures of binaryAsxS1-xsystem. Phys Rev B (2008) 78:224208. doi:10.1103/physrevb.78.224208
33. Micoulaut M, Malki M, Novita DI, Boolchand P. Fast-ion conduction and flexibility and rigidity of solid electrolyte glasses. Phys Rev B (2009) 80:184205. doi:10.1103/PhysRevB.80.184205
34. Rompicharla K, Novita DI, Chen P, Boolchand P, Micoulaut M, Huff W. Abrupt boundaries of intermediate phases and space filling in oxide glasses. J Phys Condens Matter (2008) 20:202101. doi:10.1088/0953-8984/20/20/202101
35. Chakravarty S, Chbeir R, Chen P, Micoulaut M, Boolchand P. Correlating melt dynamics and configurational entropy change with topological phases of AsxS100–x glasses and the crucial role of melt/glass homogenization. Front Mater (2019) 6, 166. doi:10.3389/fmats.2019.00166
36. Chen P, Holbrook C, Boolchand P, Georgiev DG, Jackson KA, Micoulaut M. Intermediate phase, network demixing, boson and floppy modes, and compositional trends in glass transition temperatures of binary
37. Shatnawi MTM, Farrow CL, Chen P, Boolchand P, Sartbaeva A, Thorpe MF, et al. Search for a structural response to the intermediate phase in
38. Micoulaut M. Concepts and applications of rigidity in non-crystalline solids: a review on new developments and directions. Adv Phys X (2016b) 1:147–75. doi:10.1080/23746149.2016.1161498
39. Zeidler A, Salmon PS, Whittaker DAJ, Pizzey KJ, Hannon AC. Topological ordering and viscosity in the glass-forming ge–se system: the search for a structural or dynamical signature of the intermediate phase. Front Mater (2017) 4:32. doi:10.3389/fmats.2017.00032
40. Chen G, Inam F, Drabold DA. Structural origin of the intermediate phase in ge–se glasses. Appl Phys Lett (2010) 97:131901. doi:10.1063/1.3495775
41. Rowlands RF, Zeidler A, Fischer HE, Salmon PS. Structure of the intermediate phase glasses gese3 and gese4: the deployment of neutron diffraction with isotope substitution. Front Mater (2019) 6:133. doi:10.3389/fmats.2019.00133
43. Hall RW, Wolynes PG. Microscopic theory of network glasses. Phys Rev Lett (2003) 90:085505. doi:10.1103/physrevlett.90.085505
44. Garrahan JP, Chandler D. Coarse-grained microscopic model of glass formers. Proc Natl Acad Sci U.S.A. (2003) 100:9710–4. doi:10.1073/pnas.1233719100
45. Thorpe M, Jacobs D, Chubynsky M, Phillips J. Self-organization in network glasses. J Non-Cryst Solids (2000) 266–269:859–66. doi:10.1016/S0022-3093(99)00856-X
46. Chubynsky MV, Brière MA, Mousseau N. Self-organization with equilibration: a model for the intermediate phase in rigidity percolation. Phys Rev (2006) 74:016116. doi:10.1103/physreve.74.016116
47. Barré J, Bishop AR, Lookman T, Saxena A. Adaptability and “intermediate phase” in randomly connected networks. Phys Rev Lett (2005) 94:208701. doi:10.1103/physrevlett.94.208701
49. Naumis GG. Energy landscape and rigidity. Phys Rev (2005) 71:026114. doi:10.1103/physreve.71.026114
50. Stephen M. Percolation problems and the potts model. Phys Lett (1976) 56:149–50. doi:10.1016/0375-9601(76)90625-3
51. Bezanson J, Edelman A, Karpinski S, Shah VB. Julia: a fresh approach to numerical computing. SIAM Rev (2017) 59:65–98. doi:10.1137/141000671
52. Cardy J. Scaling and renormalization in statistical physics. Vol. 5. Cambridge: Cambridge University Press (1996).
53. Landau DP, Binder K. A guide to Monte Carlo simulations in statistical physics. Cambridge: Cambridge University Press (2014).
54. Boukheddaden K. Monte carlo investigations on surface elastic energy of spin-crossover solids: direct access to image pressure and the eshelby constant. Phys Rev B (2013) 88:134105. doi:10.1103/physrevb.88.134105
55. Love AEH. A treatise on the mathematical theory of elasticity. Cambridge: Cambridge University Press (2013).
Keywords: chalcogenide glasses, covalent network, rigidity, intermediate phase, phase transition, lattice gas
Citation: Pasos-Trejo AS and Kraemer AS (2021) Microscopic Model of Intermediate Phase in Flexible to Rigid Transition. Front. Phys. 8:619320. doi: 10.3389/fphy.2020.619320
Received: 20 October 2020; Accepted: 30 November 2020;
Published: 05 February 2021.
Edited by:
Giancarlo Ruocco, Italian Institute of Technology (IIT), ItalyReviewed by:
Matthieu Micoulaut, Sorbonne Universités, FranceLucia Comez, National Research Council (CNR), Italy
James Charles Phillips, Rutgers, The State University of New Jersey, United States
Copyright © 2021 Pasos-Trejo and Kraemer. This is an open-access article distributed under the terms of the Creative Commons Attribution License (CC BY). The use, distribution or reproduction in other forums is permitted, provided the original author(s) and the copyright owner(s) are credited and that the original publication in this journal is cited, in accordance with accepted academic practice. No use, distribution or reproduction is permitted which does not comply with these terms.
*Correspondence: Aldo Sayeg Pasos-Trejo, c2F5ZWdAY2llbmNpYXMudW5hbS5teA==; Atahualpa S. Kraemer, YXRhLmtyYWVtZXJAY2llbmNpYXMudW5hbS5teA==
 Aldo Sayeg Pasos-Trejo
 Atahualpa S. Kraemer