
94% of researchers rate our articles as excellent or good
Learn more about the work of our research integrity team to safeguard the quality of each article we publish.
Find out more
ORIGINAL RESEARCH article
Front. Phys., 10 December 2020
Sec. Optics and Photonics
Volume 8 - 2020 | https://doi.org/10.3389/fphy.2020.618752
This article is part of the Research TopicModeling and Applications of Optoelectronic Devices for Access NetworksView all 17 articles
In traditional electrowetting display (EWD) drivers, direct current (DC) voltage and pulse width modulation are often used, which easily caused an electrowetting charge trapping phenomenon in a hydrophobic insulating layer. Therefore, the driving voltage must be increased for driving EWDs, and oil backflow cannot be solved. Aqueous solutions are often used as polar liquids for EWDs, and the reverse voltage of alternating current (AC) driving can cause chemical reactions between water and indium tin oxide (ITO). So, a driving waveform was proposed, which included a DC waveform and an AC waveform, to separately drive EWDs for oil rupture and open state. Firstly, a DC waveform was used when the oil was broken, and the response time was reduced by designing the DC voltage and duration. Secondly, an AC waveform was used when the oil required to be stable. Oil backflow could be suppressed by the AC waveform. The main parameters of AC waveform include reverse voltage, frequency and duty cycle. The reverse voltage of EWDs could be obtained by voltammetry. The frequency could be obtained by analyzing the rising and falling edges of the capacitance voltage curve. The experimental results showed that the proposed waveform can effectively suppress oil backflow and shorten the response time. The response time was about 86% lower than the conventional driving waveforms, and oil backflow was about 72% slower than the DC driving waveform.
With the rapid development of display technology in the world, liquid crystal display (LCD) and electrophoretic display (EPD) have become mainstream display technologies [1–3]. Electrowetting display (EWD) technology is an emerging technology to enhance the user experience of electronic paper [4, 5]. It has the characteristics of fast response time, low energy consumption and so on, which can meet the requirements of high energy saving in current network terminal devices [5–7].
At present, driving chips for EPDs is used for driving EWDs, and PWM modulation is still the main control scheme for displaying grayscales in EWDs [8–10]. Aqueous solutions are often used as polar liquids for EWDs, and the chemical reactions between water and ITO is caused by a reverse voltage. So, EWDs are often damaged. The reverse voltage is not designed according to the structure and material of EWDs, resulting in a short life of EWDs. By using an unipolar PWM waveform, the backflow can be suspended, but the response time is extended [11]. Therefore, a driving waveform which can suppress backflow and shorten response time must be designed for EWDs.
The EWD technology belongs to the micro-flow control technology, which makes it difficult to accurately control the pixel aperture in EWDs [12–14]. The driving voltage and characteristics of EWDs are closely related to the process and materials, the contrast and color gamut are affected by the concentration of dye [15–18]. The main purpose of driving waveform for EWDs is to control the pixel aperture and oil movement accurately [19]. Because of the hysteresis effect, which can make charge capture and oil backflow, the driving waveform cannot be designed with EPD driver chips according to the characteristics of EWDs [20, 21]. Therefore, an AC-common driving waveform was proposed for more gray scales and a fast response speed [22]. The oil splitting problem was improved with an AC-common driving waveform. And the oil backflow effect was suppressed effectively. AC-common driving waveform provided a way to continuously improve the response time of EWDs. Then, an active thin film transistor (TFT) EWD driving system was proposed based on EPD ICs [23]. PWM waveform was used in the driving system to display images and videos. The driving system used an unipolar PWM waveform modulation to realize the display of gray scales in EWDs. A reset frame was designed to release the trapped charge and inhibit oil backflow, and the pixel can remain stable in an open state for a longer time. In 2016, a platform was proposed to display 16 gray scales dynamic video based on a TFT EWD [24]. The driving waveform was constructed by seven sub-frames and a dynamic reset frame. The trapped charge was released by a dynamic reset frame. In 2019, a frequency-amplitude mixed modulation driving system was proposed to improve the response speed for driving gray-scale and enhancing oil stability based on an active TFT EWD [8]. The oil was pushed by a high voltage to close to a target reflectivity, and then, the driving voltage was decreased to stabilize the oil to a target reflectivity. The response time was improved, but the second stage cannot solve the problem of oil backflow.
So, we proposed a mixed driving waveform which included a direct current (DC) driving waveform and an alternating current (AC) driving waveform. And a voltammetry methodology was proposed for the reverse voltage of AC driving waveform. The response time and oil stability were improved by the DC driving waveform. The oil backflow was optimized by the parameter setting of the AC driving waveform. Then, the driving waveform can realize a shorter response time and a slower backflow by adjusting duty cycle and reverse voltage.
The structure of EWDs is mainly composed of upper and lower substrates, polar liquid, pixel wall, oil, sealant and insulator [25, 26]. The EWD device was reported by Hayes and Feenstra in 2003 [27]. The switching mechanism and structure of EWDs are shown in Figure 1. Indium tin oxide (ITO) glass is generally used as the common electrode on upper substrate. The lower substrate can be made by ITO or TFT. ITO is generally used to control fewer pixels, such as segment display. TFT glass is used to control more pixels, such as dot matrix displays. Polar liquids are usually aqueous solutions, such as sodium chloride solutions. Decane (C10H22) is used as oil. The color oil is made by dissolving the colored dye in decane (C10H22, ɛr = 2.2). The insulator material is Teflon af1600 and FC-43. The pixel wall material is transparent polyimide.
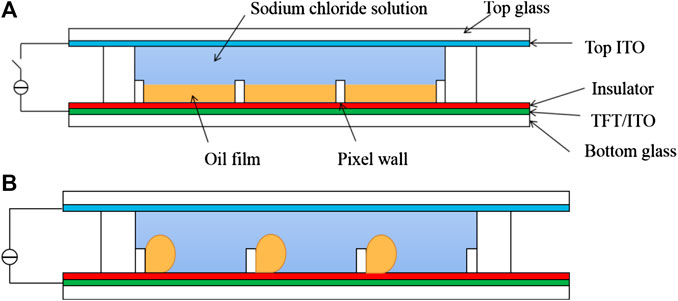
FIGURE 1. The switching mechanism and the structure of an EWD. (A) The pixel is turned off when no voltage is applied, the oil is tiled in the pixel, and the color of the oil is displayed. (B) The pixel is turned on when voltage is applied, the oil is pushed to a corner, and the reflected light is the color of the pixel substrate and the color of a small portion of the oil.
The driving mechanism of EWDs is to control contact angle between the insulator and oil by applying voltage. The reflectivity of EWDs is determined by the contact angle. In 1805, Young proposed an equation about interfacial tension and equilibrium contact angle, as shown in Eq. 1.
Where, γsg is surface tension of solid-gas, γsl is surface tension of solid-liquid, γlg is surface tension of liquid-gas, θ0 is the initial contact angle of the droplet.
The relationship between interfacial tensions and electromotive force V is described by Lippmann equation, as shown in Eq. 2.
Where, γsl(V) and γsl are surface tensions of the solid-liquid interface when the voltage is applied and when the voltage is canceled. ε0 and εr are dielectric constant in vacuum and the effective dielectric constant of the dielectric layer, d is the thickness of the dielectric layer.
The relationship between the contact angle and electromotive force V can be derived from Eqs 1 and 2, as shown in Eq. 3.
Where, σ is the density of free charges, E is the intensity of electric field, ε0 is a dielectric constant, ρ is the density of liquid, and the second term is a mass dynamic, the third term is an electrostrictive force.
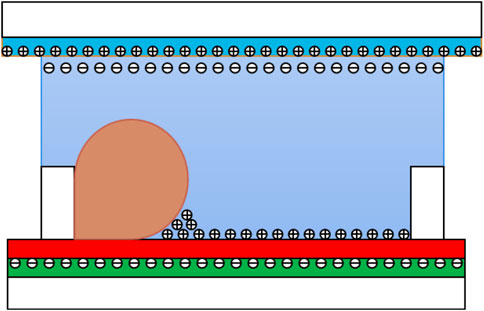
FIGURE 2. Charge distribution in electric field of a EWD pixel. When voltage is applied, ions squeeze the oil with the electric force, ions in the aqueous solution can push the oil to a corner.
The number of trapped charge in the insulator directly affects the backflow. When voltage is applied to the pixel, positive ions are gathered at the three-phase contact line, as shown in Figure 2. The electric field near the three-phase contact line will be distorted. The imbalance between Maxwell pressure and Laplace pressure at the three-phase contact line will cause backflow.
The capacitance of pixels have been widely used in EWDs, such as oil distribution, design of driving waveform, threshold voltage. The driving waveform is a superposition of a staircase wave and a square wave. The AC driving frequency was obtained by measuring EWD capacitance voltage (CV) Curve. When the rising edge curve and the falling edge curve were partly coincided, we used this frequency as a driving frequency to design the driving waveform. In the initial stage of oil rupturing, we used different driving time in a DC waveform to drive a pixel for reaching an aperture ratio, and then switch to a AC driving waveform. Reverse voltage is the key point of waveform parameters in AC driving waveform. Aqueous solution is used as the polar liquid of EWDs. The upper substrate electrode is made of ITO. The electrochemical reaction between water and ITO material is produced by the reverse voltage, the electrochemical reaction equation of ITO and water is shown in Eq. 5.
The oxidation-reduction reaction needs to reach half-wave potential for displaying in EWDs. So, the reverse voltage was designed lower than the voltage of the oxidation-reduction reaction to avoid damage to the EWD.
The relationship between the driving voltage and current was measured by voltammetry [28], the potential without oxidation-reduction reaction and half-wave potential can be obtained [29]. The half-wave potential is shown in Eq. 6. Figure 3 shows the polarographic diagram. Point A is the potential without oxidation-reduction reaction, point B is the half-wave potential, and point C is the potential when the current reaches saturation. The maximum of the reverse voltage is the voltage value at point A.
Where, i is the electrolysis current, id is the diffusion current value, the temperature is 25°C.
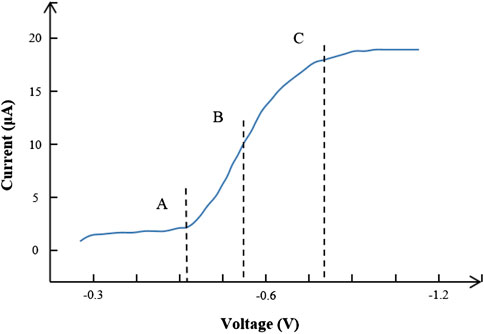
FIGURE 3. The polarographic diagram. The curve represents the change of the current with the voltage changes, and the analysis of the current can be used to determine whether a chemical reaction occurs. The voltage at point A is the starting voltage for chemical reactions.
The proposed driving waveform is shown in Figure 4. This waveform contains two phases. The first phase is a DC phase, so that the oil has a greater driving force. The second phase is an oil stabilization stage, reverse voltage is used to suspend the oil backflow.
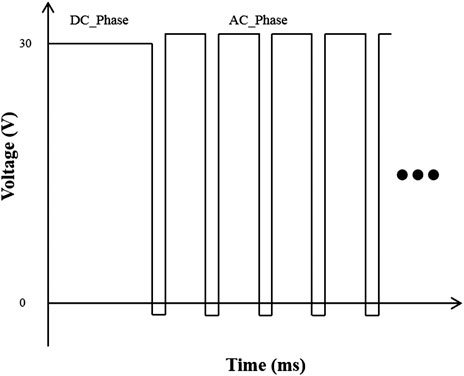
FIGURE 4. The mixed DC and AC waveform. In DC phase, the main parameters that affect the oil movement are the voltage value and driving time. In AC phase, the main parameters that affect the oil backflow are the reverse voltage, duty cycle and frequency.
The luminance measurement platform was buided for the experiment, as shown in Figure 5. This experimental platform included a waveform generator, a high voltage amplifier, an EWD cell, a colormeter and a computer. And we designed software to control the waveform generator in order to quickly switch the waveform from the waveform generator. The main measuring device is Admesy arg-45, which is a colorimeter developed by Admesy. It has the characteristics of fast measuring speed and high measuring accuracy. The specification of EWDs is shown in Table 1.
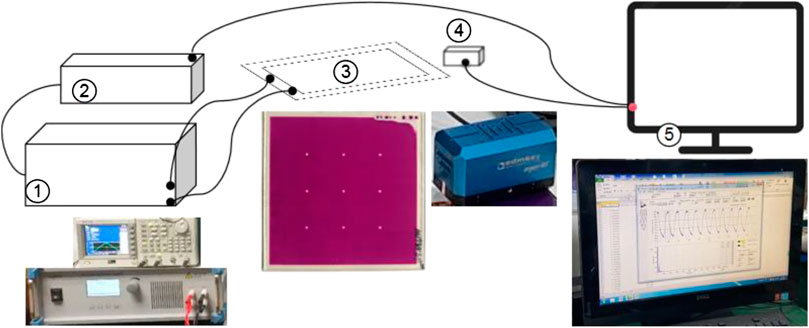
FIGURE 5. Experimental platform for EWDs. ① High voltage amplifier. ② waveform generator. ③ EWD. ④ Admesy colormeter. ⑤ Computer.
The colorimeter emits light with an angle of 45° to irradiate the pixels in an area. After the light is absorbed and transmitted by the pixels, it reaches the substrate for reflection. Then the colorimeter can monitor the intensity of the reflected light.
The driving waveform for measuring the hysteresis curve is shown in Figure 6. The driving waveform was a superposition of a staircase wave and a square wave. The AC driving frequency was obtained by measuring CV Curve. When the frequency of AC square wave was 500 Hz, a clear CV curve can be obtained, as shown in Figure 7. We used this frequency as the driving frequency of the driving waveform.
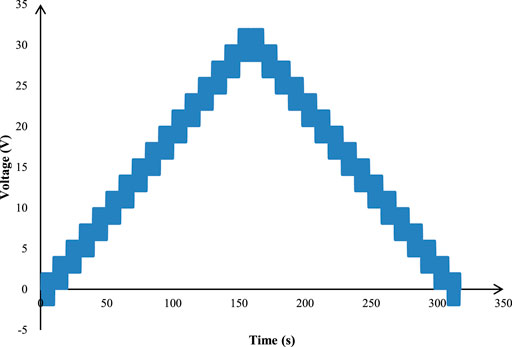
FIGURE 6. The waveform for measuring the hysteresis curve, the frequency of AC signal was 500 Hz, the voltage peak to peak was 1 V, step voltage was 2 V, step frequency was 0.2 Hz.
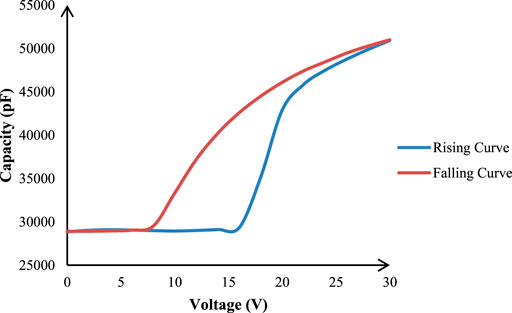
FIGURE 7. EWDs CV curve. In the rising curve, the threshold voltage was about 16 V. In the falling curve, the switch off voltage was about 7 V. The CV curve can also represent the curve of aperture and reflectivity. When the x-axis was less than 7, the rising edge curve was coincided with the falling edge curve.
By the analysis and comparison of the experimental results with different frequencies, it was found that the oil backflow phenomenon become slower when the driving frequency was 0.5 Hz. As shown in Figure 8, we used five different driving frequencies for comparative experiments. From the experimental data, it can be seen that oil backflow was more serious than the frequency of 0.05 KHz. And the fluctuations in luminance were visible at the frequency of 0.05 KHz.
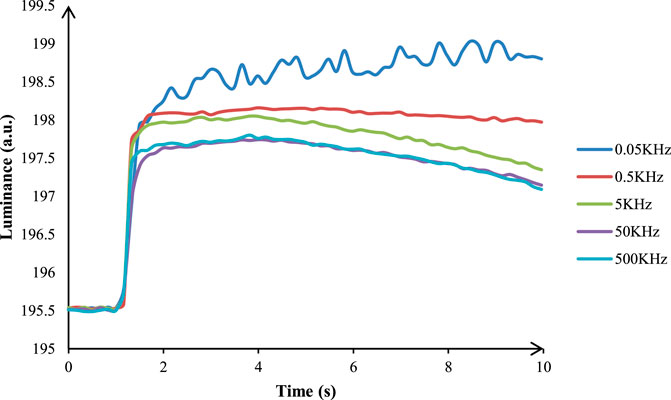
FIGURE 8. Oil backflow with different driving frequencies. The oil could maintain stability at the frequency of 0.05 KHz. The driving waveform at frequency of 0.5 KHz had a good backflow phenomenon, and the aperture could not be increased. The driving waveform at frequency of 5 KHz had a serious backflow phenomenon. The driving waveform at frequency of 50 KHz had a backflow phenomenon and could reduce the aperture. The driving waveform at frequency of 500 KHz had the same driving effect as 50 KHz.
The zero voltage helps to delay the phenomenon of charge trapping, and the phenomenon of charge trapping gradually increases as the driving frequency gradually increases. Because the time at zero voltage is too short, the trapped charge cannot be released.
Duty cycle is an important parameter in the AC waveform design. The effective voltage value is also different when the duty cycle is different. According to the Lippman equation, the contact angle can be controlled by the duty cycle. We used 30 V DC voltage for 100 ms to open pixels for obtaining a same aperture, and then, the influence of different duty cycles on oil backflow and response time were studied by the AC waveform, as shown in Figure 9.
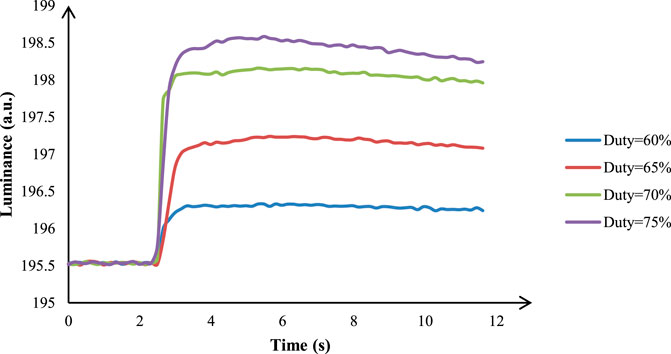
FIGURE 9. Oil backflow and response time with the different duty cycles. The waveform had the least response time when Duty = 70%. The smaller the duty cycle, the smaller the effective voltage and the smaller the brightness value of EWDs.
The duty cycle directly affects the release of trapped charges. The duty cycle can effectively control the amount of trapped charge and the amount of released trapped charge. The amount of trapped charge is zero by adjusting duty cycle. So, the backflow can be suppressed.
The ITO electrode is oxidized and reduced to a metal element. As a result, the electric field cannot be formed due to the disconnection of top ITO, as shown in Figure 10. The maximum value of the reverse voltage was judged by the drop-down curve in the voltammetry. As shown in Figure 11, the measurement method uses a voltage range of −4 to 0 V, and the current value is recorded 2 s after the output voltage.
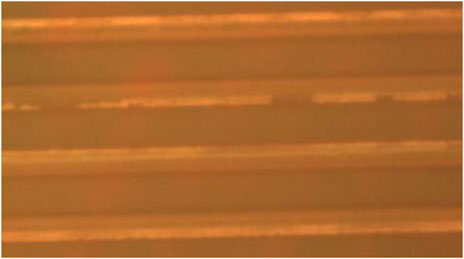
FIGURE 10. The electrochemical reaction between ITO and water. After the reaction, part of ITO was reduced to metal Sn, which gradually reduced the conductivity of ITO until it was completely non-conductive.
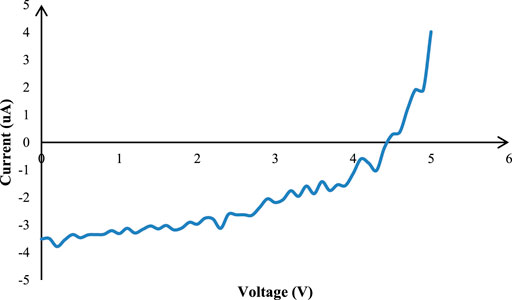
FIGURE 11. The drop-down curve of voltage and current, voltage step amplitude was −0.1 V, step time was 1 s. As the voltage gradually decreased, the current of the device gradually decreased.
It can be seen in Figure 12 that the greater the reverse voltage, the faster the oil backflow. In order to analyze the speed of backflow more intuitively, we simplified the backflow curve to a straight line. We can intuitively see the trend of oil backflow, as shown in Table 2. It had the best performance when the reverse voltage was −1 V.
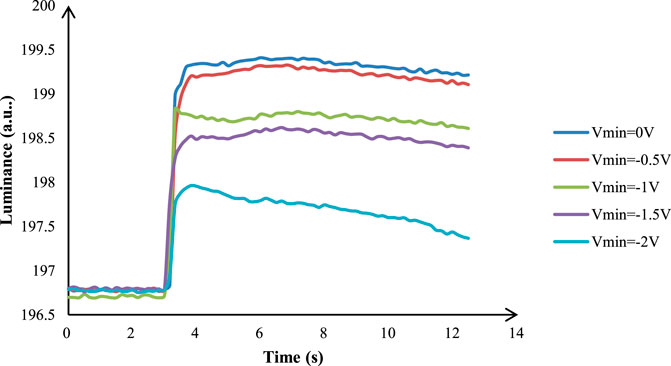
FIGURE 12. Oil backflow with different reverse voltages. A bigger reverse voltage could reduce the initial aperture, and the backflow phenomenon was enhanced by a high reverse voltage.
The PWM was often used to drive EWDs. But the response time was too long in PWM waveform, so we compared the response time of a DC waveform, as shown in Figure 13. The mixed DC and AC waveform response time was less than 300 ms, and the DC waveform response time was about 2.5 s. In a traditional PWM waveform, pixels were periodically switched on and off, which was the main energy for pushing oil and maintaining state. PWM waveform had a certain inhibition effect on oil backflow. The traditional PWM waveform was similar to the AC waveform with a reverse voltage of 0 V, and the linear slope was −0.0162. In the mixed DC and AC waveform, the oil was pushed by DC waveform, and the oil maintaining state depended on AC waveform. After adding a reverse voltage (−1 V) and using 70% duty cycle to the AC waveform, the oil backflow phenomenon was better than the PWM waveform, and the linear slope was −0.0043.
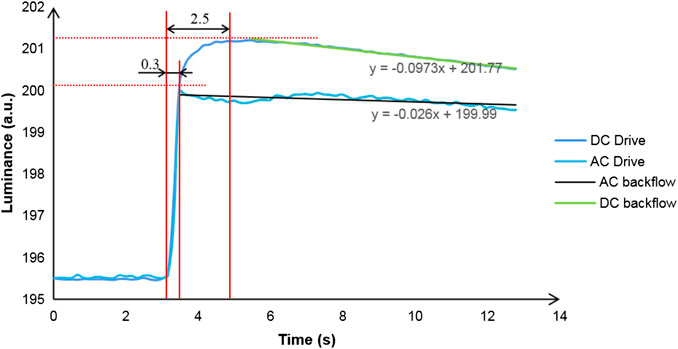
FIGURE 13. Comparison of response time and backflow phenomenon with different driving waveforms. The AC waveform can inhibit the slow growth of aperture and suspend the backflow phenomenon.
This paper analyzed the driving principle of EWDs. Then, compared the oil backflow and response time among existing driving waveforms. According to the polar solution of water, a design method of adding a safe reverse voltage was proposed. We divided the driving waveform into DC and AC according to different functions, which improved the response time and the oil backflow phenomenon. The driving waveform had better performance for static and dynamic display in EWDs.
The raw data supporting the conclusions of this article will be made available by the authors, without undue reservation.
ZW and TZ carried out most of the experiments and data analysis. WL and SL assisted in writing this paper. LW and PB provided theoretical guidance for this paper.
Supported by the National Key Research and Development Program of China (2016YFB0401502), Scientific research project of Guangdong Education Department (No. 2020ZDZX3083), Key-Area Research and Development Program of Guangdong Province (no. 2019B010924002) and Program for Guangdong Innovative and Enterpreneurial Teams (No. 2019BT02C241), Guangdong Provincial Key Laboratory of Optical Information Materials and Technology (No. 2017B030301007) and the 111 Project.
The authors declare that the research was conducted in the absence of any commercial or financial relationships that could be construed as a potential conflict of interest.
1. Bai PF, Hayes RA, Jin ML, Shui LL, Yi ZC, Wang L, et al. Review of paper-like display technologies (invited review). Prog Electromagn Res (2014) 147:95–116. doi:10.2528/PIER13120405
2. Yi ZC, Bai PF, Wang L, Zhang X An electrophoretic display driving waveform based on improvement of activation pattern. J Cent South Univ (2014) 21(8):3133–7. doi:10.1007/s11771-014-2285-9
3. Wang L, Yi ZC, Jin ML, Shui LL, Zhou GF. Improvement of video playback performance of electrophoretic displays by optimized waveforms with shortened refresh time. Displays (2017) 49:95–100. doi:10.1016/j.displa.2017.07.007
4. Roques CT, Hayes RA, Feenstra BJ, Schlangen L. Liquid behavior inside a reflective display pixel based on electrowetting. J Appl Phys (2004) 95(8):4389–96. doi:10.1063/1.1667595
5. Feenstra BJ, Hayes RA, Dijk R, Boom RGH, Wagemans MMH, Camps IGJ, et al. Electrowetting-based displays: bringing microfluidics alive on-screen. In: 19th IEEE international conference on micro electro mechanical systems; 2006 Jan 22–26; Istanbul, Turkey. IEEE (2006). p. 48–53. doi:10.1109/MEMSYS.2006.1627733
6. Yi ZC, Feng HQ, Zhou X, Shui LL. Design of an open electrowetting on dielectric device based on printed circuit board by using a parafilm M. Front Phys (2020) 8:193. doi:10.3389/fphy.2020.00193
7. Li W, Wang L, Zhang TY, Lai SF, Liu LW, He WY, et al. Driving waveform design with rising gradient and sawtooth wave of electrowetting displays for ultra-low power consumption. Micromachines (2020) 11:145. doi:10.3390/mi11020145
8. Yi ZC, Liu L, Wang L, Li W, Shui LL, Zhou GF. A driving system for fast and precise gray-scale response based on amplitude-frequency mixed modulation in tft electrowetting displays. Micromachines (2019) 10:732. doi:10.3390/mi10110732
9. He WY, Yi ZC, Shen ST, Huang ZY, Liu LW, Zhang TY, et al. Driving waveform design of electrophoretic display based on optimized particle activation for a rapid response speed. Micromachines (2020) 11:498. doi:10.3390/mi11050498
10. Wang L, Yi ZC, Peng B, Zhou GF. An improved driving waveform reference grayscale of electrophoretic displays. Proc SPIE (2015) 9672:967204. doi:10.1117/12.2199212
11. Jiang CD, Tang B, Xu BJ, Groenewold J, Zhou GF. Oil conductivity, electric-field-induced interfacial charge effects, and their influence on the electro-optical response of electrowetting display devices. Micromachines (2020) 11:702. doi:10.3390/mi11070702
12. Shen ST, Gong YX, Jin ML, Yan ZB, Xu C, Yi ZC, et al. Improving electrophoretic particle motion control in electrophoretic displays by eliminating the fringing effect via driving waveform design. Micromachines (2018) 9(4):143. doi:10.3390/mi9040143
13. Giraldo A, Massard R, Mans J, Derchx E, Aubert J, Mennen J, 10.3: ultra low-power electrowetting-based displays using dynamic frame rate driving (2011). Oxford, UK: Blackwell Publishing Ltd. SID Symposium Digest of Technical Papers 42. p. 114–7. doi:10.1889/1.3621027
14. Jiang CD, Tang B, Xu BJ, Groenewold J, Zhou GF. Oil conductivity, electric-field-induced interfacial charge effects, and their influence on the electro-optical response of electrowetting display devices. Micromachines (2020) 11(7):702. doi:10.3390/mi11070702
15. Yi ZC, Huang ZY, Lai SF, He WY, Wang L, Chi F, et al. Driving waveform design of electrowetting displays based on an exponential function for a stable grayscale and a short driving time. Micromachines (2020) 11(3):313. doi:10.3390/mi11030313
16. You H, Steckl AJ. Lightweight electrowetting display on ultra-thin glass substrate. J Soc Inf Disp (2013) 21(5):192–7. doi:10.1002/jsid.169
17. Roques CT, Palmier S, Hayes RA, Schlangen L. The effect of the oil/water interfacial tension on electrowetting driven fluid motion. Colloid Surface Physicochem Eng Aspect (2005) 267(1–3):56–63. doi:10.1016/j.colsurfa.2005.06.056
18. Moon H, Cho SK, Garrell R. Low voltage electrowetting-on-dielectric. J Appl Phys (2002) 92(7):4080–7. doi:10.1063/1.1504171
19. Murade CU, Oh JM, Ende D, Mugele F. Electrowetting driven optical switch and tunable aperture. Optic Express (2011) 19(16):15525–31. doi:10.1364/OE.19.015525
20. Barman J, Pant R, Nagarajan AK, Khare K. Electrowetting on dielectrics on lubricating fluid-infused smooth/rough surfaces with negligible hysteresis. J Adhes Sci Technol (2017) 31(2):159–70. doi:10.1080/01694243.2016.1205245
21. Massard R, Mans J, Adityaputra A, Leguijt R, Staats C, Giraldo A. Colored oil for electrowetting displays. J Inf Disp (2013) 14(1):1–6. doi:10.1080/15980316.2012.751939
22. Chiu YH, Liang CC, Chen YC, Lee WY, Chen HY, Wu SH. Accurate-gray-level and quick-response driving methods for high-performance electrowetting displays. J Soc Inf Disp (2011) 19(11):741–8. doi:10.1889/JSID19.11.741
23. Yi ZC, Shui LL, Wang L, Jin ML, Hayes RA, Zhou GF. A novel driver for active matrix electrowetting displays. Displays (2015) 37:86–93. doi:10.1016/j.displa.2014.09.004
24. Luo ZJ, Zhang WN, Liu LW, Xie ST, Zhou GF. Portable multi-gray scale video playing scheme for high-performance electrowetting displays. J Soc Inf Disp (2016) 24(6):345–54. doi:10.1002/jsid.444
25. Yi ZC, Feng WY, Wang L, Liu LM, Lin Y, He WY, et al. Aperture ratio improvement by optimizing the voltage slope and reverse pulse in the driving waveform for electrowetting displays. Micromachines (2019) 10(12):862. doi:10.3390/mi10120862
26. Jin ML, Shen ST, Yi ZC, Zhou GF, Shui LL. Optofluid-based reflective displays. Micromachines (2018) 9(4):159. doi:10.3390/mi9040159
27. Hayes RA, Feenstra BJ. Video-speed electronic paper based on electrowetting[J]. Nature (2003) 425(6956):383–5. doi:10.1038/nature01988
28. Zeng AP, Liu EQ, Tan SN, Zhang S, Gao J. Cyclic voltammetry studies of sputtered nitrogen doped diamond-like carbon film electrodes. Electroanalysis (2002) 14(15–16):1110–5. doi:10.1002/1521-4109(200208)14:15/16<1110::AID-ELAN1110>3.0.CO;2-E
Keywords: electrowetting display, low energy consumption, oil backflow, response time, electrochemical reaction, voltammetry
Citation: Liu L, Wu Z, Wang L, Zhang T, Li W, Lai S and Bai P (2020) Design of an AC Driving Waveform Based on Characteristics of Electrowetting Stability for Electrowetting Displays. Front. Phys. 8:618752. doi: 10.3389/fphy.2020.618752
Received: 18 October 2020; Accepted: 18 November 2020;
Published: 10 December 2020.
Edited by:
Chongfu Zhang, University of Electronic Science and Technology of China, ChinaReviewed by:
Jitesh Barman, Banaras Hindu University, IndiaCopyright © 2020 Liu, Wu, Wang, Zhang, Li, Lai and Bai. This is an open-access article distributed under the terms of the Creative Commons Attribution License (CC BY). The use, distribution or reproduction in other forums is permitted, provided the original author(s) and the copyright owner(s) are credited and that the original publication in this journal is cited, in accordance with accepted academic practice. No use, distribution or reproduction is permitted which does not comply with these terms.
*Correspondence: Pengfei Bai, YmFpcGZAc2NudS5lZHUuY24=
Disclaimer: All claims expressed in this article are solely those of the authors and do not necessarily represent those of their affiliated organizations, or those of the publisher, the editors and the reviewers. Any product that may be evaluated in this article or claim that may be made by its manufacturer is not guaranteed or endorsed by the publisher.
Research integrity at Frontiers

Learn more about the work of our research integrity team to safeguard the quality of each article we publish.