- 1School of Precision Instruments and Opto-electronics Engineering, Tianjin University, Tianjin, China
- 2Tianjin Key Laboratory of Biomedical Detecting Techniques and Instruments, Tianjin, China
Continuous monitoring of in vivo pulsatile blood flow and pulse wave velocity (PWV) is important for clinical applications. These parameters are correlated with physiological parameters, such as blood pressure and elasticity of blood vessels. A multimode fiber diffuse speckle contrast analysis (MMF-DSCA) system was developed for fast measurement of in vivo pulsatile blood flow and pulse wave velocity. With MMF and CCD sensor, the diffuse speckle could be captured and processed with higher temporal resolution of 3 ms. We also induced for the first time an MMF-DSCA for evaluation of PWV, which allows estimation of the blood pressure continuously. To validate its performance, both phantom and in vivo experiments were conducted. The results demonstrate that MMF-DSCA could achieve fast pulsatile blood flow measurement with detailed information of the pulse wave profile and velocity. Taking the advantages of being simple and cost-effective, the flexible system can be easily adapted for continuous monitoring of vital biosigns, such as heart rate, pulse wave, and blood pressure.
Introduction
Cardiopulmonary parameters, such as pulse wave velocity (PWV) and heart rate, are crucial for clinical diagnosing and daily healthcare monitoring [1]. PWV is the speed of the pulse wave generated by the heart and transfers along the arterials. It is considerably high (5–15 m/s) and carries information of cardiovascular function and vessel viability [2]. The monitoring and analysis of PWV provide a good vital biomarker to assess the status of cardiovascular system and microcirculation [3–6]. In clinic applications, PWV in the aorta has been estimated by measuring the delay in the foot of the wave between ascending aorta and femoral artery. But the intelligent instruments and skillful operators are needed to obtain reliable results. On the other hand, assessment of PWV is also important for daily healthcare monitoring, especially for infants and elderly [7].
Taking the advantages of noninvasive and real-time measurement, optical approach is an attractive way to measure in vivo blood perfusion, heart rate, and pulse wave. Most of the optical modalities require a coherent light source and follow the working principle of dynamic light scattering [8]. Laser speckle contrast imaging (LSCI) is a powerful tool for wide-field blood flow imaging of superficial tissue [9–11]. But the penetration depth limits its applications in deep tissue blood flow and PWV measurement. Considering the highly scattering properties of biological tissue, diffuse optical methods have been developed for blood flow index (BFI) measurement and obtaining the fast pulsatile blood flow in deep tissue. Among these methods, diffuse correlation spectroscopy (DCS) system [12–14] adopts high-sensitivity single-photon counting and correlator, which increases the hardware cost significantly with multiple channels. However, the fiber-based diffuse speckle contrast analysis (DSCA) system [15, 16] can be extended into multiple channels without significant additional cost and is still able to obtain deep tissue blood perfusion information at satisfied accuracy. Similar to LSCI, DSCA could perform with spatial processing algorithm, which will provide better temporal resolution.
Taking the advantages of flexibility and robustness, fiber-based diffuse optical methods are very popular in clinical applications of deep tissue blood flow measurement. Many systems use multimode (MM) source fiber [7, 17] to obtain the contrast information from the diffuse laser speckles and extract blood flow information. Therefore, it is also possible to use MM detection fiber combined with area array camera for diffuse pattern detection [18]. That makes the measurement rate of deep tissue blood flow the same as the frames per second (fps) of camera. Although sensing of pulsatile blood flow and heart rate has been previously demonstrated, other parameters such as PWV have not been further investigated. The previous works also indicated that PWV is highly related to the blood pressure (BP) and age [19]. Studying the properties and velocity of pulse wave of macro- and microcirculations may lead to an early diagnosis of many disorders [20].
In this paper, we presented a method for fast pulsatile blood flow and pulse wave velocity measurement in deep tissue. With the MM fiber delivering speckles pattern into the CCD sensor, the diffuse speckle contrast could be calculated spatially at each frame. The MMF-DSCA system achieves 300 Hz simultaneous measurement of pulsatile blood flow, which is further used to determine the pulse shapes and temporal delays propagation through the arterial tree. Both phantom validation and in vivo blood flow measurement are demonstrated. Thus, the linear regression model gives a good approximation between the BP and PWV. It is demonstrated that MMF-DSCA is one of the fastest noninvasive methods for deep tissue blood flow and pulse wave measurement. Taking the advantages of being simple and cost-effective, MMF-DSCA system can be easily adapted for clinical applications, such as continuous monitoring of heart rate, pulse wave, and blood pressure.
Materials and Methods
Theoretical Background
From theoretical analysis, DCS and LSCI probe different aspects of the field autocorrelation curve, which shows how fast the optical signal loses its self-similarity [21]. The decay rate of this curve is a good indicator of flow speed. From DCS measurements, it is necessary to extract the speed by calculating the electric field temporal autocorrelation function
where
When a coherent light illuminates the blood perfused tissue, the speckle pattern is decorrelated. The level of blurring is quantified by the speckle contrast value, which could be calculated by the following equation [24]:
where
Previous work established the fact that both speckle contrast and intensity autocorrelation carried information about the blood flow. Under certain conditions, the recovery of blood flow using both speckle contrast and field/intensity autocorrelation is equivalent. The contrast has the maximal sensitivity if the exposure time is of the order of the correlation time. And there is a linear correlation [25] between
When the MMF is used, photons from the source fiber experience multiple scattering. The diffuser photons that reach the detector fiber will carry the information of blood flow in deep tissue. Because the speckle pattern output by an MMF is not ideal, it is necessary to correct the raw speckle pattern. In each measurement, we average 3,000 images and normalize them to the maximum intensity as the background intensity IM (x,y). The raw speckle pattern Io (x,y) will be divided by IM (x,y) to obtain the corrected result I (x,y), which is used for spatial speckle contrast calculation [18].
Pulse Wave Analysis
With MMF-DSCA system, BFI can be calculated spatially from each frame captured by the CCD camera. That makes the sampling rate much faster than DCS systems. The pulsatile changes of BFI are related to the pulse wave, which is an indicator of cardiovascular status. The frequency spectrum of pulse wave provides additional information about the speed transverse to the beam axis, and this initial result merits a more detailed investigation. In this study, the frequency characteristic was analyzed and extracted by the Fourier transform, as
where f represents the frequency of signal, N is the length of signal, and
The diastolic time is an important parameter that is highly related to the systolic blood pressure (SBP) and diastolic blood pressure (DBP). To determine the diastolic time, the first-order derivative algorithm was applied to the time-domain pulse waveform to obtain the characteristic points within one cycle. Then, linear regression analysis was performed between the diastolic time and BP.
As the pulse wave propagates through the arterial tree from the heart to the periphery, pulse wave velocity could be estimated by recording the pressure wave transition time (PTT) between two selected areas in the arterial tree. In this study, we choose the forearm and fingertip as the measuring locations. Considering time-varying BFI signal obtained at adjacent locations in forearm (F1) and fingertip (F2), when the pulse wave travels from F1 to F2, the BFI feature keeps constant in the stream, resulting in the time series of F1B(t) and F2B(t) appearing in nearly identical shapes with a time lag of τ. Then, the cross-correlation function is used to determine the time delay between two time-varying dynamic speckle signals, as follows:
where
where L is the arterial length between two selected areas.
Experimental Setup
The setup of MMF-DSCA system is shown in Figure 1. A long coherence length (>10 m) laser diode (785 nm, 15 mW, LP785-SAV50, Thorlabs, United States) was used to illuminate the sample. In order to achieve synchronization, a 50:50 1 × 2 fiber coupler was used to split the light into two identical MMFs (d = 200 μm, NA = 0.22). For in vivo measurement, the first fiber was attached to the subject’s forearm, near the brachial artery, while the second fiber was attached to the subject’s fingertip. Two multimode fibers were used as detector fibers with the other ends touching onto the CCD directly. The distance of source-detector fiber can be adjusted in the range of 5–20 mm. To avoid the need to synchronize two cameras, the diffuse speckle pattern of both fibers was collected by a single CCD camera (Basler aca1920–155um, Germany). The magnification was adjusted to make sure the speckle patterns from the two fibers are projected without overlapping and meet the requirement of diffuse speckle sampling.
For speckle analysis, both the spatial resolution and exposure time are important for the sensitivity and dynamic range of flow measurement. In the MMF-DSCA system, the multimode fibers with core diameter of 200 um were used to collect the diffuse speckle of in vivo tissue, resulting in the spatial resolution of 0.2 mm. The size of a single speckle is about 11 μm, which is twice the size of a single pixel size of 5.6 μm. That satisfies the Nyquist sampling criterion and maximizes the contrast of the imaged speckle pattern. However, each MMF speckle pattern contains more than 1,000 speckles, which provides a sufficient statistical sample to analyze the spatial speckle contrast. The exposure time is also important for the sensitivity and SNR of blood flow measurement. Dunn’s results suggested that any exposure time greater than 2 ms will provide optimal sensitivity to blood flow changes [27]. However, the exposure time should also meet the requirement of monitoring the pulsatile blood flow. Considering temporal resolution for pulse wave monitoring, we set the exposure time to be 3 ms.
In this paper, the diffuse speckle contrast was calculated spatially from each frame, resulting in that the temporal resolution for blood flow measurement is approximately 3.3 ms. The corresponding cross-correlation is calculated with Eq. 7, which has the same temporal resolution of 3.3 ms. According to the distance between two locations and the speed of PWV, the time delay of pulse waves is generally over 30 ms. It is demonstrated that the MMF-DSCA system has a sufficiently high temporal resolution for PWV measurement.
Most of the arteries are in the subcutaneous layer with depth varying from 2 to 10 mm below the surface. According to the theory of diffuse optics, the effective detection depth is around a half of source-detector separation. Since source-detector separation is 15 mm with in vivo measurement, the diffuse speckle signal is mainly from the depth range around 7.5 mm. The penetration depth is also demonstrated with Monte Carlo simulations and phantom experiments. The cloud map of the light intensity with Monte Carlo simulation is shown in Figure 1. The simulation results indicated that the penetration depth of diffuse light collected by the detection fibers is in the range of 5–12 mm. Based on the distribution of photon number and penetration depth, the average penetration depth is further calculated to be 7 mm, which agrees with the theory of diffuse optics. The depth of MMF-DSCA measurement is also validated by the phantom experiments.
Phantom Experiments
To verify the performance of the system in deep tissue flow measurement, a phantom experiment was designed with a hollow plastic tube that was embedded inside a solid scattering phantom body (μa = 0.01 mm−1, μs = 0.4 mm−1). The tube was buried 5 mm underneath the phantom surface. Liquid with the similar scattering coefficient as blood was pumped through the tube by a peristaltic pump. Since the liquid was pumped by pinching the rubber tube through the rotating rollers of the peristaltic pump, a higher flow rate could be achieved by increasing the pinching frequency. During the experiment, the pumping rate was set from 0 to 0.56 ml/s with step size of 0.07 ml/s.
In Vivo Measurements
For in vivo measurements, the subjects were requested to sit on a chair and keep still during the experiments. The experiments were carried out on 10 healthy volunteers (including seven males and three females) aged 24–26. To evaluate the relationship between PWV and BP, the experiments were performed on five individuals during the recovery period after the stair climbing exercise, and the interval of each measurement was 10 min (5 times in total). The blood pressure was also measured by a commercial BP monitor.
Results and Discussion
Phantom Result
As shown in Figure 2, the phantom results demonstrate the good correlation between the flow rate and
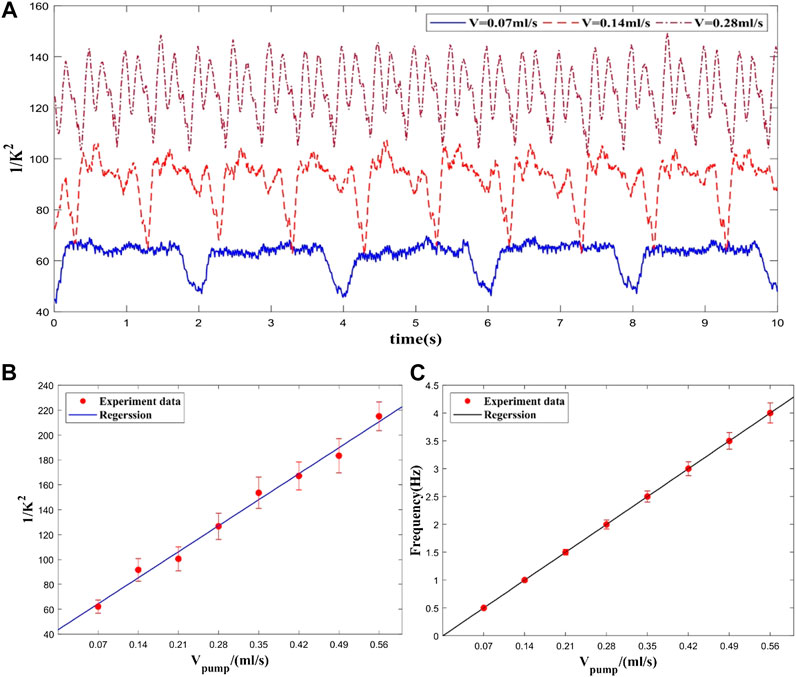
FIGURE 2. Experimental results at different flow rates. (A) Flow rate waveform at different pumping rates (only three velocities), (B) Averaged flow measurement at each flow rate. (C) Frequencies of flow rate waveforms at each flow rate.
In Vivo Result
Pulse Wave Measurement
The in vivo BFI measured with MMF-DSCA system are shown in Figure 3A. The temporal blood flow profile is in good agreement with previous research [28]. The pulse waveform in the forearm has more features within each cycle. Compared with the standard pulse waveform, the two obvious peaks are related to the main wave and the repulse wave. However, the pulse waveform from the wrist has sharper peaks and smoother repulse wave.
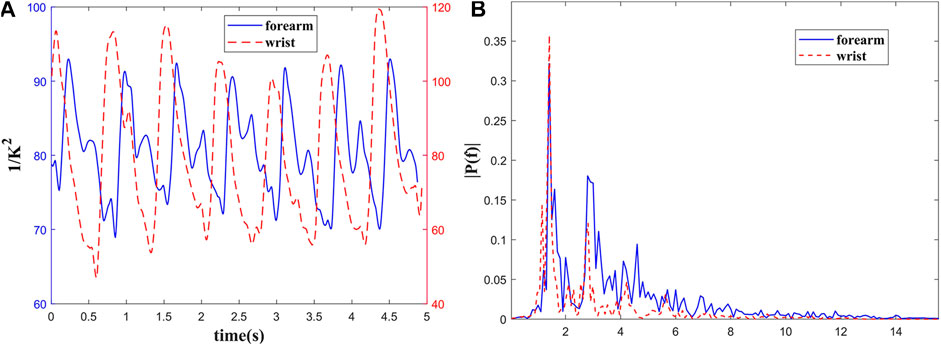
FIGURE 3. Blood flow measurement of a healthy subject’s (A) forearm and wrist; (B) the power spectrum of pulse wave.
To quantify this difference, the time-domain pulse wave signals were Fourier transformed as shown in Figure 3B. The power spectra of the pulse waves demonstrate that the energy in higher frequency of pulse wave on forearm is greater than wrist, which is consistent with temporal profile. Meanwhile, the energy of both pulse waves is concentrated in the range of 0.5–10 Hz. The peaks in 1.4, 2.8, and 4.2 Hz are related to the heartbeat rate and its higher harmonic frequencies. It can be concluded that the frequency spectrum distribution of pulse waves in different parts of the human body is relatively consistent.
Compared with forearm, the radial artery at the wrist is shallower and far from heart. That makes its ascending branch steeper. As shown in Figure 3, the position and amplitude of the repulse wave descend, and the sharp corners of the waveform are smoother. The time-domain and frequency-domain characteristics of the pulse waves measured with our system also agree with the pulse theory [29].
Correlation Between Blood Pressure and Pulse Wave
In order to analyze the features of the pulse wave in more detail, the individual waveforms of one heart beat were averaged during a period of five adjacent pulse cycles. After baseline correction and noise reduction, the division of temporal pulse wave characteristics is shown as Figure 4A. With systolic peak, dicrotic notch, and diastolic runoff, the well-known characteristics for arterial pulsation behavior could be observed clearly. The waveform of the directed movement shows three peaks located at 0.93 ms, 1.08 ms, and 1.15 ms and relative heights of 87.25, 83.30, and 84.31, respectively. Among them, the first peak (P1) represents maximum vascular pressure and there is a shoulder compared to a second peak (P2) and is followed by a shallower third peak (P3). The diastolic time could be calculated with first-order differential algorithm and selected to validate the correlation between the temporal characteristic and BP.
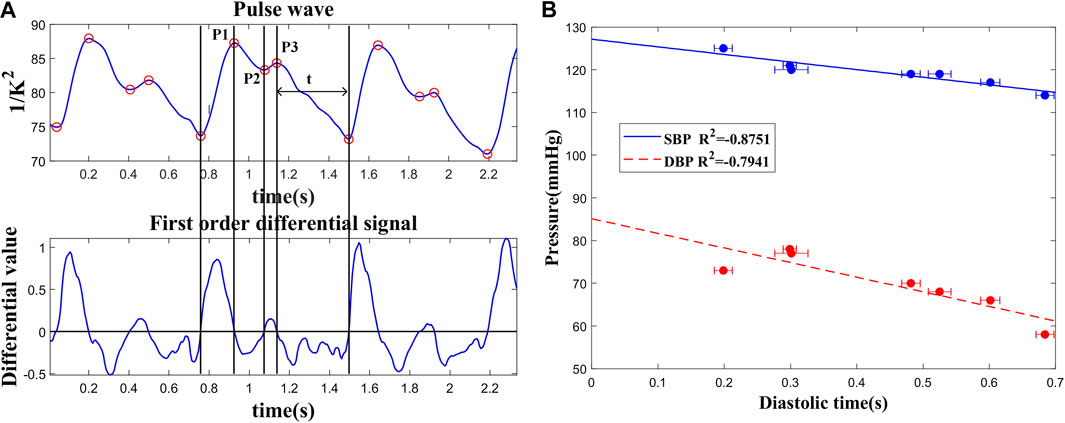
FIGURE 4. (A) Recognition of characteristic points of pulse wave and division of time periods. (B) Correlation of the diastolic time and blood pressure.
The linear relationship between the diastolic time and BP (SBP and DBP) is shown in Figure 4B. Because the diastolic period occupies most of the time in a cardiac cycle, the amount of blood transported by the large artery to the periphery may decrease with the reduction of diastolic time. As a result, the vascular part is filled with blood and induces a much higher pressure. These results were measured during the resting period on seven volunteers. Diastolic times (t) and BP measured with different volunteers all passed the t test with significant p < 0.05. The result demonstrates that the diastolic time could be preliminarily used for BP prediction.
To test the reliability and consistency of this approach, the in vivo experiments were conducted with seven healthy subjects. Every subject was tested more than 10 times. The statistical parameters, such as the average value and standard deviation, were calculated with each subject’s results. As shown in Figure 4, the diastolic time varied in the range of 5% with stable PWV measurement.
Correlation Between Blood Pressure and Pulse Wave Velocity
To obtain the PWV, the pulse waves of forearm and fingertip were measured simultaneously. As shown in Figure 5, in addition to the different pulse shape, the pulse wave of fingertip is slightly delayed to forearm. The time delay between two locations is caused by the pressure wave propagation along the artery tree. At the cardiac frequency, the mean delay time is about 33.34 ms. Accordingly, the length of the arterial tree pass between the measured spots was about 34.50 cm. Based on Eq. 9, the PWV is about 10.36 m/s. Given the PWV determined in the human vascular system, as well as the theory of pulse propagation, our results seem realistic.
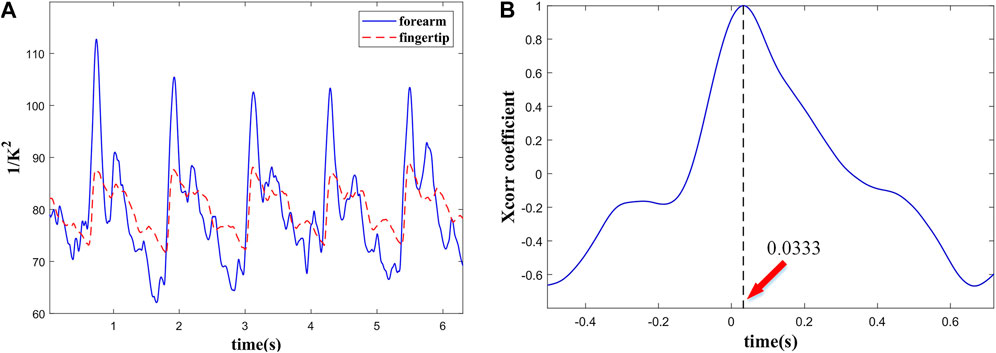
FIGURE 5. (A) Simultaneous recording of pulse wave from the forearm and the fingertip and (B) PTT between them.
To determine the relationship between BP and PWV, the experiments were performed on five subjects. During exercise, the cardiac output and blood velocities are both increasing. That may cause additional flow resistance and consequent raise of blood pressure. The experimental results were approximated and validated by linear regression and presented in Figure 6. The coefficient of determination values between the SBP and PWV is in the range of 0.88–0.95. Thus, the linear regression model gives a good approximation between BP and PWV. However, SBP is highly related to the blood vessel elasticity, because it is caused by the heart's active and instantaneous pumping of blood. A rise in SBP causes temporary stiffening of the vessels, which results in a higher PWV. Meanwhile, DBP, which is related to the diastolic time and vascular recovery period, is not sensitive to changes in blood vessel elasticity. As a result, linear approximation of the relation between DBP and PWV shows lower level of correlation.
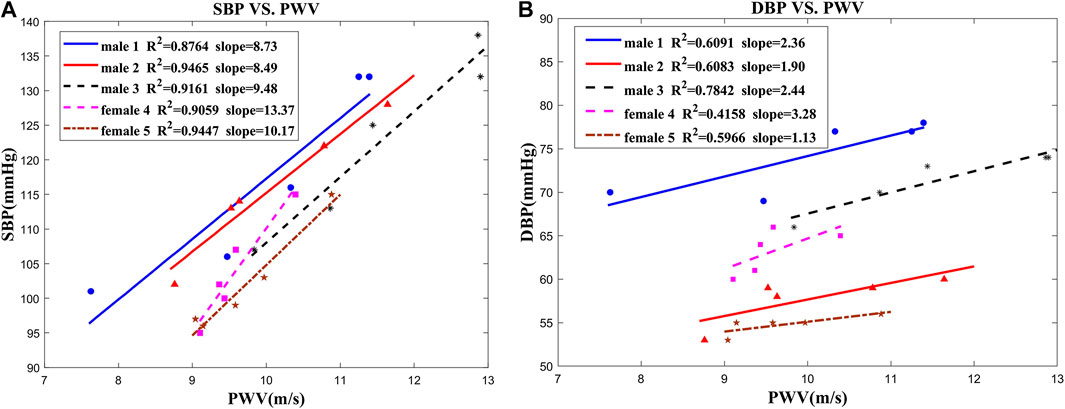
FIGURE 6. Correlation between blood pressure and PWV in five subjects: (A) SBP vs. PWV; (B) DBP vs. PWV.
These results demonstrated that MMF-DSCA system achieved fast pulsatile blood flow measurement and extraction of the PWV and BP. However, this system and method also have some disadvantages. The fiber probe needs to be fixed on the location, and the measurement may be influenced by the motion artifacts. In clinical applications, the artifacts can be eliminated with improvements of fiber probe design and signal process. The fiber probe should be carefully designed and combined with special cuffs to fix the probe more stably on the arm and fingertip. Because the motion artifacts are generally embodied as DC or low-frequency signals, high-pass filtering can be used to eliminate the artifacts. Therefore, modern signal process methods, such as wavelet and empirical transverse decomposition filtering method, should also be used for further processing. Furthermore, with multiwavelength light sources, this system could be extended to measure oxygen saturation.
Conclusion
We present an MMF-DSCA system for measuring instantaneous blood flow and pulse wave velocity in deep tissue. With a CCD sensor, the diffuse speckle could be captured and processed at each frame. This approach enabled the observation of PWV in deep tissue with a temporal resolution of 3 ms. Optical synchronization of the speckle patterns measured in different body parts was achieved by using 2 MM fibers and a single CCD camera. The simultaneous measurement of pulsatile blood flow in different parts could be further analyzed to obtain the pulse wave characteristics. In this work, we also induced for the first time MMF-DSCA system for evaluation of PWV, which allows estimation of the systolic blood pressure. Taking advantages of being simple and cost-effective, the flexible system will be further developed for continuous monitoring of vital biosigns, such as heart rate and blood pressure, as part of individual healthcare.
Data Availability Statement
The original contributions presented in the study are included in the article/Supplementary Material, further inquiries can be directed to the corresponding author.
Ethics Statement
Ethical review and approval was not required for the study on human participants in accordance with the local legislation and institutional requirements. The patients/participants provided their written informed consent to participate in this study.
Author Contributions
CL was responsible for conceptualization, project administration, and funding acquisition. ZT was responsible for methodology, software, validation, formal analysis, investigation, data curation, and writing—original draft preparation. WC was responsible for resources and visualization. HX was responsible for writing—review and editing. FG was responsible for supervision. All authors have read and agreed to the published version of the manuscript.
Conflict of Interest
The authors declare that the research was conducted in the absence of any commercial or financial relationships that could be construed as a potential conflict of interest.
Acknowledgments
The authors thank every volunteer who offered help with the experiments. The authors acknowledge the financial support provided by the National Natural Science Foundation of China (81871396, 81971657, 81871393, and 81671727) and Tianjin Natural Science Foundation (19JCYBJC29100 and 19JCTPJC42200).
References
1. Hoilett SO, Twibell AM, Rohit S, Linnes CJ. Kick ll: a smartwatch for monitoring respiration and heart rate using photoplethysmography. In: 2018 40th Annual international conference of the IEEE engineering in medicine and biology society; 2018 July 18–21; Honolulu, HI. Hawaii: IEEE (2018). p. 3821–3824. doi:10.1109/EMBC.2018.8513356
2. Townsend RR, Wimmer NJ, Chirinos JA, Parsa A, Weir M, Perumal K, et al. Aortic PWV in chronic kidney disease: a CRIC ancillary study. Am J Hypertens (2010) 23(3):282–9. doi:10.1038/ajh.2009.240
3. JoffeLash A, Morrell CH, Fegatelli DA, Fiorillo E, Delitala A, Orru' M, et al. Arterial stiffness and multiple organ damage: a longitudinal study in population. Aging Clin Exp Res (2020) 32(5):781–8. doi:10.1007/s40520-019-01260-0
4. CuccaMarongiu XN, Gao HQ, Li BY, Cheng M, Ma YB, Zhang ZM, et al. Pulse wave velocity as a marker of arteriosclerosis and its comorbidities in Chinese patients. Hypertens Res (2007) 30(3):237–42. doi:10.1291/hypres.30.237
5. WangGao AY, Mohamed MS, Ibrahim S, Hun TM, Musa KI, Yusof Z. Pulse wave velocity as a marker of severity of coronary artery disease. J Clin Hypertens (2010) 11(1):17–21. doi:10.1111/j.1751-7176.2008.00061.x
6. Kim HL, Kim SH. Pulse wave velocity in atherosclerosis. Front Cardiovasc Med (2019) 6:41. doi:10.3389/fcvm.2019.00041
7. Bennett A, Beiderman Y, Agdarov S, Beiderman Y, Hendel R, Straussman B, et al. Monitoring of vital bio-signs by analysis of speckle patterns in a fabric-integrated multimode optical fiber sensor. Optic Express (2020) 28(14):20830–44. doi:10.1364/OE.384423
8. Zalevsky B, Jing D, Loo PC, Kijoon L. Optical methods for blood perfusion measurement--theoretical comparison among four different modalities. J Optic Soc Am A (2015) 32(5):860–6. doi:10.1364/JOSAA.32.000860
9. Boas DA, Dunn AK. Laser speckle contrast imaging in biomedical optics. J Biomed Optic (2010) 15(1):011109. doi:10.1117/1.3285504
10. Ring LL, Strandby RB, Henriksen A, Ambrus R, Sørensen H, Gøtze JP, et al. Laser speckle contrast imaging for quantitative assessment of facial flushing during mesenteric traction syndrome in upper gastrointestinal surgery. J Clin Monit Comput (2019) 33(5):903–10. doi:10.1007/s10877-018-0226-0
11. AchiamSvendsen JH, Nerup N, Strandby RB, Svendsen MBS, Ambrus R, Svendsen LB, et al. Laser speckle contrast imaging and quantitative fluorescence angiography for perfusion assessment. Langenbeck’s Arch Surg (2019) 404(4):1–11. doi:10.1007/s00423-019-01789-8
12. Buckley EM, Parthasarathy AB, Grant PE, Yodh AG, Franceschini MA. Diffuse correlation spectroscopy for measurement of cerebral blood flow: future prospects. Neurophotonics (2014) 1(1):011009. doi:10.1117/1.NPh.1.1.011009
13. Verdecchia K, Diop M, Lawrence KS. Investigation of the best model to characterize diffuse correlation spectroscopy measurements acquired directly on the brain. Biomed Appl Light Scatter (2015) Ix:9333. doi:10.1117/12.2079499
14. Kyle V, Mamadou D, Albert L, Morrison LB, Ting-Yim L, Keith SL. Assessment of a multi-layered diffuse correlation spectroscopy method for monitoring cerebral blood flow in adults. Biomed Optic Express (2016) 7(9):3659–74. doi:10.1364/BOE.7.003659
15. Bi R, Dong J, Lee K. Deep tissue flowmetry based on diffuse speckle contrast analysis. Opt Lett (2013) 38(9):1401–3. doi:10.1364/OL.38.001401
16. Huang C, Seong M, Morgan JP, Mazdeyasna S, Kim JG, Hastings JT, et al. Low-cost compact diffuse speckle contrast flowmeter using small laser diode and bare charge-coupled-device. J Biomed Optic (2016) 21(8):80501. doi:10.1117/1.JBO.21.8.080501
17. Yu T, Beiderman Y, Agdarov S, Beiderman Y, Zalevsky Z. Fiber sensor for non-contact estimation of vital bio-signs. Optic Commun (2017) 391:63–7. doi:10.1016/j.optcom.2017.01.013
18. Bi R, Du Y, Singh G, Ho CJ, Zhang S, Attia ABE, et al. Fast pulsatile blood flow measurement in deep tissue through a multimode detection fiber. J Biomed Optic (2020) 25(5):1–10. doi:10.1117/1.JBO.25.5.055003
19. OlivoLi EJ, Park CG, Park JS, Suh SY, Choi CU, Kim JW, et al. Relationship between blood pressure parameters and pulse wave velocity in normotensive and hypertensive subjects: invasive study. J Hum Hypertens (2007) 21(2):141–8. doi:10.1038/sj.jhh.1002120
20. OhKim L, Song Z, Wenming Y, Zibin Y. A research on characteristic information of pulse wave. J Beijing Polytech Univ (1996) 22(1):71–9.
21. D , urduran T, Choe R, Baker BW, Yodh GA. Diffuse optics for tissue monitoring and tomography. Reports on progress in physics. Phys Soc (2010) 73(7):76701–43. doi:10.1088/0034-4885/73/7/076701
22. Xie JB, He XD, Zhang LM, Li J, Qin ZP, Gao F. Diffuse correlation spectroscopy towards dynamic topography of blood flow index in deep tissues: a multi-channel system and experiment validation. Infrared Phys Technol (2020) 107:103298. doi:10.1016/j.infrared.2020.103298
23. Boas DA, Yodh AG. Spatially varying dynamical properties of turbid media probed with diffusing temporal light correlation. J Opt Soc Am A (1997) 14(1):192–215. doi:10.1364/JOSAA.14.000192
24. Bandyopadhyay R, Gittings AS, Suh SS, Dixon PK, Durian DJ. Speckle-visibility spectroscopy: a tool to study time-varying dynamics. Rev Sci Instrum (2005) 76(9):093110. doi:10.1063/1.2037987
25. Kim S, Kim M, Kim JG. Development of simple diffuse optical metabolic spectroscopy for tissue metabolism measurement. Biomed Optic Express (2019) 10(6):2956–66. doi:10.1364/BOE.10.002956
26. Ding X, Yan BP, Zhang YT, Liu J, Zhao N, Tsang HK. Pulse transit time based continuous cuffless blood pressure estimation: a new extension and A comprehensive evaluation. Sci Rep (2017) 7(1):11554. doi:10.1038/s41598-017-11507-3
27. Yuan S, Devor A, Boas DA, Dunn AK. Determination of optimal exposure time for imaging of blood flow changes with laser speckle contrast imaging. Appl Optic (2005) 44(10):1823–30. doi:10.1364/ao.44.001823
28. Michael G, Rice TB, Bruce Y, White SM, Tromberg BJ. Wearable speckle plethysmography (SPG) for characterizing microvascular flow and resistance. Biomed Optic Express (2018) 9(8):3937–52. doi:10.1364/BOE.9.003937
Keywords: pulse wave velocity, blood flow, multimode optical fibers, blood pressure, diffuse speckle
Citation: Teng Z, Gao F, Xia H, Chen W and Li C (2021) In Vivo Pulse Wave Measurement Through a Multimode Fiber Diffuse Speckle Analysis System. Front. Phys. 8:613342. doi: 10.3389/fphy.2020.613342
Received: 02 October 2020; Accepted: 09 December 2020;
Published: 19 January 2021.
Edited by:
Chao Tian, University of Science and Technology of China, ChinaReviewed by:
Peng Li, Zhejiang University, ChinaCheng Wang, University of Shanghai for Science and Technology, China
Copyright © 2021 Teng, Gao, Xia, Chen and Li. This is an open-access article distributed under the terms of the Creative Commons Attribution License (CC BY). The use, distribution or reproduction in other forums is permitted, provided the original author(s) and the copyright owner(s) are credited and that the original publication in this journal is cited, in accordance with accepted academic practice. No use, distribution or reproduction is permitted which does not comply with these terms.
*Correspondence: Chenxi Li, bGljaGVueGlAdGp1LmVkdS5jbg==
 Zhongshuai Teng
 Feng Gao1,2
 Chenxi Li