
94% of researchers rate our articles as excellent or good
Learn more about the work of our research integrity team to safeguard the quality of each article we publish.
Find out more
REVIEW article
Front. Phys., 14 January 2021
Sec. Medical Physics and Imaging
Volume 8 - 2020 | https://doi.org/10.3389/fphy.2020.606793
This article is part of the Research TopicInnovative Developments in Multi-Modality ElastographyView all 20 articles
 Juvenal Ormachea1*
 Fernando Zvietcovich2
There are a variety of approaches used to create elastography images. Techniques based on shear wave propagation have received significant attention. However, there remain some limitations and problems due to shear wave reflections, limited penetration in highly viscous media, requirements for prior knowledge of wave propagation direction, and complicated propagation in layers where surface acoustic waves and guided waves are dominant. To overcome these issues, reverberant shear wave elastography (RSWE) was proposed as an alternative method which applies the concept of a narrow-band diffuse field of shear waves within the tissue. Since 2017, the RSWE approach has been implemented in ultrasound (US) and optical coherence tomography (OCT). Specifically, this approach has been implemented in these imaging modalities because they are similar in image formation principles and both share several approaches to estimate the biomechanical properties in tissues. Moreover, they cover different spatial-scale and penetration depth characteristics. RSWE has shown promising results in the elastic and viscoelastic characterization of multiple tissues including liver, cornea, and breast. This review summarizes the 4-year progress of the RSWE method in US and OCT. Theoretical derivations, numerical simulations, and applications in ex vivo and in vivo tissues are shown. Finally, we emphasize the current challenges of RSWE in terms of excitation methods and estimation of biomechanical parameters for tissue-specific cases and discuss future pathways for the in vivo and in situ clinical implementations.
The biomechanical tissue properties are strongly tied to pathological and physiological states involving alterations of elasticity, viscosity, and structure [1–5]. It has been shown that changes in tissue stiffness, occur in various diseases such as cancers [6], calcification associated with arteriosclerosis [6], fibrosis associated with liver cirrhosis [7], and various ocular diseases such as keratoconus and glaucoma [5]. Therefore, the evaluation and assessment of the tissue stiffness could allow an early detection and treatment of numerous diseases and a better evaluation of the physiological conditions at different levels: cells, tissues, and organs.
Over the years, elastography as a medical imaging approach has been implemented in different imaging modalities including ultrasound (US) [8], magnetic resonance (MR) [9], and optical coherence (OC) tomography imaging [10], and new names were adopted: USE, MRE, OCE, respectively. USE and OCE are similar in their image formation principles and both share several approaches to estimate the biomechanical properties in tissues. However, they cover different spatial-scale and penetration depth characteristics. Each technique can be classified by spatial resolution, field-of-view limits, and displacement sensitivity. As an example, commercial USE can generate elasticity maps with resolution in the millimeter range at a depth penetration of approximately 1–7 cm, enabling the imaging of organ-size tissues. On the other hand, OCE offers spatial mechanical resolution in the micrometer range at a depth penetration of 1–10 mm, enabling the observation of diminutive tissues with higher resolution.
There are multiple approaches to the formation of elastography images. Those based on shear wave propagation, using continuous or transient waves, have been reported in multiple studies, but an inherent issue is the presence of reflected waves from organ boundaries and internal inhomogeneities [6, 11, 12]. The presence of reflected waves, propagating at the region of interest, may cause modal patterns applying continuous waves or backward traveling waves in transient wave experiments [13]. To overcome this problem, reverberant shear wave elastography (RSWE) was proposed as an alternative method which applies the concept of a narrow-band random isotropic field of shear waves within the tissue [14]. These multi-directional wave fields are naturally established (even unavoidable) in practical situations and can be reinforced by utilizing several shear sources near the tissues of interest. The reverberant shear wave field is produced by the interaction of multiple shear waves propagating in all possible random directions. This field promotes the propagation of shear waves in deeper areas (i.e., liver tissue in obese patients [15]), and at superficial areas (i.e., corneal tissue for layer characterization [16]) where surface acoustic waves could otherwise dominate. Moreover, this approach leads to a simple solution and implementation for the estimation of local tissue shear wavelength or shear wave speed (SWS). Since 2017, the reverberant shear wave approach has been implemented in USE and OCE with promising results in the elastic and viscoelastic characterization of a high variety of tissues including liver, cornea, and breast [13, 15–17]. For example, RSWE can evaluate the dispersion of shear wave speed, measuring the slope (change in SWS with change in frequency) or as a power law coefficient consistent with a more advanced framework of tissue rheology, by exciting the target organ with multiple vibration frequencies within a bandwidth [15, 17]. Thus, this approach is able to analyze the viscoelastic and lossy nature of the tissue under study.
In this work, we present the theory and application of the reverberant shear wave field method in USE and OCE. The following sections cover the fundamental theoretical derivations, numerical simulations, penetration and layer characterization capabilities, and ex vivo and in vivo applications. We present and discuss reverberant elastography results in calibrated phantoms and in vivo deep liver tissues using USE, and thin layered phantom characterization with ex vivo porcine cornea elastography using OCE. Finally, we emphasize the current challenges of reverberant elastography and discuss future pathways using multi-scale approaches and possible clinical implementations.
The reverberant shear wave field can be described as the superposition of plane shear waves propagating in random directions [18]. The theoretical description for plane shear waves traveling in different directions and, therefore, generating a reverberant field was first introduced by Parker et al. [14] for ultrasound shear wave elastography (SWE). Later, a more extensive description was presented by Zvietcovich et al. [16] for a 3-D reverberant field using OCE. In this Section, the analytical description is presented and summarized as follows (refer to Ref. 16 for further details): shear waves are transversal body-type waves, therefore, the particle velocity produced by these perturbations is perpendicular to the direction of propagation. For a given 3D point
where the index
If the particle velocity in Eq. 1 is measured along the z-axis, then
where
Finally, for the parallel case, the spatial autocorrelation of the reverberant field is taken along the z-axis and is given by [14, 16]:
The local wave number
where G is the shear modulus, and
The application of US-RSWE was performed using a Verasonics system (Vantage-128TM, Verasonics, Kirkland, WA, United States) connected to a convex ultrasound probe (model C4-2, ATL, Bothell, WA, United States) or a linear ultrasound probe (model L7-4, ATL, Bothell, WA, United States). This system was used to track the induced displacements using a Loupas estimator [20]. The linear probe was used for the breast phantom and breast tissue applications, whereas the convex probe was used for the viscoelastic phantom and liver tissue to scan at deeper areas [13, 15]. In Ref. 15, the center frequencies were 3 and 5 MHz for the convex and linear probes, respectively. The sampling frequency were 12 and 20 MHz for the convex and linear probes, respectively. The tracking pulse repetition frequency (PRF) was set to 3,600 Hz with a total acquisition time of 0.5 s. On the other hand, OCT-RSWE used a custom built spectral-domain phase-sensitive optical coherence tomography (PhS-OCT) system for the motion detection of waves generated in the sample by a synchronized mechanical excitation system [16]. The capturing of spectral interference signals was synchronized with the scanning of the light beam on the sample to produce 2D, 3D, or 4D OCT datasets. The Doppler phase shift detection scheme was implemented to monitor the propagation pattern of vibrational waves [21].
Figure 1 illustrates the different setups used to create the reverberant shear wave field. In Refs. 13 and 14, mechanical vibration sources (such as model 4810, Bruel and Kjaer, Naerum, Denmark), and miniature vibration sources (model NCM02-05-005-4 JB, H2W, Linear Actuator, Santa Clara, CA, United States) were used for initial experiments and proof of concept. Later, a custom-made portable trifold futon (70 × 60 × 10 cm3) including several embedded vibration sources (Quad Resonator Model EI718 TM, Elastance Imaging LLC, Columbus, OH, United States) was mounted to a clinical bed [15]. The active vibration sources generate strong displacements and shear waves into the body. The precise details of the active source configuration are proprietary to Elastance Imaging LLC. In Ref. 16, one of the ends of a piezoelectric bender (BA4510, PiezoDrive, Callaghan, NSW, Australia) was attached to a 3D printed ring containing eight vertical equidistant and circularly-distributed rods. The rods were slightly attached to the sample surface to produce the reverberant field after the piezoelectric bender was excited. The ring shape did not interfere with the OCT system to image the cornea, while the rods generate mechanical excitations.
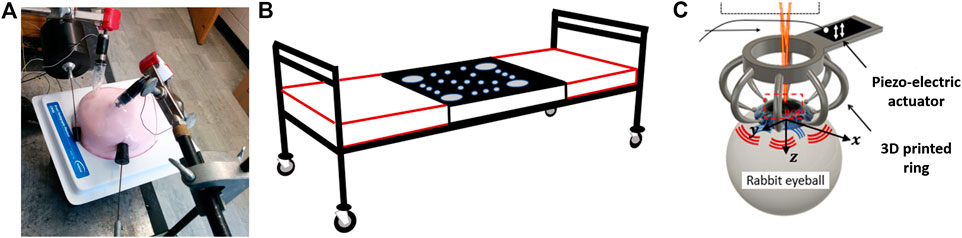
FIGURE 1. (A) Initial schematic setup using four external vibration sources to generate a reverberant field inside the CIRS breast phantom. (B) Custom-made trifold vibration futon bed. The active array of sources is located in the black zone. The red lined outer sections consist of cushions for the head and lower body. ©Institute of Physics and Engineering in Medicine. Reproduced from Ref. 15 by permission of IOP Publishing. All rights reserved. (C) 3D printed ring. The output OCT beam goes through the objective lens toward the sample (porcine cornea). The cornea is excited by a piezoelectric actuator attached to an eight-head ring.
Different vibration frequency ranges were using for the different applications. In US-RSWE, frequencies between 40 and 700 Hz were used for phantoms and in vivo tissue. In Ormachea et al. [15], a simultaneous multi-frequency range was applied in all vibration sources for each experiment to allow a rapid acquisition of shear waves propagating at different frequencies. In OCT-RSWE, Zvietcovich et al. [16] applied a higher vibration frequency, 2,000 Hz, for the phantoms and ex vivo cornea tissue. The selected excitation frequency was a balance to obtain smaller wavelengths with sufficient energy to avoid stronger wave attenuation below the sensitivity floor for motion detection using the PhS-OCT system.
Numerical simulations were conducted to corroborate the theory of RSWE. In Ref. 14, a shell-element analysis and 3D solid finite element analysis in a breast shape tissue model were performed. Ormachea et al. [17] used a Monte Carlo analysis in models, exhibiting phase velocities behavior with different power law coefficients, to validate a 2D shear wave dispersion study on breast and liver tissues using multi-frequency US-RSWE. For OCT-RSWE, Zvietcovich et al. [16] performed a Monte Carlo analysis to validate Eqs. 2 and 3 in a uniform elastic medium (cs = 4°m/s) subjected to an ideal reverberant field. Here, we considered
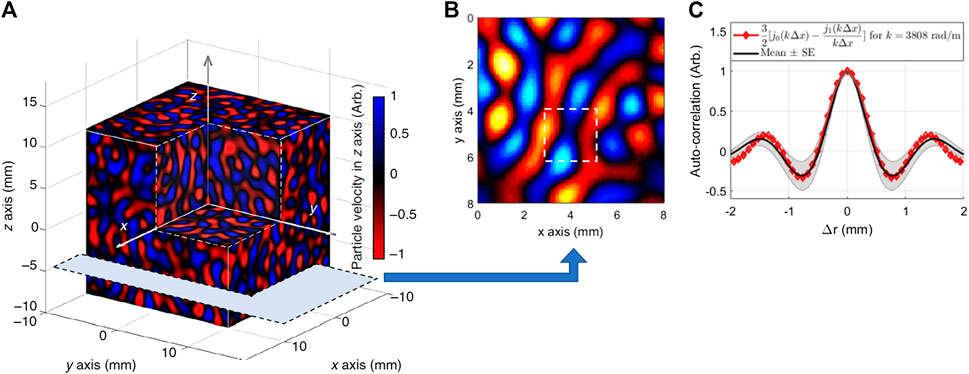
FIGURE 2. (A) Particle velocity field along the z-axis after conducting a Monte Carlo analysis of reverberant shear waves at an arbitrary time
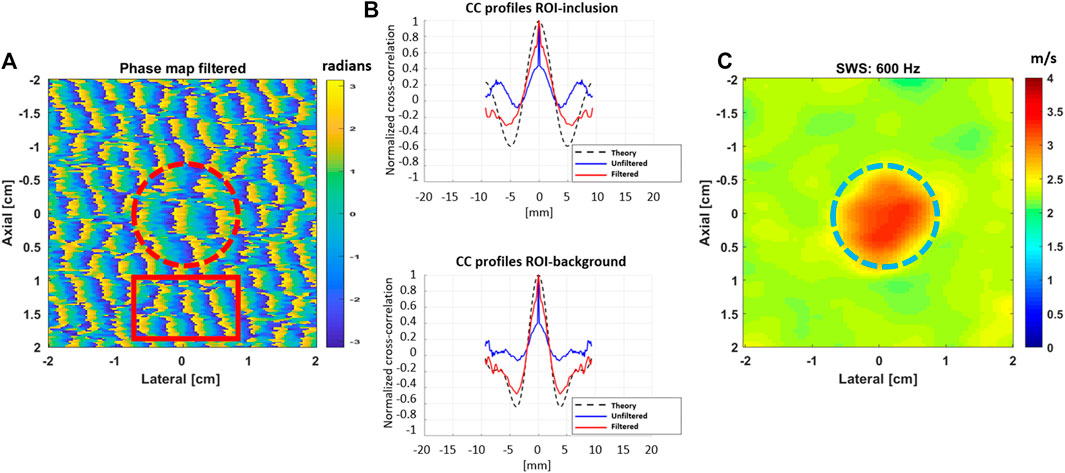
FIGURE 3. (A) Simulated phase map in a 40 × 40 mm2 region of a uniform elastic background with a stiffer inclusion after conducting a Monte Carlo analysis of reverberant shear waves with frequency of f0 = 600 Hz and the addition of significant white noise. The shear wave speeds for the background and the inclusion were 2.5 and 3.5 m/s, respectively. (B) The cross-correlation profiles, in the axial direction, are shown for the dashed circle (top) and rectangle (bottom) red regions shown in (A). The profiles for the unfiltered data show a peak at the center, a clear feature of the presence of noise. (C) Final SWS image obtained after the filtering process.
Two calibrated phantoms were used to evaluate the US-RSWE method. The first was a CIRS breast phantom (Model 059, Computerized Imaging Reference Systems, Norfolk, VA, United States) with background (20 kPa nominal Young’s modulus) and inclusion regions (at least two times stiffer than the background region per the manufacturer’s datasheet). The other phantom was a custom made CIRS (Serial No. 2095.1- 1, Computerized Imaging Reference Systems) homogeneous viscoelastic phantom (6 kPa nominal Young’s modulus). Both phantoms show different viscoelastic properties as shown by the shear wave dispersion analysis evaluated in Ref. 15.
The CIRS breast and viscoelastic phantoms were used to illustrate the ability of US-RSWE to differentiate the stiffer regions from the background material, see Figure 4. The viscoelastic properties of each CIRS phantom were evaluated by measuring the shear wave dispersion as a function of frequency, see Figure 5. The initial experiments in Parker et al. [7] showed elastographic images using individual frequencies of 400 and 450 Hz; then, Ormachea et al. [10] used a broader set of individual frequencies from 60 to 450 Hz for the almost purely elastic breast phantom and 60–120 Hz for the viscoelastic phantom, respectively. The obtained mean SWS results were compared with another elastographic technique (single tracking location-acoustic radiation force) with good agreement at 220 Hz. The results in Ref. 10 also reported the feasibility of applying a multi-frequency vibration range. The application of multi-frequency tones allows a rapid collection of shear wave response to estimate and create 2D SWS and dispersion images at discrete frequencies. The results were similar to the ones obtained using individual frequencies and enabled a follow-up study to create not only 2D SWS images, but also 2D shear wave dispersion (SWD) images, since the method is able to obtain the SWS information at different frequencies and at different locations using the same collected data. The results were reported in Ref. 9, showing a clear difference between the phantoms with respect to their SWD values, and consequently, a better viscoelastic characterization for both materials. In Ref. 22, experiments using gelatin-based phantoms were performed to analyze the conditions to create a reverberant shear wave field. Similarly to the numerical simulations, reported in Ref. 22, the coefficient of determination with respect to the theoretical models improved and the shear wave speed estimation error decreased as more incident waves propagates into the field. Moreover, it was found that at least three vibration sources located at the top of the phantom surface were necessary to measure an average SWS with an error less than 9%.
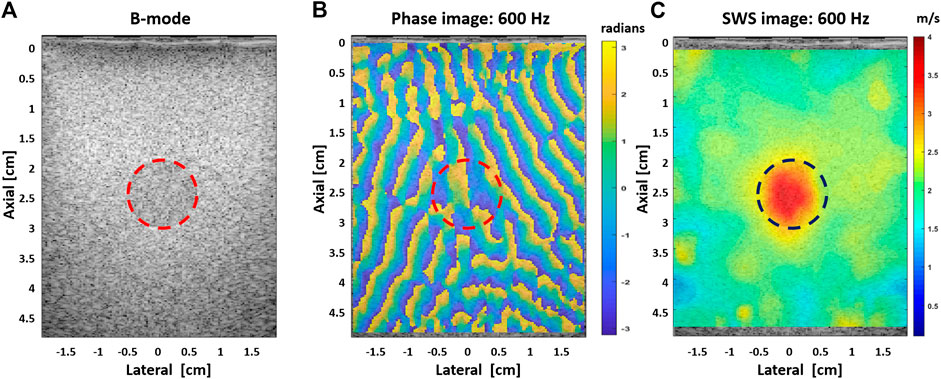
FIGURE 4. (A) B-mode image of the CIRS breast phantom showing a circular inclusion that represents a stiffer lesion. (B) Extracted phase map pattern at 600 Hz; the random pattern indicates the different propagation directions of the shear waves generated with the vibration sources. (C) SWS map using the RSWE estimator at 600 Hz. The red and blue dashed circles in (B,C), respectively, illustrate the location of the inclusion.
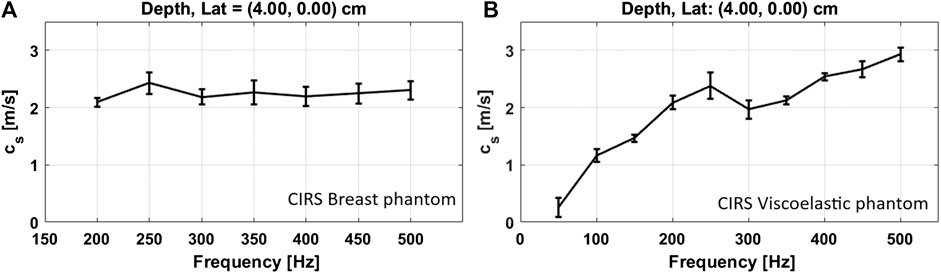
FIGURE 5. Phase velocity dispersion curves. Estimated SWS vs. frequency plots for the CIRS breast (A) and viscoelastic phantoms (B). The center depth and lateral positions of a selected region of interest, to extract the SWS values, are indicated above each plot. As expected, a higher dispersion was obtained for the viscoelastic media. ©Institute of Physics and Engineering in Medicine. Reproduced from Ref. 15 by permission of IOP Publishing. All rights reserved.
For OCT-RSWE, gelatin-based phantoms were created to evaluate the capability of the RSWE approach to detect elasticity gradients along depth. In Ref. 16, a reverberant field of 2 kHz was created in a horizontally-layered phantom by exciting the ring actuator with eight rods, as described in Vibration Sources and Frequency Ranges section. The phantom had a softer layer (thickness ∼0.3 mm, 3% gelatin concentration) located on the top of a second stiffer layer (5% gelatin concentration). Figure 6A shows motion frames extracted at the top 3% layer (depth
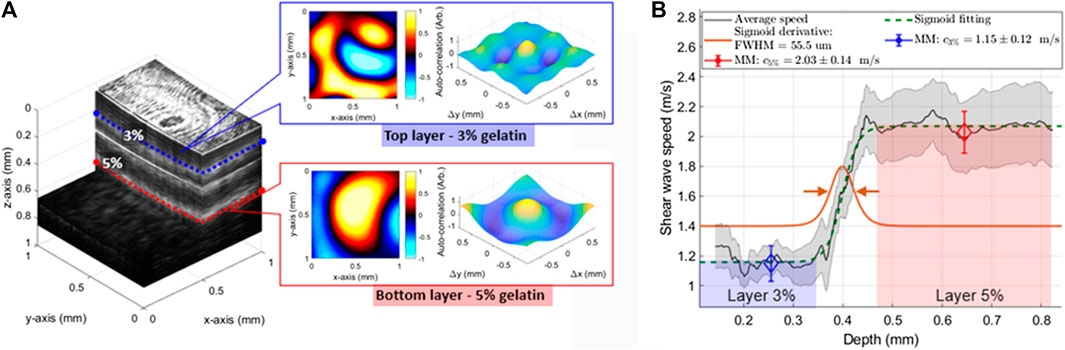
FIGURE 6. (A) Horizontally distributed layered phantom (1 × 1 × 1 mm3) showing a stiffer bottom layer (gelatin concentration of 5%) and softer top layer (gelatin concentration of 3%) obtained using OCT. Motion frames (particle velocity) and 2D autocorrelation plots are calculated within each layer with notable wavelength and main-lobe spreading differentiation, respectively. (B) Average speed transition along depth from the 3–5% concentration layers of the phantom. Mean
In Ref. 15, the authors demonstrated that reverberant shear wave fields can be produced in deep tissues from external sources, applying vibration frequencies up to 400 Hz in obese patients’ livers and over 700 Hz in breast tissue. Moreover, SWD images were obtained by analyzing the linear slope or the power law coefficient. These additional parameters may provide a better image contrast and information about the scanned media. An altered dispersion parameter, compared with normal tissue, would show a different viscoelastic response for lesions or pathologies cases. Figure 7 shows a SWS image at 702 Hz for the dense breast tissue experiment. The elastographic image clearly shows the dense breast region as stiffer tissue than the surrounding area.
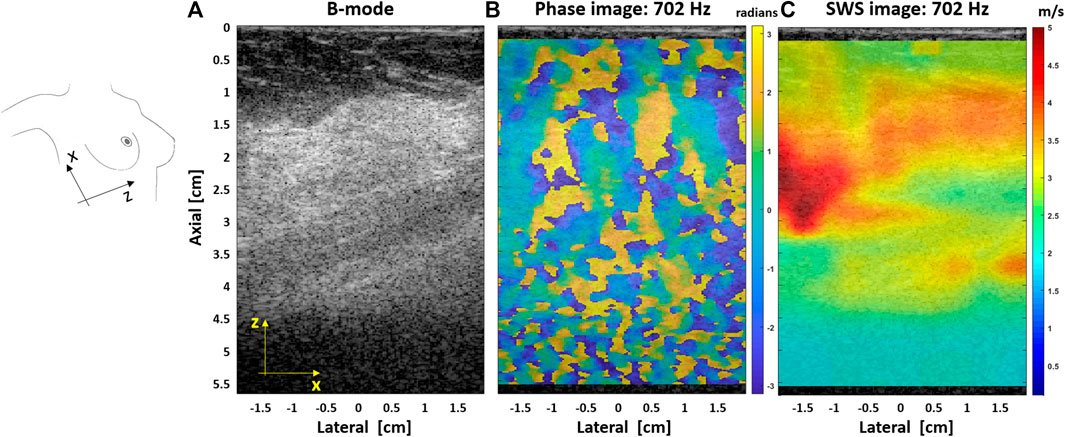
FIGURE 7. (A) B-mode image for a patient with a dense breast tissue. (B) Extracted phase map pattern at 702 Hz; the random pattern indicates the different propagation directions of the shear waves generated with the vibration sources. (C) SWS image, superimposed on its corresponding B-mode image, obtained with the US-RSWE approach at a vibration frequency of 702 Hz.
Figure 8 shows liver SWS images at two different vibration frequencies, 100 and 400 Hz, for an obese patient. The liver is located between 4 and 10 cm depth in this case. Thus, US-RSWE was able to measure liver viscoelasticity, in terms of SWS and SWD, in obese patients at deep regions. For this case, a simple observation shows the stiffness difference of the kidney region and the liver tissue as higher frequencies are used. Although this suggests that US-RSWE may be able to measure the kidney tissue biomechanical properties, further research is needed with more focus in this organ. Table 1 shows a summary of SWS values obtained from a region of interest from 2D images of CIRS phantoms and in vivo liver obtained with US-RSWE [15].
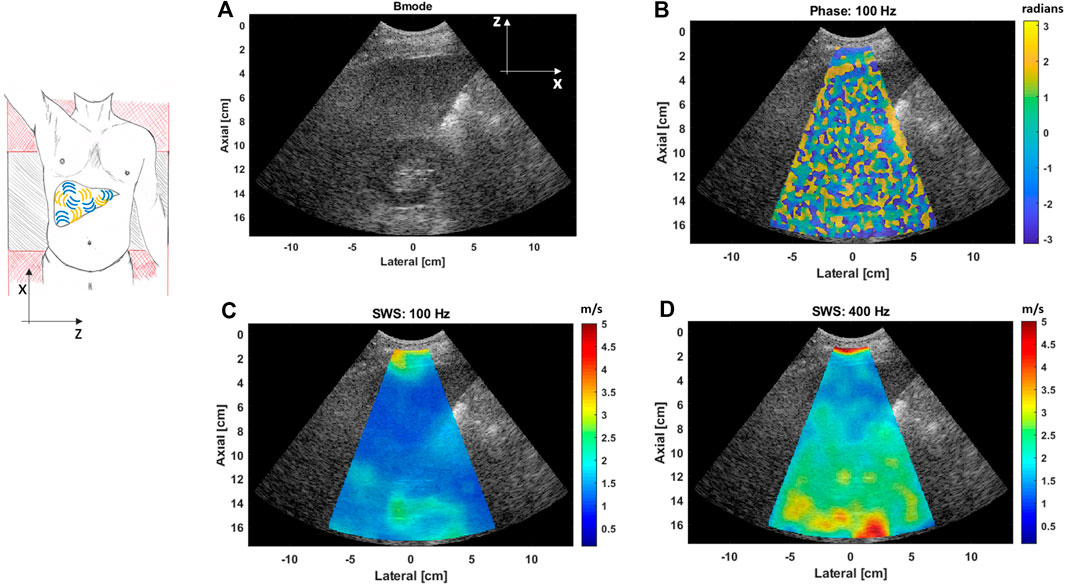
FIGURE 8. (A) B-mode image showing the liver and kidney of an obese patient. (B) Extracted phase map pattern at 100 Hz, the random pattern indicates the different propagation directions of the shear waves generated with the vibration sources. (C,D) SWS images, superimposed on their corresponding B-mode images, obtained with the US-RSWE approach at two different vibration frequencies, 100 Hz (C) and 400 Hz (D). It can be noted that better differentiation between the liver and kidney is obtained as higher frequencies are used.
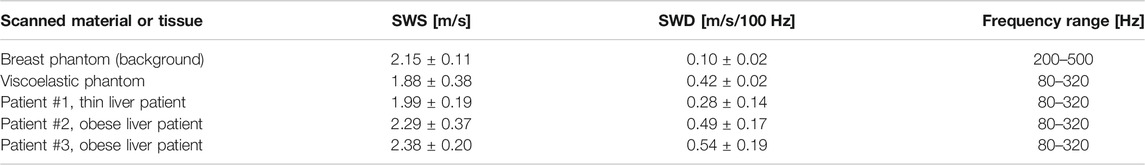
TABLE 1. SWS and SWD estimations in phantoms and in vivo liver obtained with US-RSWE [15].
In Ref. 16, OCT-RSWE was demonstrated to characterize the elasticity of single layers in ex vivo porcine cornea with unprecedented contrast in the dynamic wave-based OCE field. An ex vivo porcine cornea was subjected to a 2 kHz reverberant shear wave field. After the acquisition, a 3D structural volume (Figure 9A-left) and the reverberant complex 3D motion field (Figure 9A-right) were obtained. The curvature of the cornea was taken into account for the compensation of particle velocity along depth. The average depth-dependent shear wave speed plot of the cornea was obtained using Eq. 2 for the estimation of local wavenumber
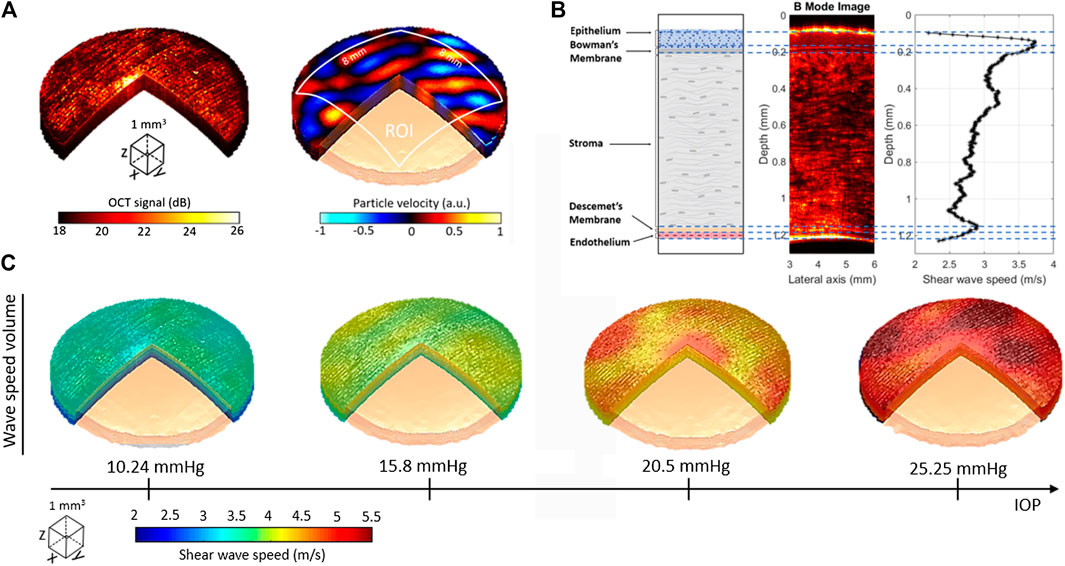
FIGURE 9. Elastography of ex vivo porcine corneas using OCT-RSWE. (A) Structural OCT (left) and motion (particle velocity, right) volumes obtained in the cornea subjected to reverberant field of 2 kHz. (B) Average depth-dependent shear wave speed profile of cornea compared with intensity changes of the B-mode structural information and the anatomical description of corneal layer. 3D shear wave speed volumes (in m/s) of cornea subjected to four different IOP levels: 10.24, 15.80, 20.50, and 25.25 mmHg. Reprinted by permission from Springer Nature from Ref. 16.
Shear wave dispersion was measured in terms of the linear slope and the power law coefficient, in CIRS phantoms, in vivo breast, and in vivo liver tissues over an applied vibration frequency range. First, SWD was obtained over a region of interest of the obtained SWS images in Ref. 13. Later in Ref. 15, it was also possible to create SWD images to add information and contrast of the tissue viscoelastic properties. However, the practical upper limits to shear wave frequencies is still unknown for each specific soft tissue. The obtained results are still preliminary, further clinical studies are needed to obtain consensus about what is the expected SWD in normal and healthy populations, for example. Although the initial results only reflect few cases, it is encouraging that SWD shows better differentiation than SWS values for the obese liver cases with respect to the thin liver patient case, and all of these values are in a similar range with respect to other independent studies that also measured this parameter. For example, the linear dispersion results reported in Ref. 15 agreed with the ones reported in Ref. 23, 0.1 and 0.6 m/s/100 Hz using a frequency range of 0–400 Hz, or the ones reported in Refs. 19 and 24, 0.36 m/s/100 Hz in in vivo healthy human volunteers using frequencies ranges of 40–450 Hz and 60–390 Hz, respectively. Table 1 shows a summary of SWD obtained from a region of interest from 2D images of CIRS phantoms and in vivo liver obtained with US-RSWE [15].
The RSWE approach, based on continuous sinusoidal excitation at specific frequencies, promotes the propagation of a higher quantity of shear waves in tissues vs. other wave propagation methods. This is of particular interest in OCE since surface acoustic waves are typically dominant near boundary conditions during transient excitation (generated by an acoustic radiation force in SWE methods or external short vibration tone bursts), complicating the conversion of wave speed into shear or Young’s moduli. Moreover, this new method establishes a profusion of shear waves propagating in different directions, incorporating shear wave reflections from boundaries and inhomogeneities. This limiting 3D shear wave distribution leads to a mathematical model with a simple local estimator of shear wave speed and stiffness covering a full field of view.
The application of numerical simulation has demonstrated to be an important tool to validate the mathematical framework of the RSWE approach, the different studies have reported simulations including the superposition of multiple random shear waves. These simulations demonstrate the capabilities of RSWE for inclusion and layer detections for two different clinical applications, breast and cornea tissue, respectively. However, the models to represent the media where shear waves propagate are still simple: isotropic, homogeneous, lossless. Further analysis including more realistic geometrics and inhomogeneities, attenuation of shear waves, and dispersion behavior are needed to evaluate the reverberant shear wave approach and its limitations.
As observed, one advantage of using RSWE is that it produces stronger shear waves at deeper tissue regions of interest, and it can provide additional parameters such the evolution of SWS as a function of frequency (dispersion). Our preliminary in vivo liver and breast results indicate that SWD values could add information for better tissue characterization. A disadvantage of RSWE is that the spatial resolution of the final elastograms is limited by the tissue stiffness and the applied frequency. The approach also requires additional hardware in the form of external vibration sources in order to produce shear waves.
The RSWE approach presents some differences with respect to other methods that use external vibration sources. In Refs. [25–31], only one loudspeaker is attached to the clinical bed, RSWE uses multiple vibration sources. Zhao et al. [25, 26] used directional filters and applied a SWS estimator based on time delays between the temporal signals. RSWE does not use directional filters and uses all the generated shear waves in the field. Although Tzschatzsch et al. [29] also applied multi-frequency ranges and measured SWD similar to US-RSWE, the frequency ranges are different. In Ref. 29, a set of frequencies ranging from 30 to 60 Hz was used for the liver application, whereas US-RSWE applied 40 to 400 Hz. Another modality with external sources is passive elastography. There are major differences between RSWE and passive elastography: the former is a narrowband, spatial domain autocorrelation method derived from classical acoustics which uses active sources vibrating at specific frequencies; the latter is a broad-band random signal, temporal correlation via time reversal, derived from geophysics and originally relying on natural shear wave sources.
Our preliminary results, using US-RSWE, show its capability to obtain SWS and SWD images. As reported in Ref. 15, US-RSWE was able to generate images in deep areas (∼16 cm depth) for liver application in obese patients. Thus, this method may be able to overcome one of the main liver clinical limitations: the ability to obtain elastographic images in obese cases [7]. For breast tissue, US-RSWE applied higher vibration frequencies than in the liver. Our preliminary experiments showed the possibility to obtain shear waves propagating through the field using frequencies up to 700 Hz, despite the loss due to attenuation. The higher frequencies also allow us to generate shorter shear wavelengths and a possible improvement in the spatial resolution to detect lesions. However, since the spatial resolution also depends on the tissue stiffness, more experiments are needed to determine ‘low’ and ‘high’ thresholds for vibration frequencies to define which are appropriate for this specific tissue.
The work done in OCT-RSWE shows the advantage of generating elastograms with axial elastography resolution of 55.5 μm [16], which is a promising tool for optimal fine-scale medical imaging. Furthermore, OCT-RSWE is able to detect elasticity changes along the depth axis, which is very important for characterizing corneal layers stiffness. In particular, the properties and boundary conditions of cornea (layer distribution, surfaces, and stiffness heterogeneities) help to produce multiple reflections and aberrations of shear waves. These properties are optimal to estimate the SWS using RSWE, a clear advantage compared to other peak tracking-based methods where these conditions will diminish the effectivity of their SWS estimators. In OCT-RSWE, a multi-frequency range has not yet been applied. However, the system can be modified to send multi-harmonic vibrations at the same time. The simultaneously captured data will give information about the depth dependent SWD and its relationship with the viscoelastic parameters. A procedure similar to US-RSWE can be performed to obtain SWD plots and 2D images. This procedure shows an example that OCT and US, using the reverberant shear wave elastography approach, may be integrated to generate a multi-modal approach where each can add important information from the micro and macro level structure of the tissues.
Since the RSWE approach has been studied the last 4 years and results are preliminary, a number of issues remain to be evaluated. One practical problem may occur when the field fails to approach the diffuse or reverberant ideal or a partial reverberant field is created with dominant waves propagates at specific regions. A more comprehensive determination of the degradation or deviation from the model remains to be quantified including the quantification of the minimum amount of vibrations sources in more realistic tissue models and the attenuation of waves when using high frequencies. Moreover, the assumption of local homogeneity and constant density remains true in RSWE as in most of the reported elastography techniques [3]. The plane wave assumption has a different impact in RSWE since Eq. 1 represents the limiting case in which statistical summation of plane waves traveling at different direction converges to expressions of Eqs. 2 and 3. We believe this statement holds true if the summation is performed using spherical (or cylindrical) waves since these waves contain a variety of propagation directions in a single wavefront that reinforces the statistical summation along the 4
RSWE is an approach that overcomes some major limitations of current elastography: by incorporating reflections and deep penetration of shear waves, by avoiding the need for prior knowledge of wave propagation direction, and by minimizing the effects of surface acoustic waves. We have conducted a series of studies using numerical simulations and tissue-mimicking phantoms to understand the nature, properties, and capabilities of the RSWE approach. This new method has estimated the viscoelastic properties, in terms of SWS and SWD, in phantom materials, ex vivo porcine cornea tissue, and in vivo human tissue. The reverberant field can be produced in deep tissues by external sources, up to 400 Hz in obese patients’ livers, over 700 Hz in breast tissue, and 2 kHz for cornea tissue. We have demonstrated that RSWE could be an excellent method to study different tissues at different scales, including different boundary conditions (composite plate-shaped media such as mouse in situ brain tissue, etc.) and diverse mechanical properties (viscoelastic, and heterogeneous). The results are robust across platforms and can be extended further to magnetic resonance imaging and other imaging systems.
All authors listed have made a substantial, direct, and intellectual contribution to the work and approved it for publication.
This work was supported by the Hajim School of Engineering and Applied Sciences at the University of Rochester.
The authors declare that the research was conducted in the absence of any commercial or financial relationships that could be construed as a potential conflict of interest.
The authors are grateful to Kevin J. Parker and Jannick P. Rolland for the continuing advice, their mentorship, and suggestions and discussions regarding the development of the reverberant shear wave field approach.
1. Fung YC. Biomechanics: mechanical properties of living tissues. New York, NY: Springer-Verlag (1981). 433 p.
2. Sarvazyan AP, Skovoroda AR, Emelianov SY, Fowlkes JB, Pipe JG, Adler RS, et al. Biophysical bases of elasticity imaging. In: JP Jones, editor Acoustical imaging, Vol. 21. New York, NY: Plenum Press (1995). p. 223–40.
3. Parker KJ, Doyley MM, Rubens DJ. Imaging the elastic properties of tissue: the 20 year perspective. Phys Med Biol (2011) 56(1):R1–29. doi:10.1088/0031-9155/56/1/R01
4. Glaser KJ, Manduca A, Ehman RL. Review of MR elastography applications and recent developments. J Magn Reson Imaging (2012) 36(4):757–74. doi:10.1002/jmri.23597
5. Wang S, Larin KV. Optical coherence elastography for tissue characterization: a review. J Biophotonics (2015) 8(4):279–302 doi:10.1002/jbio.201400108
6. Shiina T, Nightingale KR, Palmeri ML, Hall TJ, Bamber JC, Barr RG, et al. WFUMB guidelines and recommendations for clinical use of ultrasound elastography: part 1: basic principles and terminology. Ultrasound Med Biol (2015) 41(5):1126–47. doi:10.1016/j.ultrasmedbio.2015.03.009
7. Ferraioli G, Filice C, Castera L, Choi BI, Sporea I, Wilson SR, et al. WFUMB guidelines and recommendations for clinical use of ultrasound elastography: part 3: liver. Ultrasound Med Biol (2015) 41(5):1161–79. doi:10.1016/j.ultrasmedbio.2015.03.007
8. Lerner RM, Parker KJ. Sonoelasticity images derived from ultrasound signals in mechanically vibrated targets. In: LW Kessler, editor Acoustical imaging. Nijmegen, Netherlands: Seventh European Communities Workshop (1987).
9. Muthupillai R, Lomas DJ, Rossman PJ, Greenleaf JF, Manduca A, Ehman RL. Magnetic-resonance elastography by direct visualization of propagating acoustic strain waves. Science (1995) 269(5232):1854–7. doi:10.1126/science.7569924
10. Schmitt J. OCT elastography: imaging microscopic deformation and strain of tissue. Opt Express (1998) 3(6):199–211. doi:10.1364/oe.3.000199
11. Deffieux T, Gennisson JL, Bercoff J, Tanter M. On the effects of reflected waves in transient shear wave elastography. IEEE Trans Ultrason Ferroelectr Freq Control (2011) 58(10):2032–5. doi:10.1109/TUFFC.2011.2052
12. Rouze NC, Wang MH, Palmeri ML, Nightingale KR. Parameters affecting the resolution and accuracy of 2-D quantitative shear wave images. IEEE Trans Ultrason Ferroelectr Freq Control (2012) 59(8):1729–40. doi:10.1109/TUFFC.2012.2377
13. Ormachea J, Castaneda B, Parker KJ. Shear wave speed estimation using reverberant shear wave fields: implementation and feasibility studies. Ultrasound Med Biol (2018) 44(5):963–77. doi:10.1016/j.ultrasmedbio.2018.01.011
14. Parker KJ, Ormachea J, Zvietcovich F, Castaneda B. Reverberant shear wave fields and estimation of tissue properties. Phys Med Biol (2017) 62(3):1046–61. doi:10.1088/1361-6560/aa5201
15. Ormachea J, Parker KJ, Barr RG. An initial study of complete 2D shear wave dispersion images using a reverberant shear wave field. Phys Med Biol (2019) 64(14):145009. doi:10.1088/1361-6560/ab2778
16. Zvietcovich F, Pongchalee P, Meemon P, Rolland JP, Parker KJ. Reverberant 3D optical coherence elastography maps the elasticity of individual corneal layers. Nat Commun (2019) 10(1):4895. doi:10.1038/s41467-019-12803-4
17. Ormachea J, Barr RG, Parker KJ. 2-D shear wave dispersion images using the reverberant shear wave field approach: application in tissues exhibiting power law response. In: 2019 IEEE international ultrasonics symposium (IUS); 2019 Oct 6–9; Glasgow, United KingdomIEEE.
18. Parker KJ, Maye BA. Partially coherent radiation from reverberant chambers. J Acoust Soc Am (1984) 76(1):309–13. doi:10.1121/1.391063
19. Deffieux T, Montaldo G, Tanter M, Fink M. Shear wave spectroscopy for in vivo quantification of human soft tissues visco-elasticity. IEEE Trans Med Imaging (2009) 28(3):313–22. doi:10.1109/TMI.2008.925077
20. Loupas T, Powers JT, Gill RW. An axial velocity estimator for ultrasound blood flow imaging, based on a full evaluation of the Doppler equation by means of a two-dimensional autocorrelation approach. IEEE Trans Ultrason Ferroelectrics Freq Contr (1995) 42(4):672–88. doi:10.1109/58.393110
21. Pongchalee P, Palawong K, Meemon P. Implementation and characterization of phase-resolved Doppler optical coherence tomography method for flow velocity measurement. In: International conference on experimental mechanics 2013 and twelfth Asian conference on experimental mechanics 2014 Jun, 2; Bangkok, Thailand. Bellingham, Washington USA: International Society for Optics and Photonics, SPIE (2014).
22. Flores G, Ormachea J, Romero S, Zvietcovich F, Parker KJ, Castaneda B. Experimental study to evaluate the generation of reverberant shear wave fields (R-SWF) in homogenous media. In: 2020 IEEE international ultrasonics symposium (IUS). 2020 Sep, 7. Virtual Symposium. New York, NY, US: IEEE (2020).
23. Nightingale KR, Rouze NC, Rosenzweig SJ, Wang MH, Abdelmalek MF, Guy CD, et al. Derivation and analysis of viscoelastic properties in human liver: impact of frequency on fibrosis and steatosis staging. IEEE Trans Ultrason Ferroelectr Freq Control (2015) 62(1):165–75. doi:10.1109/TUFFC.2014.006653
24. Muller M, Gennisson JL, Deffieux T, Tanter M, Fink M. Quantitative viscoelasticity mapping of human liver using supersonic shear imaging: preliminary in vivo feasibility study. Ultrasound Med Biol (2009) 35(2):219–29. doi:10.1016/j.ultrasmedbio.2008.08.018
25. Zhao H, Song P, Meixner DD, Kinnick RR, Callstrom MR, Sanchez W, et al. External vibration multi-directional ultrasound shearwave elastography (EVMUSE): application in liver fibrosis staging. IEEE Trans Med Imaging (2014) 33(11):2140–8. doi:10.1109/TMI.2014.2332542
26. Zhao H, Song P, Meixner DD, Kinnick RR, Callstrom MR, Sanchez W, et al. Liver elasticity imaging using external vibration multi-directional ultrasound shearwave elastography (EVMUSE). In: 2014 IEEE international ultrasonics symposium. 2014 Sep, 3. Chicago, IL, USA. New York, NY, US: IEEE (2014).
27. Tzschatzsch H, Elgeti T, Rettig K, Kargel C, Klaua R, Schultz M, et al. In Vivo time harmonic elastography of the human heart. Ultrasound Med Biol (2012) 38(2):214–22. doi:10.1109/TUFFC.2016.2543026
28. Tzschatzsch H, Hattasch R, Knebel F, Klaua R, Schultz M, Jenderka KV, et al. Isovolumetric elasticity alteration in the human heart detected by in vivo time-harmonic elastography. Ultrasound Med Biol 2013;39(12):2272–8. doi:10.1016/j.ultrasmedbio.2013.07.003
29. Tzschatzsch H, Ipek-Ugay S, Trong MN, Guo J, Eggers J, Gentz E, et al. Multifrequency time-harmonic elastography for the measurement of liver viscoelasticity in large tissue windows. Ultrasound Med Biol (2015) 41(3):724–33. doi:10.1016/j.ultrasmedbio.2014.11.009
30. Hudert CA, Tzschatzsch H, Guo J, Rudolph B, Blaker H, Loddenkemper C, et al. US time-harmonic elastography: detection of liver fibrosis in adolescents with extreme obesity with nonalcoholic fatty liver disease. Radiology (2018) 288(1):99–106. doi:10.1148/radiol.2018172928
Keywords: reverberant fields, elastography, shear waves, OCE, ultrasound, tissue viscoelasticity, tissue stiffness
Citation: Ormachea J and Zvietcovich F (2021) Reverberant Shear Wave Elastography: A Multi-Modal and Multi-Scale Approach to Measure the Viscoelasticity Properties of Soft Tissues. Front. Phys. 8:606793. doi: 10.3389/fphy.2020.606793
Received: 15 September 2020; Accepted: 30 November 2020;
Published: 14 January 2021.
Edited by:
Jing Guo, Charité–Universitätsmedizin Berlin, GermanyReviewed by:
Simon Auguste Lambert, Université Claude Bernard Lyon 1, FranceCopyright © 2021 Ormachea and Zvietcovich. This is an open-access article distributed under the terms of the Creative Commons Attribution License (CC BY). The use, distribution or reproduction in other forums is permitted, provided the original author(s) and the copyright owner(s) are credited and that the original publication in this journal is cited, in accordance with accepted academic practice. No use, distribution or reproduction is permitted which does not comply with these terms.
*Correspondence: Juvenal Ormachea, am9ybWFjaGVAdXIucm9jaGVzdGVyLmVkdQ==
Disclaimer: All claims expressed in this article are solely those of the authors and do not necessarily represent those of their affiliated organizations, or those of the publisher, the editors and the reviewers. Any product that may be evaluated in this article or claim that may be made by its manufacturer is not guaranteed or endorsed by the publisher.
Research integrity at Frontiers
Learn more about the work of our research integrity team to safeguard the quality of each article we publish.