 Ye Wu1
 Lin Zhang
 Xin Feng
94% of researchers rate our articles as excellent or good
Learn more about the work of our research integrity team to safeguard the quality of each article we publish.
Find out more
ORIGINAL RESEARCH article
Front. Phys. , 08 January 2021
Sec. Social Physics
Volume 8 - 2020 | https://doi.org/10.3389/fphy.2020.603001
This article is part of the Research Topic Mathematical modelling of the pandemic of 2019 novel coronavirus (COVID-19): Patterns, Dynamics, Prediction, and Control View all 34 articles
The global spread of the COVID-19 pandemic is changing everything in 2020. It is of crucial importance to characterize the growth patterns during the transmission. In this paper, a generalized-growth model is established to present the evolution of the number of the total confirmed cases changing with time. Due to effective containment, the generalized growth model reveals a piecewise pattern, referred to as the sub-exponential and the sub-linear stages. Moreover, the parameters can quantify the effectiveness of the containment and the trend of resurgence in different regions all over the world. Our model provides a phenomenological approach, which is simple and transparent for better understanding of the typical patterns within the general dynamics. Our model may have implications for possible nowcasting and forecasting of the pandemic trend.
The global spread of the COVID-19 pandemic is changing everything in 2020. The first outbreak was in Wuhan during the Chinese New Year’s Holiday in late January, and the further outbreaks of COVID-19 in Europe and the US began in March. High infectiousness and worldwide mobility make it more and more difficult to prevent the pandemic. As of October 2020, there are in total more than 40 million confirmed cases all over the world with more than 1 million deaths. The pandemic has already influenced every part of daily life, not only in the way we work, learn, and communicate but also in terms of the economic and political status of different countries and regions all over the world [1, 2]. As a starting point for better understanding and effectively preventing the further spread of COVID-19, exploring the patterns during the propagation of COVID-19 is of crucial importance. Furthermore, the effectiveness of containment measures needs a rapid and transparent response.
Several research directions related to COVID-19 have been developed since the breakout of the deadly virus. The first one is clinical analysis, focusing on the coronavirus itself [3, 4] via, for example, the estimation of the basic reproduction number R0 [5], the effective reproduction number Rt [6], the infectiveness of the virus [1, 7], and the serial interval [8]. The second one is modeling the spreading processes by assuming some mechanisms. Different generalized SIR models are commonly used. An SIR-X model is illustrated to explain that effective containment is the reason for the subexponential growth during the early spread of COVID-19 in China [9].
The clinical analysis is helpful in understanding the virus itself, and the agent-based models are useful in understanding different factors during the spreading procedure [10, 11]. However, the trend and patterns during the epidemics is still unclear. Moreover, agent-based models are sensitive to assumptions. As time goes by, heterogeneity caused by containment measures and resurgence of the virus would make the model inconsistent and unreliable. A simple, fast, transparent, and robust model for macroscopic analysis would therefore be more informative from a specific point of view. A generalized logistic growth model is utilized for exploring the patterns [12]. However, this unimodal growth function can only describe one wave of the pandemic with total number of infected cases estimated ahead from the model. It does not work for the second wave of COVID-19.
In this paper, a generalized growth model is used to fit the number of cumulative confirmed cases in different countries and regions to reveal the typical patterns and rate of spread of COVID-19. The heterogeneity is well described by a piecewise fitting procedure with the same growth model. As a result, the sub-exponential and sub-linear stages of the past 9 months are revealed from the real time series of different stages during the worldwide fights against COVID-19. Our findings provide a general methodology to quantify the rate of spread, the effectiveness of containment measures, and the speed of resurgence, which may be useful for further prevention decision making and effectiveness evaluation.
Theoretically, the growth of the virus spread is exponential due to the sufficiency of resources. The growth therefore follows an ordinary differential equation:
with solution y(t) = y (0) ert, where y (0) is the number of infected individuals at the beginning of dynamics, and r is the growth rate. However, outbreaks of many infective diseases show that, compared with exponential growth, sub-exponential growth is more common, such as with the growth rates of HIV/AIDS [13], Ebola [14], and foot-and-mouth disease [14]. What is more, there are several explanations for the sub-exponential growth: spatial heterogeneity, clustering of contacts [14, 15], and the heterogeneity in behavioral changes [13]. In the SIR model, the heterogeneity in time [14–16], space [13], and in combination [17] can lead to sub-exponential growth. For COVID-19, the underlying mechanisms governing sub exponential growth can be difficult to disentangle and, thus, to model.
In terms of non-pharmaceutical intervention, the growth will not be exponential and is referred to as the effectiveness of the mitigation. Moreover, the degree of sub-exponential growth (or even much slower growth) can be referred to as the effectiveness of different control measures. A phenomenological model is therefore more flexible through the introduction of a tuning parameter p that considers the sub-exponential or even much slower growth. The general-growth model is given as follows:
where
When 0 < p < 1, the model is applied to explain the sub-exponential growth at the early stage of epidemics [15]. Cases with p > 1 or p < 0 can also appear at certain stages during the process of spreading, showing the evolution of the rate of spread during the long-term pandemic of COVID-19.
In this work, regions and countries with different scales of confirmed case numbers and different containment measures were selected. Then their time series of total confirmed cases were fitted to Eq. 1, the solution of the phenomenological model, which can reproduce a variety of growth profiles. The growth can be divided into different stages of the evolution, reflecting the effectiveness of different mitigation measures. Moreover, the fitted parameters, especially the deceleration of growth parameter p, can be treated as the quantification of the spreading trends, which is comparable among different countries and regions. Generally speaking, smaller p means a slower rate of spread in different types of stages. In fact, when p = 1, it is the exponential growth model. The other special case is p = 0, which refers to linear growth with y(t) = y (0) + rt. When 0 < p < 1, y(t) grows sub-exponentially, or equivalently, polynominally. The smaller distance between
To differentiate different stages from each other during the pandemic spread, Eq. 1 is fitted to the real data from the very beginning of the confirmed cases in a certain region. With different containment measures, the growth patterns will be changed, and the fitting curve will deviate further from the real data if the fitting curve continues. In this situation, as soon as the fitting curve deviates from the real time series, the former fitting is stopped and a new one is restarted from the same spot. Consequently, piecewise fitting to the real time series with one general form of equation but different parameters is provided. A quantification of the rate of spread at different stages in different regions and countries is obtained. Based on the quantitative results, the evaluation of the effectiveness of mitigation measures in different countries can be obtained. Moreover, the resurgence can also be detected by the flexible and robust methodology. The provided results may shed light on nowcasting and forecasting of the spreading trend and decision making for further prevention of COVID-19.
In this paper, we use the number of cumulative confirmed cases of a certain country or region over time. The general growth model is applied to countries or regions with different scales of confirmed cases. Two levels of regions are selected, one is the provincial level (in China) and the other the national level (worldwide). The results reflect the stability and reliability of our phynomenological growth model. Moreover, the fitting parameters in different areas are informative, providing the rate of spread, which reflects the effectiveness of containment measures, as well as the trend of resurgence.
The piecewise fitting results are illustrated in figures. The parameters fitted to certain regions in different stages are listed in Table 1. For the goodness of fit in each stage, the mean absolute value of relative errors (MARE) is calculated, which is also listed in the table. The MARE is defined as
where
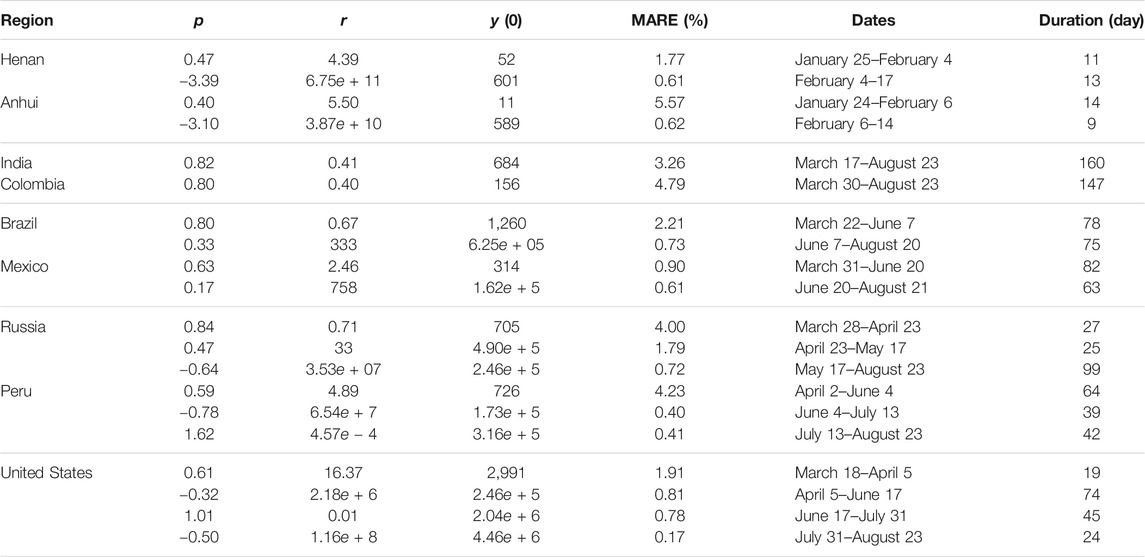
TABLE 1. The fitting parameters for different stages of different regions and countries. The MARE, dates, and duration are also listed for each case.
Due to the preventative measures, the growth trend changes as time goes by. The generalized growth model is fitted by adjusting the fitness to the real data. At the early stage, sub-exponential growth was found by several related works [12], where the generalized growth model can fit the data well. With effective containment, the growth speed will slow down, resulting in a misfitting between the real data and the fitting curve. As long as the fitting curve does not match the real data, the current fitting will be stopped, and a new one will be restarted right after the stopping spot. As a consequence, the changes from one stage to another by our fitting methodology reflect the changes of the intrinsic spreading trend of COVID-19 in certain regions. We can quantify not only the effectiveness of prevention through the generalized growth model but also the resurgence of COVID-19.
Within the fitting procedure, the key parameter is p, which presents the rate of spread at different stages in different regions, regardless the scale of confirmed case numbers. The provincial results in China can be referred to as one of the typical patterns of spread with effective prevention. However, when faced with a severe pandemic, other patterns are also revealed by use of our simple fitting model. In the following, besides the provincial results in China, the national-level results are classified according to different numbers of fitting stages, representing different types of spreading trends. For the second wave of COVID-19, our simple, flexible, and robust methodology will be helpful in quantifying the trend of spread in future stages.
Provincial level in China Two Chinese provinces, Henan and Anhui, are selected to reveal the typical growth of confirmed cases with effective prevention. As shown in Table 1, under strict local containment, the number of confirmed cases increases sub-exponentially at an early stage, and the parameter p is no more than 0.5. Within 2 weeks, the growth rate changes into a sub-linear one, and p is less than −3. The fitting curves are illustrated in Figure 1. The fitting procedure stopped at the ending stage since the increment is getting smaller. Figure 1 shows a typical curve for a complete process of total confirmed cases. In order to get the COVID-19 pandemic under control, it is necessary that the total confirmed cases going into the sub-linear growth stage, that is, the p parameter, is negative. The ideal case for the spreading trend is changing from a sub-exponential growth into sub-linear one. At the same time, the awareness of resurgence is more important due to the high and asymptomatic infectiveness of COVID-19.
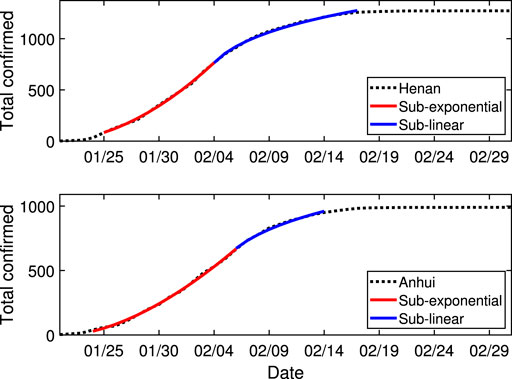
FIGURE 1. The fitting results of Henan and Anhui provinces in China. The black dashed curves represent the real data. The red and blue segments represent the sub-exponential and sub-linear growth of the total confirmed cases over time. The parameters and dates in considerations for different cases are listed in Table 1.
National level with one growth stage During the fitting procedure, division into different segments is necessary to consider containment measures or resurgence. However, when the containment measures are not effective enough, one stage fitting merges. Figure 2 shows the fitting results of two typical countries: India and Colombia. The ending date is August 23, 2020, in this paper. The growth rates of these two countries are sub-exponential, with speed parameter p as 0.82 and 0.80, respectively. A larger p means closer to exponential growth, which is indicative of the rapid growth of the pandemic in these countries. The same pattern of growth lasts more than 5 months, resulting in large numbers of confirmed cases, with a scale of millions and hundreds of thousands.
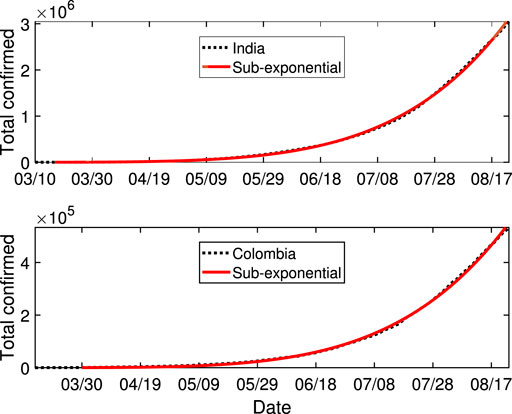
FIGURE 2. The fitting results of India and Colombia. The black dashed curves represent the real data. The red curves represent the sub-exponential growth of the total confirmed cases changing with time. The parameters and dates in consideration for different cases are listed in Table 1.
Our quantitative results can tell the severity of the pandemic in these countries. The same sub-exponential growth pattern with a growth parameter p of around 0.8 had lasted more than 5 months in India and Colombia: until the end of August 2020. No effective containment is reflected by our method.
National level with two growth stages Besides the severe situation with only one growth stage, some countries are showing favorable trend, resulting in two growth stages until the end of our observation date of August 23, 2020. Typical countries with two-stage fitting are illustrated: Brazil and Mexico see Figure 3. As shown in Table 1, the key parameter p gets smaller in the second sub-exponential stage. For Brazil, p changes to 0.31 from 0.82 after 78 days of growth in the first sub-exponential stage. For Mexico, p changes to 0.18 from 0.67 after 82 days of growth in the first stage.
FIGURE 3. The fitting results of Brazil and Mexico. The black dashed curves represent the real data. The red and yellow curves represent the two different sub-exponential growth segments of the total confirmed cases over time. The parameters and dates in consideration for different cases are listed in Table 1.
Different from the two-stage growing pattern in provinces in China, the two stages are all sub-exponential. In the sub-exponential stage, the rate of spread is always increasing. The positive side is that the speed is slowing down, reflecting the effectiveness of the prevention measures to some extent.
National level with more than two growth stages The change from one stage to another may not always result in improved situations. More growth stages reflect the complex growing trend during the spreading of COVID-19 in certain regions.
One typical country with three stages is Russia. The fitting result is shown in Figure 4. It is a common rule that the growth is sub-exponential at the early stages, and this was the same in all our fittings. The second stage of Russia is still sub-exponential with smaller p from 0.84 in the first stage to 0.47 as with the cases of Brazil and Mexico. Its third stage changes into sub-linear growth with p = −0.64 and lasts 99 days until August 23, 2020. A slower rate than linear growth is necessary to control the spread. The three stages improve, reflecting the success of containment up to the ending date considered in this paper.
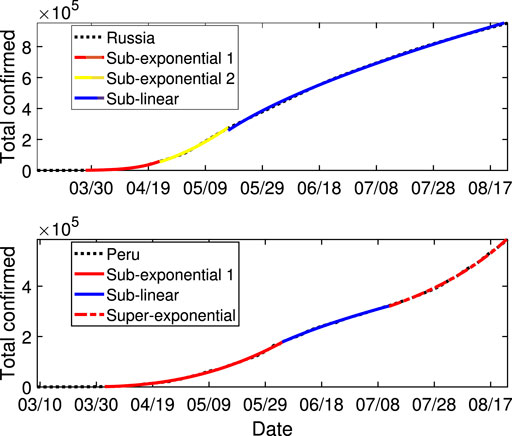
FIGURE 4. The fitting results of Russia and Peru. The black dashed curves represent the real data. The red and yellow curves represent two different sub-exponential growth of the total confirmed cases over time. The blue curve represents the sub-linear growth. The red dashed curve represents the super-exponential growth in the third stage of Peru. The parameters and dates in consideration for different cases are listed in Table 1.
In contrast to Russia, the three stages of Peru show another growth pattern. The fitting result is also shown in Figure 4. Different from the situation in Russia, the second stage of Peru is already sublinear with p = −0.78. However, 39 days later, a severe outbreak emerged, resulting in super-exponential growth with p = 1.62 > 1, reflecting the rapid resurgence of the pandemic in Peru.
The differences between growth trends in Russia and Peru exemplify the difficulty of defending against the pandemic of COVID-19. There is difficulty not only in preventing the outbreak but also in maintaining the temporary victory and preventing the resurgence.
The last case comes from the United States, for which the piecewise fitting splits into four stages see Figure 5. The first three stages possess similar patterns to Peru, which are sub-exponential growth with p = 0.61, sub-linear growth with p = −0.32, and exponential growth with p = 1.01. The last stage goes back again into the sub-linear stage with p = −0.50 and until our considered ending date August 23, 2020. From the complicated changes in the case of the United States, we can see that it is very difficult to mitigate the pandemic of COVID-19, and, worst of all, resurgence and further waves of outbreak may last for a significant period of time.
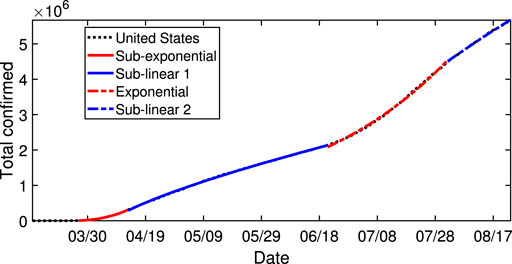
FIGURE 5. The fitting results of United States of America. The black dashed curves represent the real data. The red curve and red dashed curve represent the sub-exponential and exponential growth of the total confirmed cases changing with time. The blue curve and blue dashed curve represent the sub-linear growth with time. The parameters and dates in consideration for different cases are listed in Table 1.
To sum up, the growth patterns of pandemic of COVID-19 are split into two main rules: sub-exponential and sub-linear. Among all the fitting results above, the MARE is quite small, see Table 1, which provides the validation of the general fitting function.
The change from one stage to another is indicative of the trends of the rate of spread. Strict containment results in smaller p, and the pandemic will be under control within a shorter period. It is a common pattern that the first stage is sub-exponential, with p around 0.8, there is no containment, or the prevention is ineffective. Only extreme containment measures can control the pandemic of COVID-19 within a short space of time (say, two months or so). Effective containment can push the trend into sub-linear growth directly, as are the cases of the second stage in Peru and United States. Less effective prevention measures may get sub-exponential growth with a smaller p, as is the case for the second stage in Brazil, Mexico, and Russia. Ineffective measures make no change to the fitting curve, resulting in one stage lasting more than 5 months, as are the cases of India and Colombia. It is notable that, before the pandemic is under real control, the resurgence of the pandemic will be more severe than the early stage, as is the case with the third stage in Peru and the United States; the speed parameters p are 1.62 and 1.01, respectively, which means the super-exponential growth and exponential one for the trend of the resurgence. The result would be disastrous.
Starting with the observation of common sub-exponential growth in epidemic spreading of COVID-19, a phenomenological general-growth model is established to quantify the spreading speed of COVID-19 in different areas. The piecewise fitting methodology can be adapted to different trends during the pandemic, and it is simple, transparent, and robust. Our fitting results provide a reference for the rate of spread in certain countries and regions. The key parameter p not only gives the reference for speed in each stage but also a comparative reference among stages and regions.
Comprehensive fitting reveals typical patterns during the spread of COVID-19. The early stage is sub-exponential growth. Effectiveness of containment measures can be reflected by later stages. Sub-linear growth is necessary for the spreading under control. However, after a long period sub-linear growth, the resurgence may take over, and growth may thus be faster than ever.
There are various classical dynamic propagation models with considerations of heterogeneity that are used to explain the mechanism of growth patterns. Our work provides a generalized result with one consistent fitting function but different speed parameters. Our findings are informative for the general growth of the pandemic in different regions, especially the areas with severe waves during the pandemic. Compared with the fitting results of two provinces in China under strict containment, there is still a long way to go for the countries and regions currently severely affected by the pandemic. It is shown in the cases of the transmission from Stage 2 to Stage 3 in Peru and the United States that even if the spread is under control with a sub-linear growth speed, close attention and strict containment are still necessary to prevent later outbreaks due to the highly infectious nature of the virus and its ability to exist asymptomatically.
Publicly available datasets were analyzed in this study. This data can be found here: https://github.com/owid/covid-19-data/blob/master/public/data/owid-covid-data.xlsx.
YW, LZ, and XF designed the analysis. LZ, WC, and XL analyzed the data. YW and LZ wrote the paper.
This work was jointly supported by the Fundamental Research Funds for the Central Universities (No. 2019XD-A11), the National Natural Science Foundation of China (Grant Nos. 11971074, 61671005, 61672108, 61976025).
The authors declare that the research was conducted in the absence of any commercial or financial relationships that could be construed as a potential conflict of interest.
1. Wang C, Horby PW, Hayden FG, Gao GF. A novel coronavirus outbreak of global health concern. Lancet (2020) 395:470–3. doi:10.1016/S0140-6736(20)30185-9
2. Wang P, Zheng X, Li J, Zhu B. Prediction of epidemic trends in covid-19 with logistic model and machine learning technics. Chaos, Solit Fractals (2020) 139:110058. doi:10.1016/j.chaos.2020.110058
3. Chen N, Zhou M, Dong X, Qu J, Gong F, Han Y, et al. Epidemiological and clinical characteristics of 99 cases of 2019 novel coronavirus pneumonia in Wuhan, China: a descriptive study. Lancet (2020) 395:507–13. doi:10.1016/S0140-6736(20)30211-7
4. Guan WJ, Ni ZY, Hu Y, Liang WH, Ou CQ, He JX, et al. Clinical characteristics of coronavirus disease 2019 in China. N Engl J Med (2020) 382:1708–20. doi:10.1056/NEJMoa2002032
5. Zhou T, Liu Q, Yang Z, Liao J, Yang K, Bai W, et al. Preliminary prediction of the basic reproduction number of the wuhan novel coronavirus 2019-ncov. J Evid Base Med (2020) 13:3–7. doi:10.1111/jebm.12376
6. Zhao S, Lin Q, Ran J, Musa SS, Yang G, Wang W, et al. Preliminary estimation of the basic reproduction number of novel coronavirus (2019-ncov) in China, from 2019 to 2020: a data-driven analysis in the early phase of the outbreak. Int J Infect Dis (2020) 92:214–7. doi:10.1016/j.ijid.2020.01.050
7. Chan JFW, Yuan S, Kok KH, To KK-W, Chu H, Yang J, et al. A familial cluster of pneumonia associated with the 2019 novel coronavirus inducating person-to-person transmission: a study of a family cluster. Lancet (2020) 395:514–23. doi:10.1016/S0140-6736(20)30154-9
8. Du Z, Xu X, Wu Y, Wang L, Cowling BJ, Meyers LA. Serial interval of covid-19 among publicly reported confirmed cases. Emerg Infect Dis (2020) 26:1341–3. doi:10.3201/eid2606.200357
9. Maier BF, Brockmann D. Effective containment explains subexponential growth in recent confirmed COVID-19 cases in China. Science (2020) 368:742–6. doi:10.1126/science.abb4557
10. Wang Z, Xia C, Chen Z, Chen G. Epidemic propagation with positive and negative preventive information in multiplex networks. IEEE Trans Cybern (2020) 99:1–9. doi:10.1109/TCYB.2019.2960605
11. Shao Q, Xia C, Wang L, Li H. A new propagation model coupling the offline and online social networks. Nonlinear Dynam (2019) 98:2171–83. doi:10.1007/s11071-019-05315-9
12. Wu K, Darcet D, Wang Q, Sornette D. Generalized logistic growth modeling of the covid-19 outbreak: comparing the dynamics in the 29 provinces in China and in the rest of the world. Nonlinear Dynam (2020) 101:1561–81. doi:10.1007/s11071-020-05862-6
13. Szendroi B, Csányi G. Polynomial epidemics and clustering in contact networks. Proc Biol Sci (2004) 271(Suppl 5):S364–6. doi:10.1098/rsbl.2004.0188
14. Chowell G, Viboud C, Hyman JM, Simonsen L. The western africa ebola virus disease epidemic exhibits both global exponential and local polynomial growth rates. PLoS Curr (2015) 7:1–10. doi:10.1371/currents.outbreaks.8b55f4bad99ac5c5db3663e916803261
15. Viboud C, Simonsen L, Chowell G. A generalized-growth model to characterize the early ascending phase of infectious disease outbreaks. Epidemics (2016) 15:27–37. doi:10.1016/j.epidem.2016.01.002
16. Chowell G, Hengartner NW, Castillo-Chavez C, Fenimore PW, Hyman JM. The basic reproductive number of ebola and the effects of public health measures: the cases of Congo and Uganda. J Theor Biol (2004) 229:119–26. doi:10.1016/j.jtbi.2004.03.006
Keywords: nonlinear dynamics, complex system, COVID-19, phenomenological model, sub-exponential growth, sub-linear growth, ordinary differential equation
Citation: Wu Y, Zhang L, Cao W, Liu X and Feng X (2021) The Generalized-Growth Modeling of COVID-19. Front. Phys. 8:603001. doi: 10.3389/fphy.2020.603001
Received: 04 September 2020; Accepted: 09 November 2020;
Published: 08 January 2021.
Edited by:
Aristides Moustakas, University of Crete, GreeceReviewed by:
Chengyi Xia, Tianjin University of Technology, ChinaCopyright © 2021 Wu, Zhang, Cao, Liu and Feng. This is an open-access article distributed under the terms of the Creative Commons Attribution License (CC BY). The use, distribution or reproduction in other forums is permitted, provided the original author(s) and the copyright owner(s) are credited and that the original publication in this journal is cited, in accordance with accepted academic practice. No use, distribution or reproduction is permitted which does not comply with these terms.
*Correspondence: Lin Zhang, emhhbmdsaW4yMDExQGJ1cHQuZWR1LmNu
Disclaimer: All claims expressed in this article are solely those of the authors and do not necessarily represent those of their affiliated organizations, or those of the publisher, the editors and the reviewers. Any product that may be evaluated in this article or claim that may be made by its manufacturer is not guaranteed or endorsed by the publisher.
Research integrity at Frontiers
Learn more about the work of our research integrity team to safeguard the quality of each article we publish.