- 1School of Statistics and Mathematics, Yunnan University of Finance and Economics, Kunming, China
- 2School of Aerospace Engineering,Beijing Institute of Astronautical System Engineering, Beijing, China
- 3School of Finance, Yunnan University of Finance and Economics, Kunming, China
- 4Institute of Guangdong Hong Kong and Macao Development Studies, Sun Yat-sen University, Guangzhou, China
- 5Chinese Academy of Finance and Development,Central University of Finance and Economics, Beijing, China
Since the coronavirus disease (COVID-19) pandemic started at the beginning of 2020, it has seriously affected various countries’ economic and social development and accelerated the economic recession worldwide. Therefore, the connectedness of the global COVID-19 network across countries is studied in this article. Based on COVID-19 correlations in 122 countries, we construct a complex network of COVID-19 from January 19, 2020, to August 15, 2020. We then deconstruct the overall global network connectedness and analyze the connectedness characteristics. Moreover, we empirically investigate the network connectedness influencing factors by using various countries’ macroeconomic and social data. We find that the global COVID-19 pandemic network has some prominent complex network properties, such as low path length, high clustering, and good community structure. Furthermore, population density, economic size, trade, government spending, and quality of medical treatment are significant macrofactors affecting COVID-19 connectedness in different countries.
Introduction
The COVID-19 global pandemic has changed the world remarkably. In just a few months, from limited local transmission in several countries, COVID-19 evolved into a multicountry spread and raged in more than 100 countries and regions across five continents. The COVID-19 pandemic has disrupted and changed the lifestyle of millions of people around the world and has had a profound impact on international relations and the economy. At present, increasing attention is being paid to the prevention and control of the COVID-19 pandemic. The pandemic is well under control in some countries, such as China and Germany, but most countries, including the United States, still do not have effective ways to control COVID-19. The fight against the COVID-19 pandemic has become a top priority for governments in many countries and regions, and the public health sector has paid unprecedented attention to protecting people’s lives.
The rapid spread of the COVID-19 pandemic is more than just a medical problem. It is also linked to an infection network among countries worldwide. The complex network science of infectious diseases can reveal necessary information about disease transmission behavior, as many studies have shown. First, the research has revealed the typical characteristics of disease transmission behavior, such as the critical transmission threshold. The virus can spread in the network only when the transmission probability is more significant than a specific value called the propagation threshold of the network (Moore and Newman [1]). Moreover, nonrandom networks, such as small-world and community structure networks, are critical to disease transmission. Many real networks have small-world characteristics in that they tend to have small average distances and large clustering coefficients. In such a network, diseases more easily infect others. In addition, scholars [2] have found that a complex network with a community structure can promote or effectively inhibit the spread of diseases.
Furthermore, the key nodes in a network have a profound impact on disease transmission. Outbreaks of infectious diseases often spread rapidly from a small number of nodes to the entire network. Scientists propose indicators such as page rank, node degree, and k-shell to evaluate the network science characteristic [3]. In disease research, the information of these key nodes can reveal the path of disease transmission. Finally, network science information can be formulated to control the spread of diseases and reduce harmful transmission processes. In recent research, Wang et al. [4] use a two-layer network model method to find that people who received positive prevention information had a lower risk of disease infection than those who received negative prevention information.
Therefore, this study establishes a complex network of COVID-19 infections worldwide and investigates the influencing factors of the pandemic’s connectedness across countries. We integrate three methods, i.e., complex networks, visualization principles, and regression models, to examine the global infection path of the COVID-19 pandemic and explore possible causes for the rapid COVID-19 spread. First, we calculate the correlation of COVID-19 infection growth rates between each pair of countries and obtain a global correlation matrix for COVID-19 infections using the sample from January 19, 2020, to August 15, 2020. Second, we establish a global infection complex network using a global correlation matrix to outline global COVID-19 pandemic relations and study the global infection complex network properties. Third, based on the properties of our complex network, we further investigate how economic and social factors (such as economic size, population density, international trade, government expenditure, inflation, and medical level) affect the network connectedness of the global COVID-19 infection complex network, shedding light on the prevention and control of the COVID-19 pandemic for policymakers.
The main conclusions are as follows. First, the complex network of the global COVID-19 pandemic has some prominent complex network properties, such as small-world network and community structure characteristics. In our network, there are a total of 958 edges in 122 countries around the world. The average path length between any two countries is approximately 3, the clustering coefficient is 0.58, and the network can be divided into several modularity classes. Second, in terms of intercountry connectedness, we further examine important topological characteristics in our network, e.g., degree, triangles, centrality, modularity class, hub, and authority. We use visual figures to demonstrate these features. The deeper the color is, the greater the connectedness in the visual figure is. This suggests that our network reflects the actual situation of the COVID-19 pandemic. Moreover, based on similarity, we divide the complex network into ten modularity classes. On the one hand, the community classification shows that the United States, Russia, and Colombia, which are suffering severely from the COVID-19 pandemic, are in one community, and China and Japan, which have better epidemic control, are in another community. On the other hand, the community classification is closely related to each country’s geographical location. Finally, the analysis of influencing factors reveals that countries with considerable economic size, high population density, and high government expenditure have a higher network connectedness value. In contrast, countries with adequate import capacity and better medical levels can reduce the connectedness. In short, these empirical results can clearly explain the reasons for the rapid global spread of the COVID-19 pandemic.
The contributions of this study are as follows. First, the global COVID-19 pandemic network is constructed based on the number of infected people, and the topological information and connectedness characteristics of the network are obtained, to some extent explaining the spread of the COVID-19 pandemic from the perspective of a complex network. The global COVID-19 pandemic network is a complex network with the characteristics of short average distance and large clustering coefficient and has a good community structure division. Second, integrating the visualization method into the global COVID-19 pandemic network provides visual results of network connectedness, helping us determine the potentially dangerous countries. Finally, we identify economic and social factors affecting COVID-19 network connectedness, including population density, GDP, exports, government spending, and life expectancy. To reduce network connectedness, the government should implement measures to reduce population density, increase medical equipment imports, improve the medical treatment level, and effectively allocate government expenditures.
Literature Review
Vespignani, a professor who is famous for modeling the global spread of epidemics, proposes that there are inherent limitations to predictions in complex sociotechnical systems. However, mathematical and computational models have successfully forecast the size of epidemics and have been used to communicate the risks of uncurbed infectious disease outbreaks in recent years [5]. Since the beginning of the COVID-19 outbreak, many mathematical models have been proposed to describe the pandemic’s spread. Some of them forecast the future dynamics of COVID-19. Perc et al. [6] forecast COVID-19 by using a simple iteration method that needs only the daily values of confirmed cases as input. Other researchers focus on diagnosing the spread of COVID-19 and analyzing the factors of disease transmission. Liu et al. [7] propose a susceptible-asymptomatic-infected-removed (SAIR) model on social networks to describe the spread of COVID-19 and analyze the outbreak based on epidemic data from Wuhan. Kraemer et al. [8] show that China’s drastic control measures substantially mitigated the spread of COVID-19. Tsiotas and Magafas [9] build on the visibility graph algorithm to study the Greek COVID-19 infection curve as a complex network. These studies consider the spread of COVID-19 to be complicated, and diagnosing the scale and characteristics of the COVID-19 pandemic is conducive to governments effectively blocking the spread of this epidemic in their nations. Hence, we believe that it is very effective and important to prevent and control the further spread of COVID-19 by studying the connectedness characteristics of the pandemic complex network.
Studying the connectedness characteristics in a complex network through theoretical analysis and numerical simulation is helpful in understanding the microscopic mechanism of the spread process of an epidemic to discover practical ways to control the spread. Previous research has shown that a real social network is a typical complex network with small-world, scale-free, and high clustering characteristics. Small-world characteristics accelerate the spread of an epidemic, scale-free features facilitate the spread of an epidemic, and high clustering characteristics cause community clustering in epidemic transmission [5, 10–17].
Hence, some scholars have combined complex network theory with epidemiology. Ni [18] builds a dynamic model of an epidemic and shows that infectious diseases spread much faster in public networks than in in-home networks. In the beginning, the number of infected people in the network increases exponentially, and the spread speed obviously increases with increasing local structural scale. Chen et al. [19] simulate the propagation of the H1N1 virus based on complex networks. The simulation results show that the targeted immunization strategy can effectively inhibit the spread of diseases. Wang et al. [3] deeply investigates influential spreaders’ identification in complex networks based on various centrality indices. Wang et al. [4] use a two-layer network model method to find that people who received positive prevention information had a lower risk of disease infection than those who received negative prevention information.
All the abovementioned studies try to provide feasible ways to curb the spread of the epidemic by using mathematical models or complex network tools. They can help us to work with limited data to solve problems in a constantly changing environment. However, at present, there are few studies that examine the global network of COVID-19. Therefore, determining the complicated connectedness of the COVID-19 complex network can fill gaps in the literature and effectively help the government identify good policies to prevent the COVID-19 pandemic in a timely manner. This study attempts to show the global situation of the COVID-19 pandemic based on a complex network. It profoundly analyzes the significant economic and social factors that affect the connectedness of the COVID-19 network to powerfully supplement the above literature.
Data
The growth rate of COVID-19-infected people in each country is calculated using the COVID-19 infection sample from January 19, 2020, to August 15, 2020. The data came from the CSMAR database. To analyze the influencing factors of global COVID-19 infection network connectedness, we use each country’s economic and social macrodata in 2018 as samples. Economic and social variables include GDP, total exports, total imports, inflation rate, government expenses, population density, and life expectancy. All these data are from the World Bank database. From them, we take logarithms of GDP, total exports, total imports, government expenses, and population density to reduce the absolute values.
Methodology
Construction of COVID-19 Pandemic Network
In this study, we build a COVID-19 infection complex network among 122 countries. Any node in our network is a specific country. Moreover, the possible connection between any two countries is called an edge in the network. These nodes and connected edges constitute the entire network of global COVID-19 infections. The network may rely more on certain countries, as many paths pass through them. Once this kind of country is identified and excluded, the network may collapse. Therefore, identifying these import infection nodes can enable governments to better fight the pandemic.
The key step in constructing the COVID-19 pandemic network is measuring the correlation of the growth rate of COVID-19-infected people among countries. The specific construction process of the COVID-19 pandemic network is as follows.
First, we exclude countries with fewer than 2,000 infected people and then calculate the growth rate of infected people in the remaining 122 countries individually.
where
Second, we compute the correlation coefficients of the infected persons’ growth rate between any two countries. The correlation coefficient is formulated as follows:
where
Third, we need to set a threshold for correlation coefficients to define the existence of the possible connection. To fulfill this purpose, we take half of the mean of each country’s maximum correlation coefficient (approximately 0.4) as the threshold value for the existence of connectedness. If the correlation coefficient between the two countries is higher than the threshold, a line is drawn in the network to connect these two countries, indicating a connection between them.
This method can test the network connectedness between all countries, draw undirected connecting lines in the network, and finally create a COVID-19 pandemic infection network.
Complex Network Characteristics
Centrality Analysis
Centrality is an important indicator of each node’s status and role in the network, and it can be used to judge whether an individual node is influential [3]. The higher a node’s centrality is, the more significant its influence in the network is, suggesting that it can influence other nodes more prominently. In complex network analysis, there are many ways to characterize the centrality of a node. The most important are betweenness centrality, closeness centrality, eigenvector centrality, and page rank.
1) Betweenness centrality
In a network, a certain node’s degree may be very small, but it may be the intermediate node between any two other nonadjacent nodes. If this node is removed, the connectivity between the nonadjacent nodes will be interrupted. Therefore, the node plays a vital role in the network. For such a node, we can define betweenness.
The core idea is that the interaction between two nonadjacent nodes depends on other nodes in the network, especially those on the shortest path. They exert a certain control over the two nonadjacent nodes. For example, if node A is located on multiple shortest paths between other nonadjacent nodes, node A plays a greater role and has greater betweenness centrality.
Freeman [20] suggests that the shortest path between nonadjacent nodes
where
Then, the betweenness centrality of
2) Closeness centrality
Sabidussi [21] proposes that the closeness centrality of
where
3) Eigenvector centrality
Bonacich [22] suggests that eigenvector centrality is another important centrality measurement method for nodes. For node
where N is the total number of nodes and
4) Page rank
Page rank [23] can be understood as a random walk on a graph. It can be defined as follows:
where
Small-World Network
The small-world property is an important topological feature of the network. Watts and Strogatz [10] propose the small-world network model (WS small-world network). They argue that some network systems are large in size but have a relatively small distance between any two nodes. A typical small-world network has a shorter average distance and a larger clustering coefficient. For example, there are no more than six people between any two strangers in a small-world social network.
1) Clustering coefficient
In a WS small-world network, the clustering coefficient quantifies the tendency of the nodes of a complex graph to cluster. In terms of a certain node v in the WS small-world network,
The initial network is a one-dimensional lattice of N sites, with periodic boundary conditions (i.e., a ring), each vertex being connected to its
2) Average path length
The average distance between any two nodes would also show interesting properties in a given complex network. The diameter D of a complex network is defined as the maximum distance between any pair of nodes.
Watts and Strogatz [10] argue that in terms of random networks, almost all networks have the same diameter. This means that the Nth-order random network with probability P has a tiny change in diameter. Watts [25] suggests that the diameter D is usually concentrated as follows:
Supposing
Modularity Class
Newman [26, 27] proposes modularity, which enables a clear evaluation indicator to measure the segmentation of network communities. In other words, modularity refers to the difference between an ordinary network and a random network under a specific community division criterion. Because the random network does not have a community structure, the larger the difference is, the better the community division will be.
Newman [27] defines modularity as follows:
where m is the total number of edges in the network, A is the corresponding adjacency matrix of the network, and
Empirical Results and Discussion
COVID-19 Pandemic Network
In this section, we present our COVID-19 pandemic network. We first calculate the daily growth rate of the infected population in 122 countries individually and then calculate the correlation coefficient
Finally, the COVID-19 pandemic network obtained in this study is a complex network without considering the direction, and it is an undirected network with 122 nodes and 958 connected edges.
Using the software Gephi, we generate a visual graph of our network. The results are shown in Figure 1. Taking China, the United States, and Brazil as examples, China has connectedness with Singapore, Japan, and Thailand; the United States has connectedness with Australia, Kenya, Colombia, Pakistan, Dominica, Turkey, and Luxembourg; and Brazil has connectedness with 16 countries, including Austria, Portugal, Denmark, Saudi Arabia, and France.
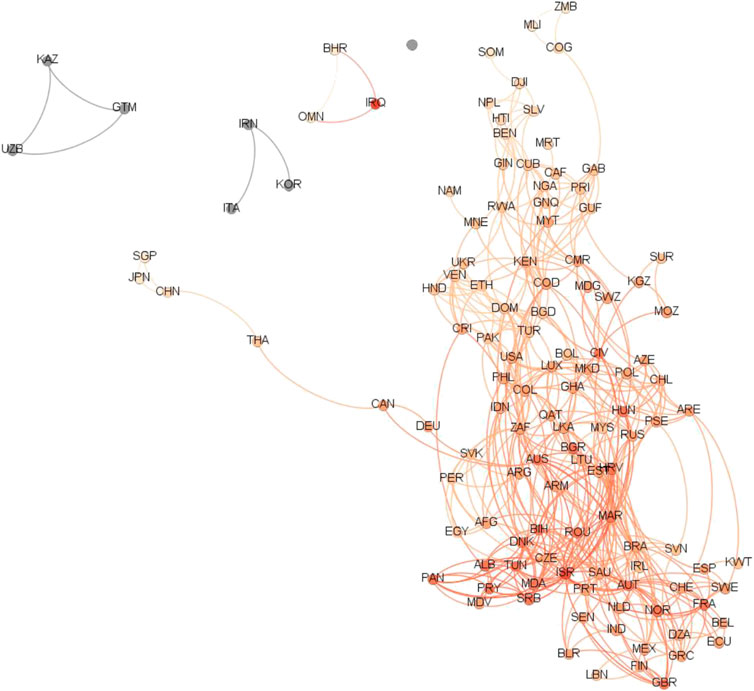
FIGURE 1. The global COVID-19 pandemic network. Note: This is the global COVID-19 pandemic network. It excludes countries with fewer than 2,000 infected people. When the correlation of the growth rate of infected people is larger than 0.4, there is a connected edge between countries.
Then, we use Gephi to obtain the network topology characteristic values, which is the basis for the next step of the analysis. Figures 2 and 3 show the COVID-19 pandemic network parameters. Figure 2 shows the degree distribution in our COVID-19 pandemic network. The overall distribution of the graph shows that the COVID-19 pandemic network is relatively dispersed. Figure 3 shows the clustering coefficient graph. The larger the clustering coefficient is, the higher the extent of the connection between neighbors is. Our COVID-19 pandemic network has a clustering coefficient of 0.58. This large clustering coefficient indicates that the COVID-19 pandemic network is a very close world.
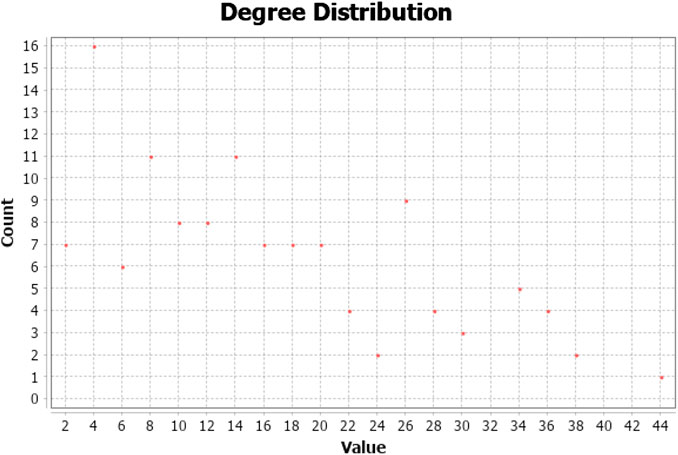
FIGURE 2. The degree distribution of the global network. Note: Figure 2 represents the degree distribution. The vertical and horizontal axes of each subplot are node counts and parameter distribution values, respectively. The horizontal axis represents the degree value of each country. The vertical axis represents the number of countries. For example, value = 2 and count = 7 means that there are seven countries, and they all have a degree of two.
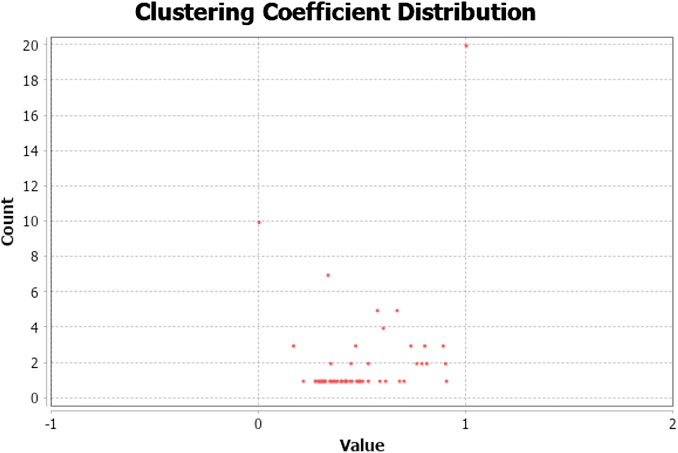
FIGURE 3. The clustering coefficient distribution of the global network. Note: Figure 3 represents the distribution of clustering coefficients in various countries. The vertical and horizontal axes of each subplot are node counts and parameter distribution values, respectively. The horizontal axis represents the clustering coefficient value of each country. The vertical axis represents the number of countries.
Other overall characteristics of the COVID-19 pandemic network are shown in the following table.
Table 1 shows that the COVID-19 pandemic network has 122 nodes, and the number of edges between nodes is 985 with an average degree of 7.85, average path length of 3.104, clustering coefficient of 0.58, and diameter of 8. Moreover, the clustering coefficient is large, so the network has close-world network characteristics.
In addition, the small-world network has the characteristics of a small path length and a high clustering coefficient between nodes. Our global COVID-19 pandemic network’s average path length is 3.104, and its clustering coefficient is 0.58, indicating that the global COVID-19 pandemic network has some characteristics of a small-world network.
Connectedness Characteristics of the Global COVID-19 Pandemic Network
In this section, we further analyze some important characteristics of the global COVID-19 pandemic network. Specifically, we focus on the degree, triangles, centrality, modularity class, and authority and then provide the visual results.
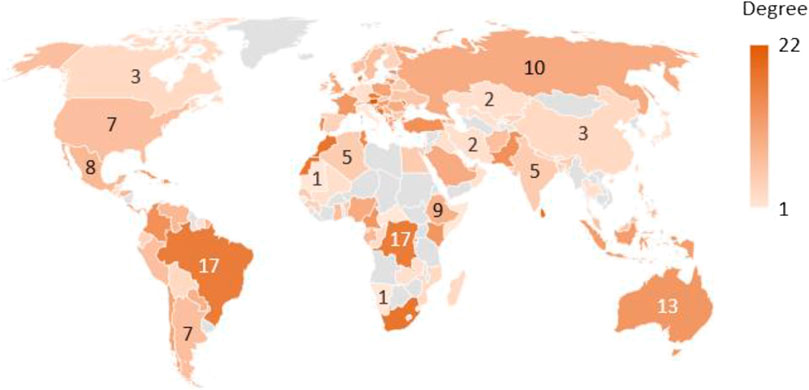
Figure 4 represents the degree of each country in the global COVID-19 pandemic network. The degree of country i is the total number of edges directly connected to that country. The deeper a country’s color is, the greater its degree is. As shown in Figure 4, Brazil has the deepest color on the American continents; in Europe, Austria has the greatest degree; in Asia, Israel and Sri Lanka have the highest number of edges; in Oceania, the color of Australia is the deepest; and in Africa, the countries with the greatest degree are South Africa and Morocco. The above results indicate that these countries have the greatest degrees with other countries and a prominent ability to spread COVID-19 to other countries. Thus, more attention should be paid to their capacity and measures for COVID-19 pandemic prevention and control.
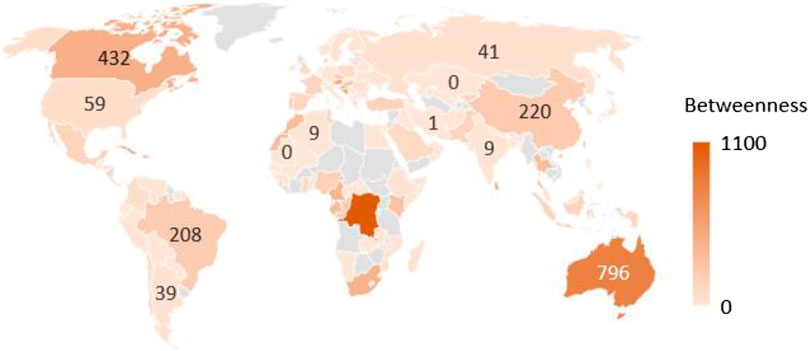
Figures 5–8 show the centrality analysis results, reflecting the relative importance of each node in the network. Figure 5 shows betweenness centrality. The countries with the deepest colors are the Democratic Republic of the Congo, Australia, and Croatia, which are located in Africa, Oceania, and Europe, respectively. This finding indicates that these three countries play an important betweenness role in the COVID-19 pandemic network. Additionally, Canada and Cuba in North America are also significant. We may more easily halt the global spread of COVID-19 if we control the pandemic in these three countries first.
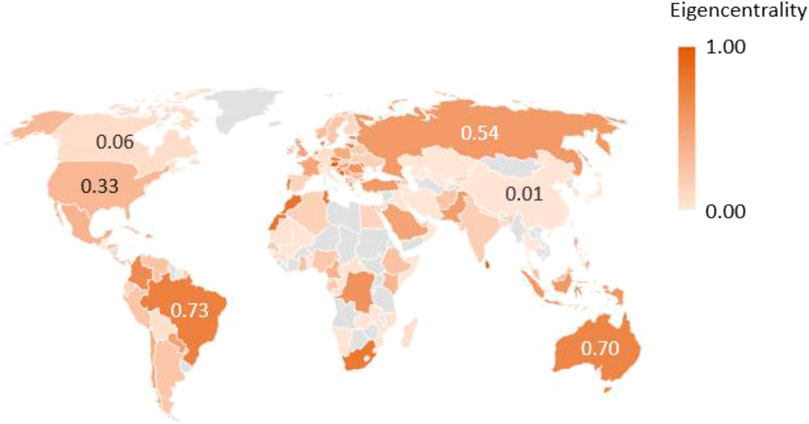
Figure 6 shows eigenvector centrality. The three countries with the deepest colors are Moldova, Sri Lanka, and Austria, located in Europe, Asia, and Europe, respectively. This finding shows that the three countries have the highest centrality scores and are the nodes with the greatest importance in the COVID-19 pandemic network. Again, Austria shows its importance in the COVID-19 pandemic network, indicating that the effective control of COVID-19 in Austria has a significant role in halting the global spread of the COVID-19 pandemic.
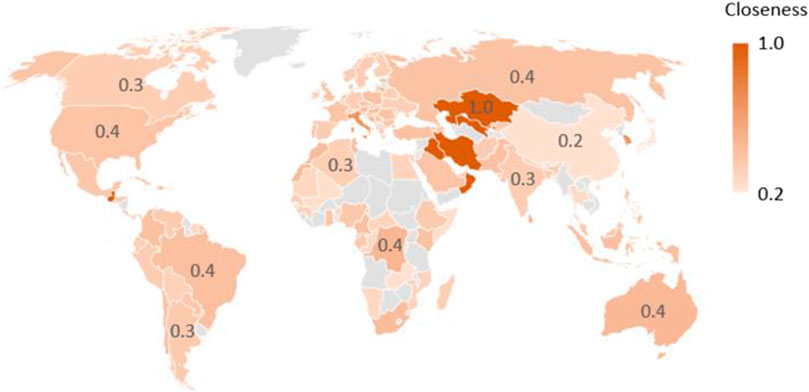
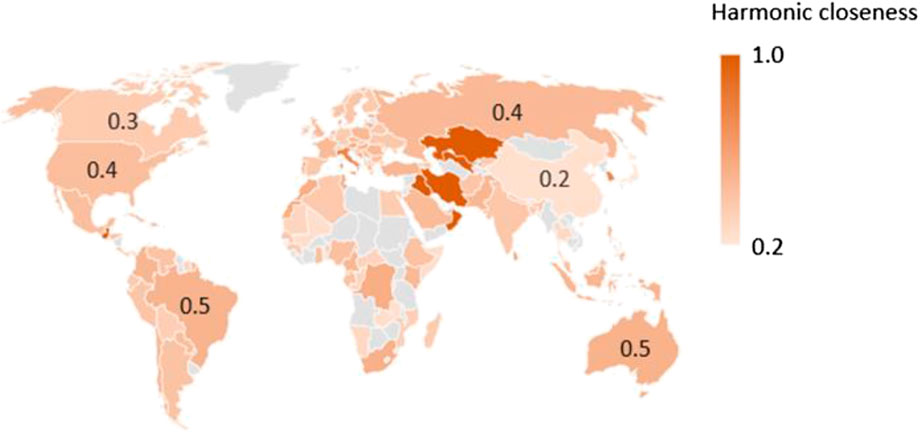
Figure 7 represents closeness centrality. The three countries with the deepest colors are Kazakhstan, Iraq, and Uzbekistan, all located in Asia. This means that Kazakhstan, Iraq, and Uzbekistan may be important for Asian COVID-19 control. Figure 8 shows harmonic closeness centrality. The empirical results are the same as those shown in Figure 7.
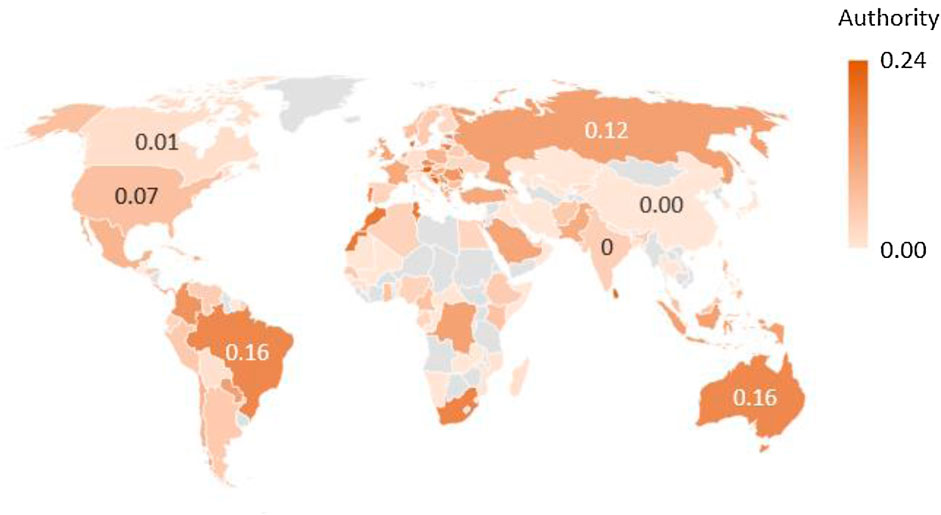
Figure 9 shows the analysis results of authority, reflecting the influence of nodes in the network. The three countries with the deepest colors are Moldova, Israel, and Austria, located in Europe, Asia, and Europe, respectively. This indicates that the infections in Moldova, Israel, and Austria are highly dangerous, as these three countries may have high virus spread capacity.
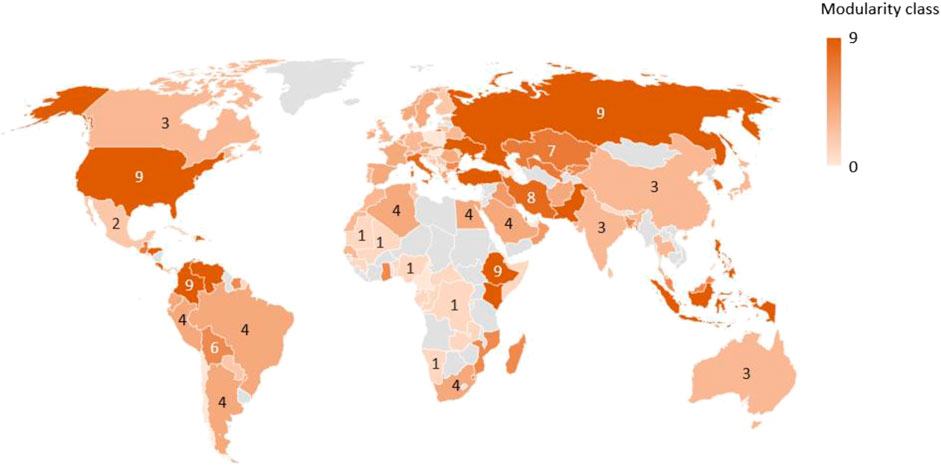
Figure 10 shows modularity-class analysis results, describing the community situation in the network. The results show that the modularity coefficient is 0.526, and the COVID-19 pandemic network is divided into 10 communities, representing community structures. Community 0 contains 8 countries, including Palestine, Poland, and the United Arab Emirates. Community 1 contains Cuba, the Democratic Republic of the Congo, and 23 other countries. Community 2 contains Mexico, Moldova, Sri Lanka, Israel, and so on. Community 3 contains 13 countries, including China, Canada, Britain, India, Germany, Australia, and Japan. Community 4 contains 24 countries, including France, Brazil, Austria, and South Africa. Community 5 contains Bahrain, Iraq, and Oman. Community 6 contains 11 countries, including Bangladesh, Kyrgyzstan, and Ghana. The countries in Community 7 are Uzbekistan, Kazakhstan, and Guatemala. The countries in Community 8 are Iran, South Korea, and Italy. Community 9 contains 16 countries, including the United States, the Russian Federation, and Colombia.
The Determinants of Connectedness
According to the above analysis, the connectedness of the global COVID-19 infection network varies across different countries. Therefore, what factors influence the network connectedness of COVID-19 infection? Hereafter, this study further explores how economic factors, population density, medical level, and other social factors influence the connectedness of COVID-19 by using a quantitative regression method to provide a theoretical basis and guidance for policymakers’ prevention and control measures.
We build the econometric model as follows:
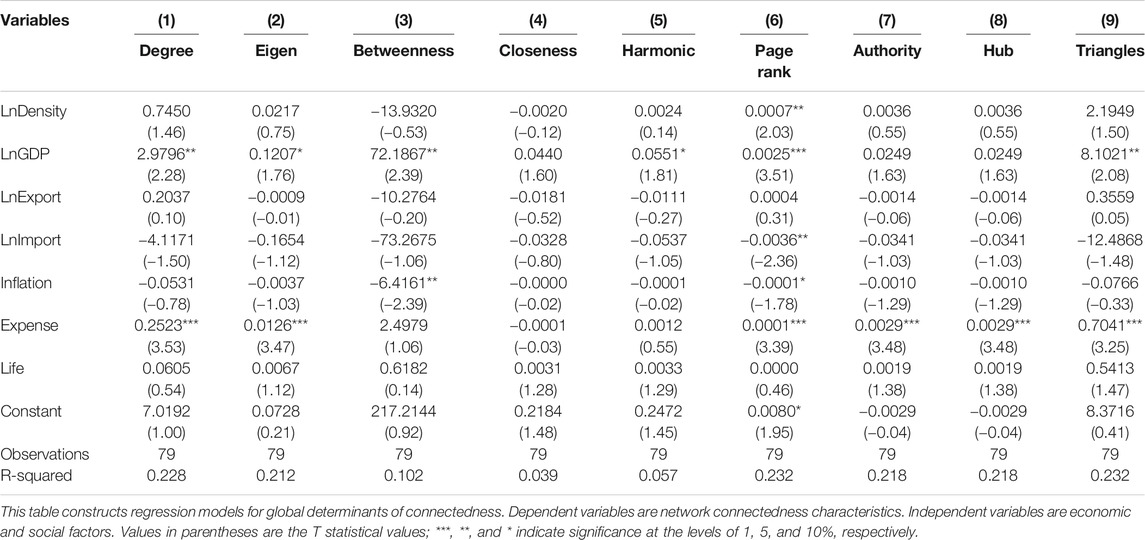
where connectednessi represents degree, eigenvector centrality, betweenness centrality, closeness centrality, harmonic centrality, page rank, authority, hub, and triangles separately. LnDensity means the logarithms of population density. LnGDP is the logarithms of economic size. LnExport is the logarithms of total exports. LnImport is the logarithms of total imports. Inflation indicates monetary policy. Expense represents government expenditure. Life represents life expectancy, reflecting the quality of medical treatment.
Table 2 shows the regression results between the characteristics of the COVID-19 pandemic network and other possible determinant factors. In columns (1)–(7), we investigate how the degree, eigenvector centrality, betweenness centrality, closeness centrality, harmonic closeness centrality, page rank, authority, hub, and triangles are affected by possible influencing factors.
In columns (1) and (2), LnGDP and Expense are significantly positive at the 10% confidence level, indicating that economic level and government expenditure will significantly increase degree and eigenvector centrality. In column (3), LnGDP is also significantly positive at the 5% confidence level, indicating that the economic scale significantly increases betweenness centrality, consistent with the result of degree and eigenvector centrality. Inflation is significantly negative at the 5% confidence level, suggesting that it significantly reduces betweenness centrality. In column (5), the estimated coefficient of LnGDP is still significantly positive at 10%, suggesting that economic size will significantly increase harmonic closeness centrality. In column (6), LnDensity, LnGDP, and Expense are all significantly positive at the 5% confidence level, indicating that population density, economic scale, and government expenditure increase page rank. However, LnImport is significantly negative at 5%, indicating that imports significantly reduce page rank. In columns (7) and (8), Expense has a significantly positive coefficient at 1%, meaning that the amount of government expenditure will significantly increase authority and hub. In column (9), LnGDP and Expense are significantly positive at 5%, indicating that the size of the economy and government spending significantly increase triangles.
Overall, the economic development level and government spending show significant positive effects on COVID-19 infection connectedness. If policymakers hope to curb the spread of COVID-19 effectively, they should give priority to the COVID-19 pandemic, appropriately reduce economic activities, and avoid crowd gatherings to reduce the risk of infection. Moreover, government expenditures need to be allocated more effectively. Controlling and preventing the spread of COVID-19 should be the first goal of government expenditures. More government resources should be used to purchase medical devices and improve medical staff protection and treatment. The United States is a case in point. As the United States has prioritized the economy in its COVID-19 prevention policy, a large amount of fiscal spending has been used to subsidize economic activities rather than medical resources. As a result, the number of confirmed COVID-19 cases in the United States is approaching 9 million.
The Determinants of Connectedness: Asia and Europe
To further analyze how economic and social factors affect Asian and European countries’ connectedness characteristics differently, this study divides the samples into Asian and European countries.
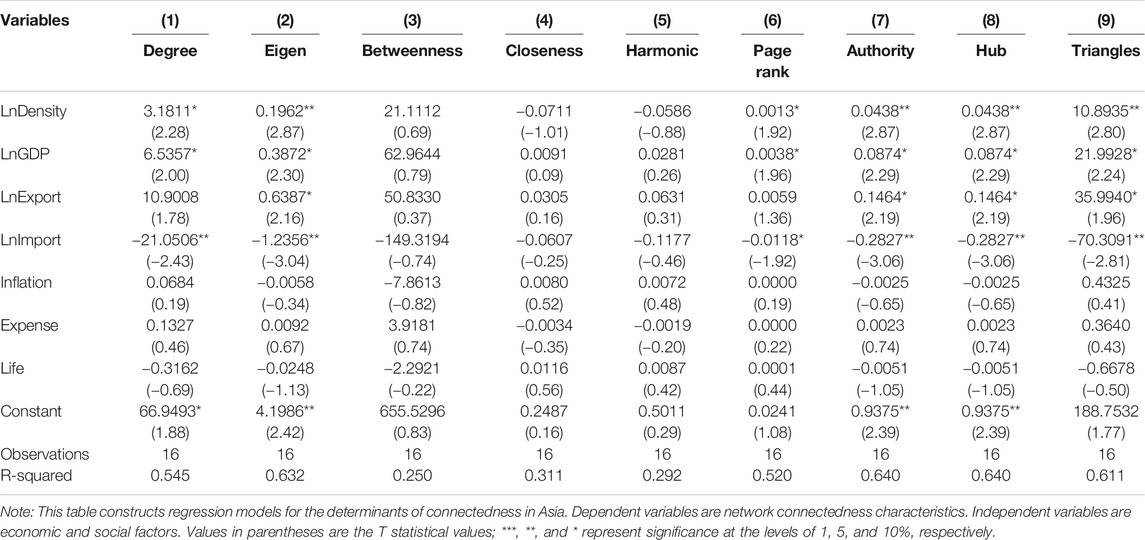
Table 3 shows the empirical results in Asia. In Asia, LnDensity, LnGDP, and LnExport are significantly positive at the 10% confidence level for degree, eigenvector, authority, hub, and triangles, indicating that population density, economic activities, and export activities show significantly positive effects in the Asian COVID-19 pandemic network. However, LnImport is persistently significantly negative at the 10 or 5% confidence level for degree, eigenvector, page rank, authority, hub, and triangles, showing that imports can effectively reduce the characteristics of the COVID-19 pandemic network in Asia.
In summary, for Asian countries, population density and economic activities significantly increase the connectedness of the COVID-19 pandemic network, which is consistent with the full sample results. As most Asian countries have large populations and high residential density, it is very important and influential for them to decrease economic activities and strengthen quarantine measures appropriately. In addition, more substantial imports would reduce the connectedness of the COVID-19 pandemic network in Asian countries. We suspect that one of the reasons is that most Asian countries’ medical level is still relatively low. More imports of materials and medical equipment can effectively reduce domestic resource pressure, thus reducing connectedness.
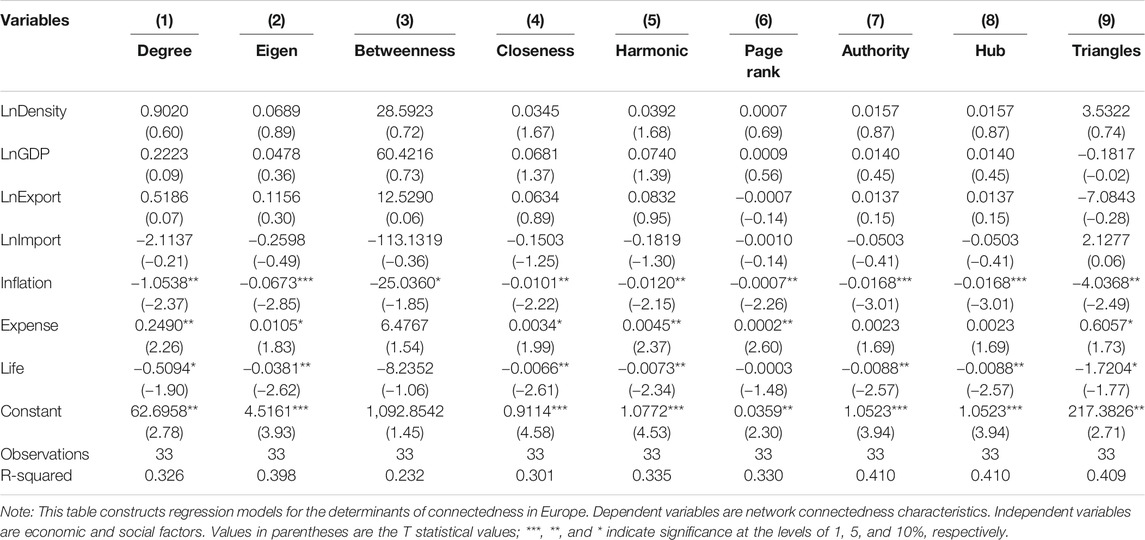
Table 4 shows the empirical results for Europe. In Europe, the coefficients of Expense for degree, eigenvector, closeness, harmonic closeness, and page rank are significantly positive at 10 or 5%, meaning that government expenses in Europe may be a burden and that governments do not effectively use their resources to control the COVID-19 pandemic. The estimated coefficients of inflation for all characteristics are all significantly negative except for betweenness and page rank. All the estimated coefficients of Life are significantly negative at 10 or 5%, indicating that as countries with higher life expectancy are more likely to have a better medical level; life expectancy is negatively associated with the connectedness of the COVID-19 pandemic network.
Compared with Asian countries, economic activity, population density, and government expenditure do not significantly increase the connectedness of the COVID-19 pandemic network in Europe. However, life expectancy can effectively reduce network connections. As European countries have more capital intensive and high value-added industries compared with Asia, the infection possibility of COVID-19 is relatively low in those industries. We believe that cutting down economic activities can not effectively prevent and control the spread of COVID-19 pandemic in Europe. Moreover, as the population density in Europe is much lower than that in Asia, it is difficult for the government of European countries to lower their population density furthermore. Therefore, population density is not significantly associated with the connectedness of the COVID-19 pandemic in Europe. Compared with Asian countries, most European countries have a higher economic development level, so their government expenditure is generally used for medical expenditure. Government expenditure can effectively strengthen a country’s medical resources. Therefore, life expectancy in Europe is higher, and life expectancy is negatively associated with the connectedness of the COVID-19 network, suggesting that the European medical level is useful for preventing and controlling COVID-19.
Due to differences in economic and social characteristics, policymakers should use different prevention and control measures for different countries. Each country should implement prevention policy measures according to its local conditions. Only in this way can we effectively control the further spread of COVID-19.
Conclusion
Based on the growth pattern of the number of COVID-19 infections worldwide, this study constructed a complex network among 122 countries. Complex network analysis was used to deconstruct the overall connectedness of COVID-19 infection networks, visualize the connectedness characteristics among countries in the network, and further explore the influencing factors of the global COVID-19 infection network based on macrodata such as the economy, population, and life expectancy.
Our research shows that, first, in terms of overall connectedness, the global COVID-19 pandemic network has small-world network, close-world network, and community structure features. There are a total of 958 edges in 122 countries worldwide, which are divided into ten communities. This network has a small average path length (3.14) and a high clustering coefficient (0.58), and its diameter is 8. Second, in terms of intercountry connectedness, some countries have a significant influence on the global COVID-19 pandemic network, such as Austria (Europe), Croatia (Europe), Moldova (Europe), Brazil (South America), Canada (North America), Iran (Asia), Kazakhstan (Asia), Uzbekistan (Asia), Republic of the Congo (Africa), and Austria (Oceania). More attention should be paid to these countries for further control of COVID-19.
In addition, we divide the network into ten communities. The United States, Russia, and Colombia, which are suffering more severely from COVID-19, are in a community, while China and Japan, which have better control of COVID-19, are in another community.
Finally, in the influencing factor analysis, our study finds that population density, economic size, exports, and government expenditure significantly increased the connectedness of the COVID-19 infection network. However, imports and life expectancy significantly reduced the connectedness of the COVID-19 infection network. This result indicates that countries with large economic size, high population density, and high government expenditure more easily suffer from and spread COVID-19. In contrast, countries with adequate import capacity and a better medical level can reduce the network connectedness.
Data Availability Statement
The original contributions presented in the study are included in the article/Supplementary Material; further inquiries can be directed to the corresponding authors.
Author Contributions
SZ performed the coding, data analysis, and original draft. MK gave formal writing-review and editing. FL proposed the conceptualization and methodology and modified final draft. QF performed the funding acquisition, original draft preparation, and data preparation. GD performed the data collection and original arrangement.
Funding
This study was funded by the Scientific Research Fund Project of Yunnan Education Department (No.2021J0586), the Fundamental Research Funds for the Central Universities. (No.20wkpy85), and the China Postdoctoral Science Foundation (No. 2019M663356).
Conflict of Interest
The authors declare that the research was conducted in the absence of any commercial or financial relationships that could be construed as a potential conflict of interest.
References
1. Moore C, Newman ME. Epidemics and percolation in small-world networks. Phys Rev E Stat Phys Plasmas Fluids Relat Interdiscip Topics (2000) 61(5):5678–82. doi:10.1103/physreve.61.5678
2. Stegehuis C, Van Der Hofstad R, Van Leeuwaarden JS. Epidemic spreading on complex networks with community structures. Sci Rep (2016) 6(1):29748–7. doi:10.1038/srep29748
3. Wang J, Li C, Xia C. Improved centrality indicators to characterize the nodal spreading capability in complex networks. Appl Math Comput (2018) 334:388–400. doi:10.1016/j.amc.2018.04.028
4. Wang Z, Xia C, Chen Z, Chen G. Epidemic propagation with positive and negative preventive information in multiplex networks. IEEE Trans Cybern (2020) [Epub ahead of print]. doi:10.1109/TCYB.2019.2960605
5. Pastor-Satorras R, Castellano C, Van Mieghem P, Vespignani A. Epidemic processes in complex networks. Rev Mod Phys (2015) 87(3):925. doi:10.1103/RevModPhys.87.925
6. Perc M, Gorišek Miksić N, Slavinec M, Stožer A. Forecasting Covid-19. Front Phys (2020) 8:127. doi:10.3389/fphy.2020.00127
7. Liu C, Wu X, Niu R, Wu X, Fan R. A new SAIR model on complex networks for analysing the 2019 novel coronavirus (COVID-19). Nonlinear Dynam (2020) 1–11. doi:10.1007/s11071-020-05704-5
8. Kraemer MUG, Yang CH, Gutierrez B, Wu CH, Klein B, Pigott DM, et al. The effect of human mobility and control measures on the COVID-19 epidemic in China. Science (2020) 368(6490):493–7. doi:10.1126/science.abb4218
9. Tsiotas D, Magafas L. The effect of anti-COVID-19 policies to the evolution of the disease: a complex network analysis to the successful case of Greece (2020) arXiv preprint arXiv:2004.06536.
10. Watts DJ, Strogatz SH. Collective dynamics of ‘small-world’ networks. Nature (1998) 393(6684):440–2. doi:10.1038/30918
11. Pastor-Satorras R, Vespignani A. Epidemic spreading in scale-free networks. Phys Rev Lett (2001) 86(14):3200–3. doi:10.1103/PhysRevLett.86.3200
12. Newman ME. Communities, modules and large-scale structure in networks. Nat Phys (2012) 8(1):25–31. doi:10.1038/nphys2162
13. Wang P, Tian C, Lu J-a. Identifying influential spreaders in artificial complex networks. J Syst Sci Complex (2014) 27(4):650–665. doi:10.1007/s11424-014-2236-4
14. Estrada E, Hatano N, Benzi M. The physics of communicability in complex networks. Phys Rep (2012) 514(3):89–119. doi:10.1016/j.physrep.2012.01.006
15. Liu Y-Y, Barabási A-L. Control principles of complex systems. Rev Mod Phys (2016) 88(3):035006. doi:10.1103/RevModPhys.88.035006
16. Liao H, Mariani MS, Medo M, Zhang Y-C. Ranking in evolving complex networks. Phys Rep (2017) 689:1–54. doi:10.1016/j.physrep.2017.05.001
17. Hu J, Chengyi X, Huijia L, Peican Z, Wenjun X. Properties and structural analyses of USA’s regional electricity market: a visibility graph network approach. Appl Math Comput (2020) 385:125434. doi:10.1016/j.amc.2020.125434
18. Ni S. Research on modeling of infectious disease spreading based on complex Network theory. Beijing, China: School of Aeronautics and Astronautics, Tsinghua University (2009).
19. Chen D, Huang S, Shang M. Complex network model and application in epidemic spreading and controlling. Comput Sci (2011) 38(6):118–21. doi:10.3969/j.issn.1002-137X.2011.06.028
20. Freeman LC. A set of measures of centrality based on betweenness. Sociometry (1977) 40:35–41. doi:10.2307/3033543
21. Sabidussi G. The centrality of a graph. Psychometrika (1966) 31(4):581–603. doi:10.1007/BF02289527
22. Bonacich P. Some unique properties of eigenvector centrality. Soc Network (2007) 29(4):555–64. doi:10.1016/j.socnet.2007.04.002
23. Page L, Brin S, Motwani R, Winograd T. The PageRank citation ranking: bringing order to the web. Stanford InfoLab (1999) 9(1):1–14.
24. Barrat A, Weigt M. On the properties of small-world network models. Eur Phys J B (2000) 13(3):547–60. doi:10.1007/s100510050067
25. Watts DJ. Networks, dynamics, and the small-world phenomenon. Am J Sociol (1999) 105(2):493–527. doi:10.1086/210318
26. Newman ME. Fast algorithm for detecting community structure in networks. Phys Rev E Stat Nonlin Soft Matter Phys (2004) 69(6):066133. doi:10.1103/PhysRevE.69.066133
Keywords: COVID-19, pandemic, connectedness, complex network, economic and social factors
Citation: Zhu S, Kou M, Lai F, Feng Q and Du G (2021) The Connectedness of the Coronavirus Disease Pandemic in the World: A Study Based on Complex Network Analysis. Front. Phys. 8:602075. doi: 10.3389/fphy.2020.602075
Received: 02 September 2020; Accepted: 07 December 2020;
Published: 25 January 2021.
Edited by:
Hui-Jia Li, Beijing University of Posts and Telecommunications (BUPT), ChinaReviewed by:
Ju Xiang, Changsha Medical University, ChinaChengyi Xia, Tianjin University of Technology, China
Copyright © 2021 Zhu, Kou, Lai, Feng and Du. This is an open-access article distributed under the terms of the Creative Commons Attribution License (CC BY). The use, distribution or reproduction in other forums is permitted, provided the original author(s) and the copyright owner(s) are credited and that the original publication in this journal is cited, in accordance with accepted academic practice. No use, distribution or reproduction is permitted which does not comply with these terms.
*Correspondence: Fujun Lai, bGZqbGZqOTk5QDE2My5jb20=; Qingxiang Feng, ZmVuZ3F4OEBtYWlsLnN5c3UuZWR1LmNu
 Sha Zhu
 Meng Kou2
 Fujun Lai
 Qingxiang Feng
 Guorong Du
