
94% of researchers rate our articles as excellent or good
Learn more about the work of our research integrity team to safeguard the quality of each article we publish.
Find out more
ORIGINAL RESEARCH article
Front. Phys. , 08 February 2021
Sec. Medical Physics and Imaging
Volume 8 - 2020 | https://doi.org/10.3389/fphy.2020.601623
This article is part of the Research Topic Energy-Sensitive X-Ray Computed Tomography Imaging View all 9 articles
 Zhidu Zhang1,2
 Xiaomei Zhang1,2
 Jinming Hu1,2Qiong Xu1,3Mohan Li1,3Cunfeng Wei1,2,3Long Wei1,2,3Zhe Wang1,3*
In K-edge decomposition imaging for the multienergy system with the photon counting detectors (PCDs), the energy bins significantly affect the intensity of the extracted K-edge signal. Optimized energy bins can provide a better K-edge signal to improve the quality of the decomposition images and have the potential to reduce the amount of contrast agents. In this article, we present the Gaussian spectrum selection method (GSSM) for the multienergy K-edge decomposition imaging which can extract an optimized K-edge signal by optimizing energy bins compared with the conventional theoretical attenuation selection method (TASM). GSSM decides the width and locations of the energy bins using a simple but effective model of the imaging system, which takes the degraded energy resolution of the detector and the continuous x-ray spectrum into consideration. Besides, we establish the objective function, difference of attenuation to relative standard deviation ratio (DAR), to determine the optimal energy bins which maximize the K-edge signal. The results show that GSSM gets a better K-edge signal than TASM especially at the lower concentration level of contrast agents. The new method has the potential to improve the contrast and reduce the amount of contrast agents.
K-edge decomposition imaging has remarkable potential in some clinical applications like the x-ray oncology imaging for the breast and the abdomen [1, 2]. At present, the K-edge decomposition imaging is commonly realized using traditional dual-energy devices [3, 4]. There are four types of devices for dual-energy imaging: the sequence scan device, the dual-source device [5], the dual-layer detector device [6], and the fast kVp switching device [7]. The sequence scan device requires double exposures which increase the motion artifacts [8]. The dual-source device has a much more complex system and the images obtained have different phases. The dual-layer detector device can obtain images at the same phase in one exposure, but its energy resolution performance is relatively weak which goes against the quality of resulting images. The fast kVp switching device has a higher requirement of the imaging system and still has the problem of phase-matching. Besides, the energy mixing of the photons weakens the K-edge signal [9].
In recent years, the development of the photon counting detectors (PCDs) attracted much attention for multienergy imaging [10]. Multienergy imaging based on PCDs can obtain images within different energy bins in one exposure and thereby can solve the exiting problems of the dual-energy imaging to a certain extent [11, 12]. Also, because of the energy resolving ability and adjustable energy thresholds of PCDs, it can obtain more precise spectrum information to improve the K-edge signal [13]. Therefore, multienergy imaging based on PCDs is one of the research focuses.
The energy bins used for the K-edge decomposition imaging based on the PCDs significantly affect the contrast of the processed images [14, 15]. The energy bins decided by the conventional theoretical attenuation selection method (TASM) are widely used for K-edge decomposition imaging as shown in Figure 1. In this figure, the two energy bins are symmetrical on both sides of the theoretical K-edge position [16, 17], but the limited energy resolution of the PCDs distorts the attenuation curve [18] which will lead to the deviation of the energy bins in TASM. Several physical effects of the PCD are responsible for the degradation of energy resolution, including Compton scattering [19], charge sharing [20], pulse pileup [21], and fluorescence emission [22]. Moreover, the continuous x-ray spectrum also flattens the K-edge signal [23]. The weakened K-edge signal can further influence the quality of the decomposition image and increase the amount of the contrast agents.
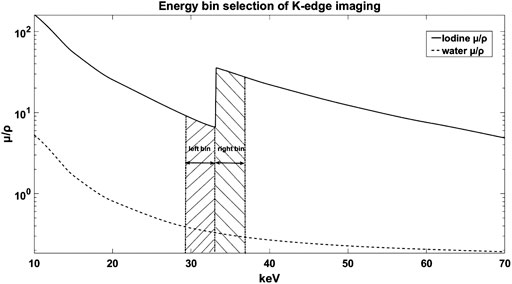
FIGURE 1. The mass attenuation coefficient of water and iodine for x-rays. The shadow parts represent the general energy bins selection for K-edge subtraction imaging.
Some authors optimized the K-edge decomposition algorithm in previous studies [24–26] to guarantee the results of the decomposed images. Mang Feng et al. [27] and Ding et al. [28] optimized the x-ray spectrum which have the potential to get a better image contrast.
Another effective way to improve the quality of the K-edge decomposition imaging is optimizing the energy bins. Previous work was mostly focused on optimizing the width of the energy bins used for K-edge imaging, He et al. decided the energy bin width by signal difference to noise ratio (SDNR) next to the K-edge position [29]. Bo Meng et al. used the redescribed signal to noise ratio (SNR) to obtain the energy bin width next to the K-edge position [30]. Seung-Wan Lee et al. carried out some simulation work on optimizing the energy bins [31]. However, few studies considered the effects of the degraded energy resolution and the continuous x-ray spectrum on energy bins optimization which distort the attenuation curve and lead to a deviation of the energy bins. To take these negative factors into consideration, Silvia Pani et al. selected the energy bins by mapping the spectrum passing through the contrast agents [25], but the disadvantage of this approach is being too tedious for the practical application.
In this work, we propose the Gaussian spectrum selection method (GSSM) for multienergy imaging to increase the intensity of K-edge signal. It takes the degraded energy resolution and the continuous x-ray spectrum into consideration by modeling the imaging system and decides the optimal energy bins by the objective function, difference of attenuation to relative standard deviation ratio (DAR), proposed in this research. GSSM can obtain both the width and the locations of the optimized energy bins without the spectrum mapping process. The experimental results in Experimental Materials and Designs show that the decomposition image obtained by the GSSM has a higher quality than that obtained by the TASM.
The method of this study to optimize the energy bins is based on the modeling of the multienergy imaging system. We estimate the influence of the energy resolution (
The mass theoretical attenuation curve of the material with K-edge changes to the shape shown in Figure 2 under the influence of
where
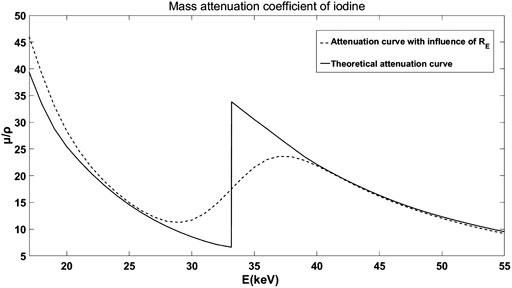
FIGURE 2. The theoretical mass attenuation curve and the curve with the influence of
The influence of spectrum is expressed by the equivalent mass attenuation coefficient (
The quality of the decomposition image is determined by not only the contrast but also the noise level.
This research proposes the objective function, the difference of attenuation to relative standard deviation ratio (DAR) to maximize the K-edge signal, and the meaning of DAR is shown in
where
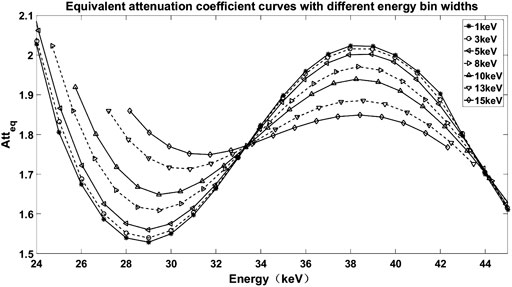
FIGURE 3. Equivalent mass attenuation coefficient curves of iodine with different energy bin widths.
The detailed derivation of DAR is provided in Appendix 1. The final DAR expression is shown in
where (
The optimal solution
where
Take iodine as an example, where the left bin and right bin images
And the left bin and right bin images
where the
We also take the iodine contrast agents as an example. Considering the superposition of background and iodine, the images for the left and the right energy bins next to the K-edge can be expressed as in (9) [25]:
where
The iodine information is calculated to get the iodine-equivalent image with
The imaging system used in this research was a spectral microcomputed tomography (CT) prototype for small animals, which was independently developed by the Institute of High Energy Physics, Chinese Academy of Sciences. It can realize multienergy digital radiography (DR) and CT scanning by using the photon counting detector produced by XCounter. The sensor material of the detector is CdTe and its thickness was 0.75 mm. The effective area was 153.6*25.6 mm2. The detector has 1536*256 pixels with a single pixel area of 100*100 μm2. It has two energy thresholds and it can detect the photons with the energy range from 10 keV to 160 keV. The two energy thresholds determine the lower and higher boundary of an energy bin in one scanning. To acquire images with different energy bins, we use the multiple scanning procedure of the CT system. In our previous work, the energy resolution of the detector has been studied with several isotopes [38]. The R0 and E0 used in this article are 22.1% for 59.6 keV.
In this research, the iodine mass attenuation coefficient curve was mapped to verify the availability of the model we proposed. Besides, the mass attenuation coefficient curve of gadolinium was mapped to test the accuracy of the model. The solutions with the concentration of 100 mg I/ml and 100 mg Gd/ml were loaded in PE centrifuge tubes with a volume of 1.5 ml. Considering the K-edge positions of iodine and gadolinium, the experimental conditions were set to 80 kVp, 70 μA for iodine and 90 kVp, 80 μA for gadolinium.
The phantom used in the experiment was made of polymethyl methacrylate (PMMA) as shown in Figure 4 with 6 holes filled with iodine contrast agents with different concentrations. The inner diameter of each hole is 1 mm. Concentrations of the iodine contrast agents are 0 mg I/ml, 20 mg I/ml, 25 mg I/ml, 50 mg I/ml, 75 mg I/ml, and 100 mg I/ml from right to left, respectively.
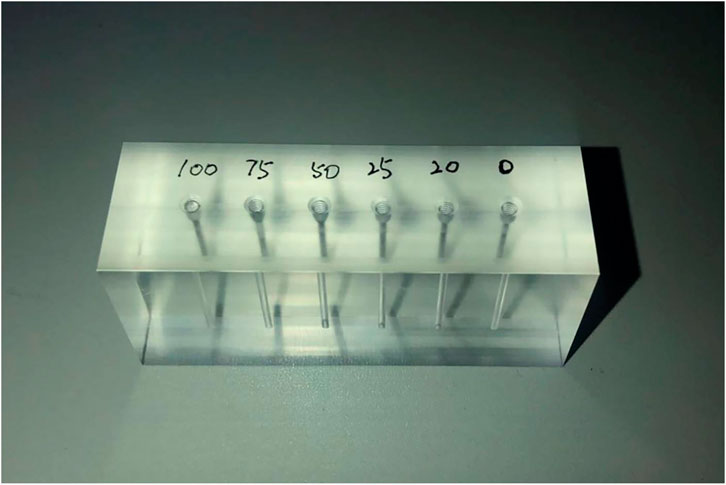
FIGURE 4. Phantom used in experiments 3.3 and 3.4.
The
To illustrate the effectiveness and the superiority of GSSM compared with TASM, a comparative experiment was designed by adding a complex background to the phantom, which is made of nylon as shown in Figure 5. The nylon strips, with a thickness of 1 mm, are used as a distraction of the iodine contrast agents in the phantom (the concentrations from right to left are 10 mg I/ml, 15 mg I/ml, 25 mg I/ml, 50 mg I/ml, 75 mg I/ml, and 100 mg I/ml, respectively). The parameters of the two experiments are the same except for the energy bins.
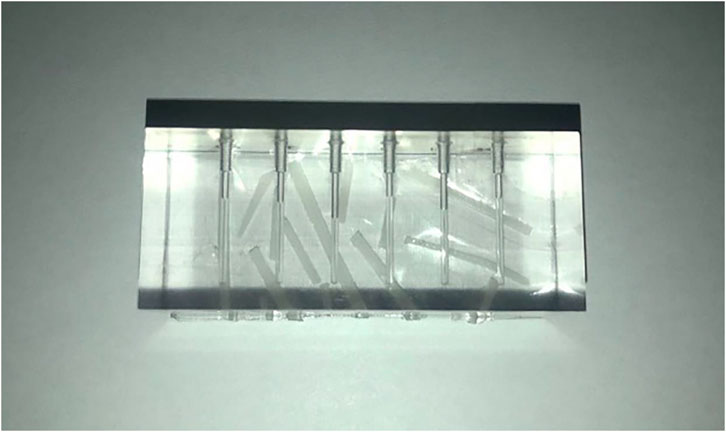
FIGURE 5. Phantom used in the comparison experiment.
The measured attenuation characteristics curves of iodine and gadolinium were mapped by threshold scanning of the detector and converted to the equivalent attenuation coefficient. The comparisons with the results of GSSM are shown in Figure 6. The energy of the K-edge extreme points of iodine and gadolinium is shown in Table 1.
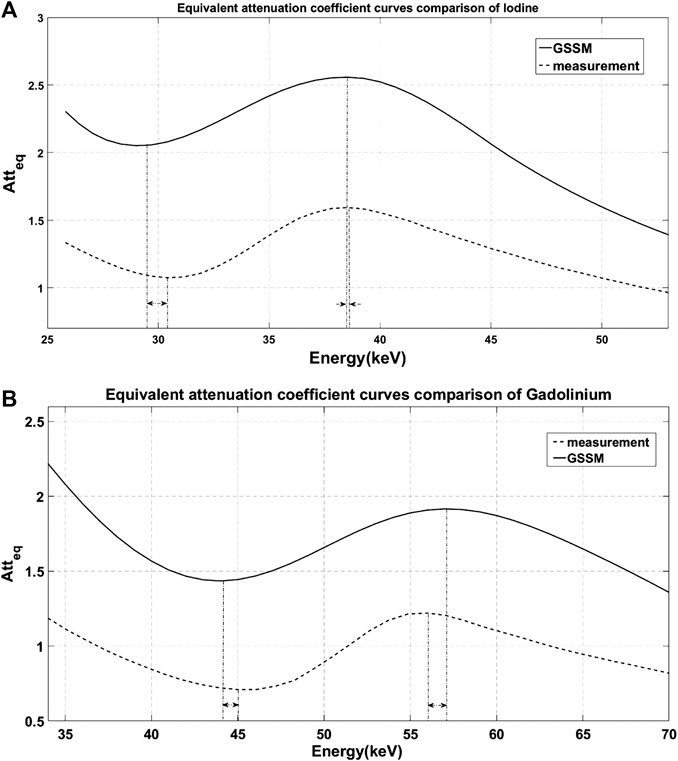
FIGURE 6. Comparison of the equivalent attenuation coefficient curves obtained by GSSM (solid line) and measurement (dashed line). The dash-dotted lines represent the energy positions of the extreme points and the arrows show the errors between GSSM and measurement: (A) iodine results and (B) gadolinium results.
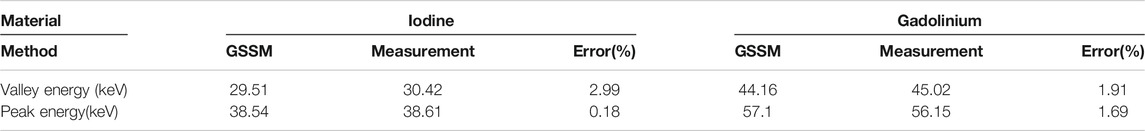
TABLE 1. The energy positions of the K-edge extreme points of iodine and gadolinium.
The results of GSSM are consistent on energy with the measured results; the errors of the extreme points are less than 3%. There is a difference in
The energy bin width used in this experiment was 10 keV. Corresponding DAR of
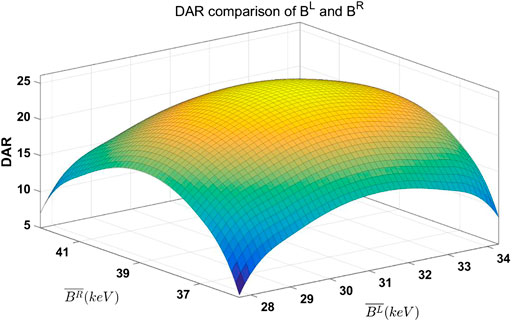
FIGURE 7. DAR comparison of
The energy bins in TASM and GSSM are listed in Table 2. The decomposition images of these two methods are shown in Figure 8. We compute contrast to noise ratio (CNR) to evaluate the image quality, as shown in
where
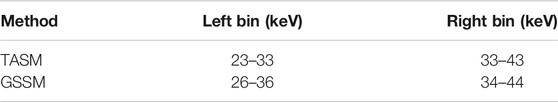
TABLE 2. The energy bins selected by TASM and GSSM.
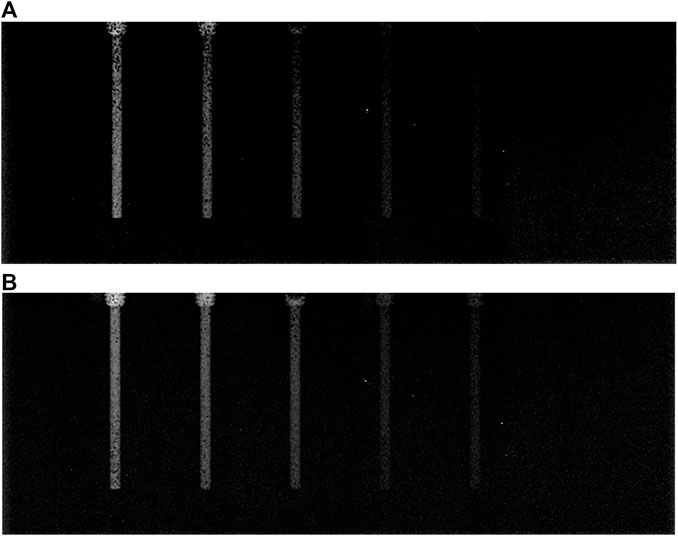
FIGURE 8. Comparison of decomposition images obtained by TASM and GSSM: (A) decomposition image of TASM, (B) decomposition image of GSSM.
In Figure 8, both of these two decomposition images can highlight the iodine areas, but GSSM has a better performance in lower iodine concentration conditions contrast agents than TASM. The CNR values of the decomposition images are shown in Table 3 and Figure 9.
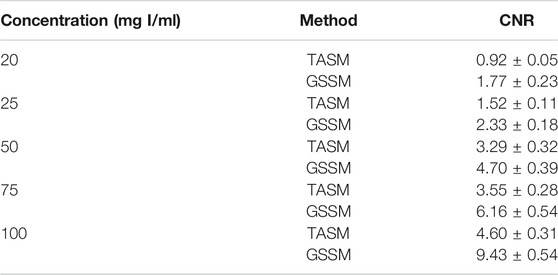
TABLE 3. CNR comparison of decomposition images of TASM and GSSM.
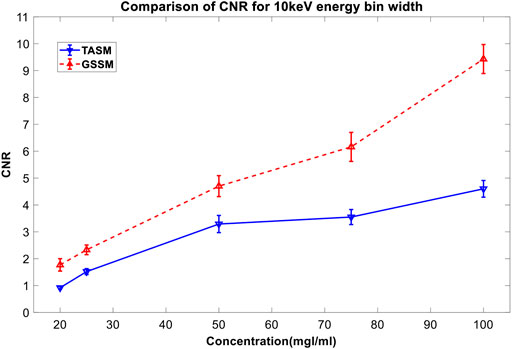
FIGURE 9. CNR comparison for different concentrations of iodine contrast agents in Figure 8. The blue line is the CNR result of TASM; the red dashed line is the CNR result of GSSM.
DAR results of
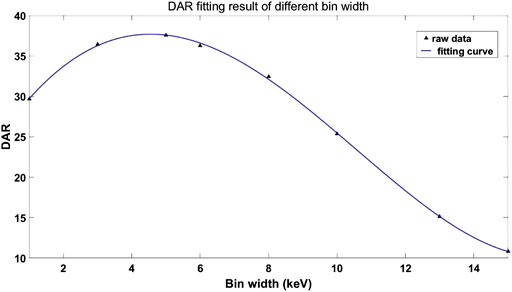
FIGURE 10. DAR results of different energy bin widths.
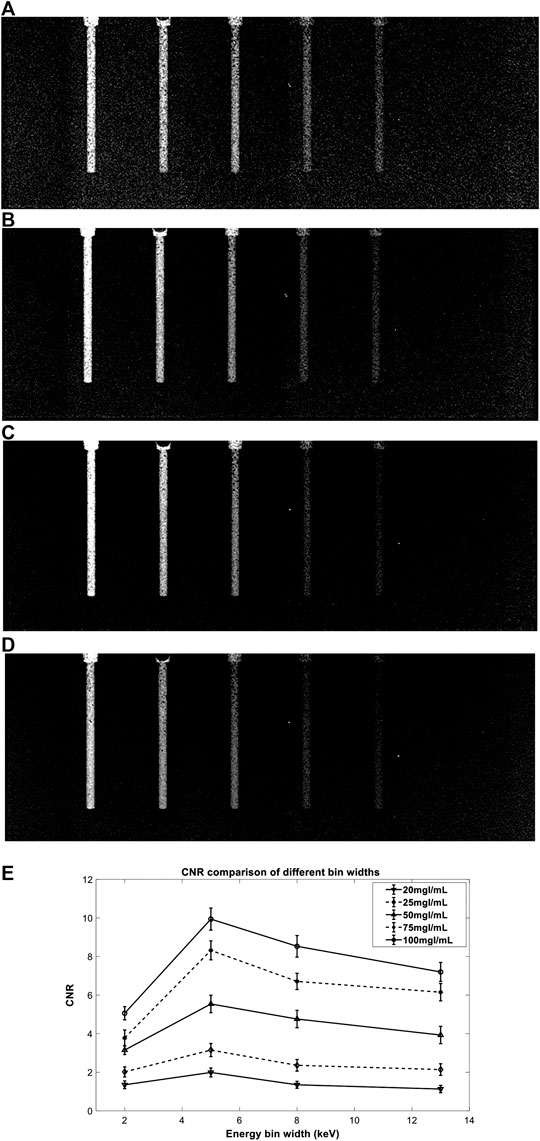
FIGURE 11. Comparison of GSSM decomposition images with different energy bin widths: (A–D) are decomposition images of 2 keV, 5 keV, 8 keV, and 13 keV, respectively; (E) shows comparison of CNR values of different concentrations (100 mg I/ml, 75 mg I/ml, 50 mg I/ml, 25 mg I/ml, and 20 mg I/ml from top to bottom) in the decomposition images.
The experimental results are in good agreement with DAR results. Small energy bin width, such as 2 keV, provides good contrast of the iodine areas but strong noise in the decomposition image (Figure 11A), while large energy bin width has a reverse effect (Figure 11D). The result shows that the 5 keV energy bin width provides the best decomposition image quality which indicates the objective function DAR is effective.
The energy bins for TASM and GSSM are listed in Table 4. The images are shown in Figures 12A–C, and the CNR quantitative comparison of the iodine areas in the decomposition images is shown in Figure 12D.
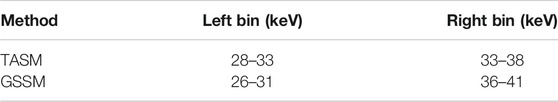
TABLE 4. The energy bins used in comparison experiment.
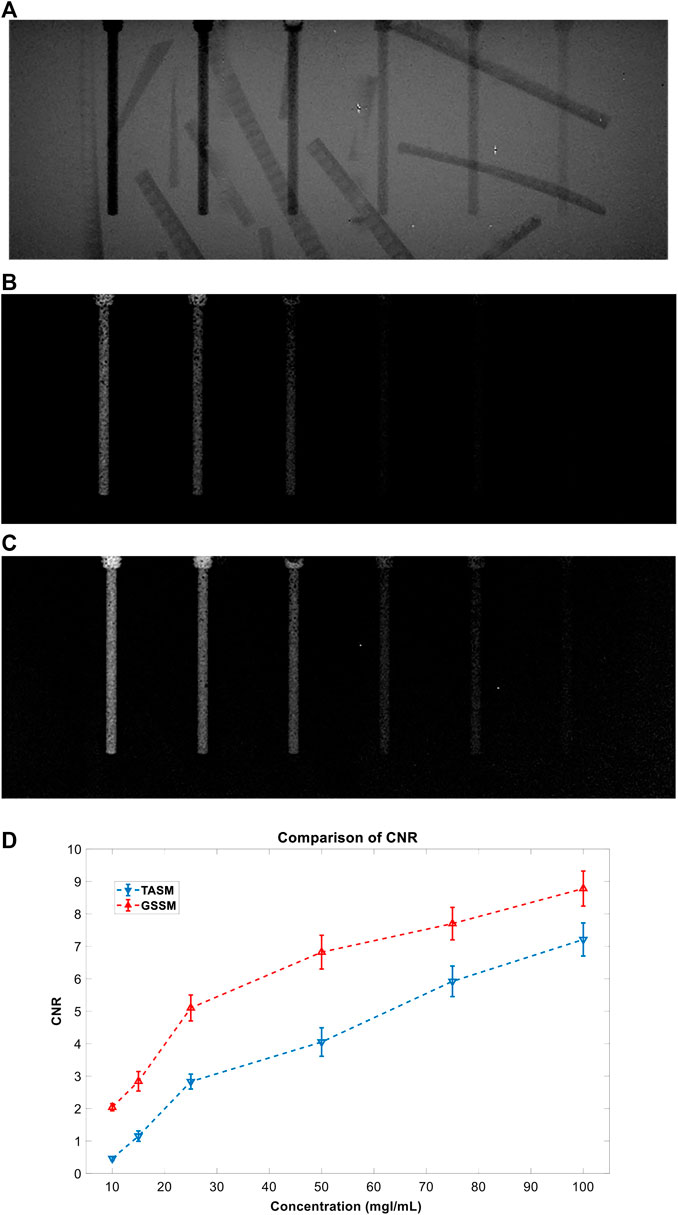
FIGURE 12. The results of comparison experiment: (A) DR image, (B) TASM decomposition image, (C) GSSM decomposition image, and (D) CNR comparison for TASM and GSSM of the comparison experiment; the blue dashed line represents TASM CNR result and the red dashed line represents GSSM CNR result.
The normal DR image (Figure 12A) cannot distinguish the iodine areas while the images acquired by TASM and GSSM (Figures 12B,C) can exclude the interference of the background very well. Figure 12D shows that the decomposition image acquired by GSSM extracts the K-edge signal of the iodine areas better than TASM. Quantitative analysis of CNR for different concentrations of iodine solution is shown in Table 5. The CNR results are improved in GSSM compared with the TASM image; this improvement is more obvious in low concentration level because the K-edge signal drops in this condition, causing a greater deviation of energy bins and quality degradation of decomposition image. The CNR of 25 mg I/ml in GSSM is equivalent to the CNR of 50 mg I/ml in TASM.
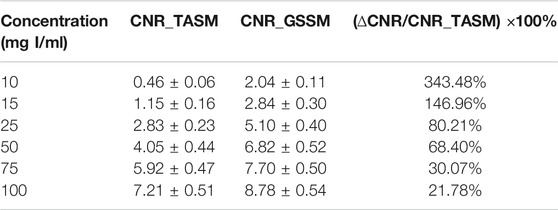
TABLE 5. Quantitative analysis of CNR for different concentrations.
This research proposes the GSSM method to optimize the extracted K-edge signal for multienergy imaging; it takes the degraded energy resolution of PCDs and the continuous x-ray spectrum into consideration. GSSM has several advantages over the traditional method. Firstly, the K-edge decomposition imaging can highlight the region of the contrast agents to get a better image quality than the ordinary DR. Secondly, GSSM is more effective than TASM in extracting the signal of K-edge, improving the quality of the decomposition images. Furthermore, GSSM can get optimized width and locations of the energy bins from the theoretical attenuation curve without the spectrum mapping process, which is more convenient for practical use. At last, due to the better performance at lower contrast agent concentration, GSSM has the potential to reduce the amount of contrast agents compared to TASM. Thus it can further improve the safety and reduce the side effect of contrast agents.
For the energy thresholds limitation of the PCD used in this study, we performed multiple scanning procedures to simulate the multienergy imaging process which can be done in a single exposure with a multithreshold PCD, such as Medipix-3 providing up to 8 energy thresholds. Besides, since the count rate of the PCD is much lower than the conventional detector, the PCD cannot be widely used at present, but it can get exciting results in some low count rate scenarios such as the breast imaging and the small animal imaging.
It should be noted that, for the material decomposition method, there are some comprehensive models considering various effects of the imaging system [39, 40]. However, as to the determination of the energy bins in K-edge decomposition imaging, a Gaussian model can get better results than the current methods; a more accurate result can be expected if the model can consider other effects of the imaging system. Besides, a difference between the heights of equivalent attenuation coefficient curves is noticed in Imaging System and its possible explanations are factors like Compton scattering and charge sharing. Therefore, specially designed correction methods could be helpful to achieve better performance. Moreover, the energy bin widths on both sides of the K-edge are equal in this preliminary result. Future study can put attention on imaging with nonequal energy bin widths.
The image contrast can be improved by using the K-edge imaging technique. This research proposes a more convenient and efficient energy bins determination method, GSSM, for extracting the K-edge signal in multienergy imaging based on the PCDs. The decomposition image acquired by GSSM has better quality than that acquired by TASM in terms of CNR. Because the improvement is especially considerable under low contrast agent concentration situation, our method has a potential to reduce the requirement of contrast agent in multienergy imaging, which could be valuable in the clinical applications.
The raw data supporting the conclusions of this article will be made available by the authors, without undue reservation.
ZZ was responsible for the method and experimental design as well as the writing of the article, JH and XZ assisted in the experiment and data processing, QX and ML provided us with software and algorithm help, and LW, CW, and ZW gave full guidance and help in the design and completion of the research.
This work is supported by the National Key R&D Program of China (Grant No. 2016YFC0100400), the Science and Technology Service Network Initiative of Chinese Academy of Sciences (Grant No. KFJ-STS-QYZD-193), the Key Technology Research and Development Team Project of Chinese Academy of Sciences (Grant No. GJJSTD20200004), and the National Natural Science Foundation of China (Grant No.11975250).
The authors declare that the research was conducted in the absence of any commercial or financial relationships that could be construed as a potential conflict of interest.
We are very grateful to Shu Yanfeng for his help in the design and production of the phantom.
This research establishes the objective function, difference of attenuation to relative standard deviation ratio (DAR), model to optimize the energy bin selection. The DAR definition is shown in
where
The attenuation characteristic A of the acquired image can be expressed as follows:
where NR is the random noise component and
The mean value and variance of A are calculated in
Relative standard deviation is used as the representation of the image's noise level, and then N is expressed as follows:
The corresponding representation of the left and the right energy bins can be expressed as in (5) and (6).
For the left bin of K-edge:
For the right bin of K-edge:
The
The final DAR is shown in
where (ρd) is the mass thickness of the sample, BL and BR are the left and the right energy bins beside the K-edge, and
1. Lewin JM, Isaacs PK, Vance V, Larke FJ. Dual-energy contrast-enhanced digital subtraction mammography: feasibility. Radiology (2003) 229:261–8. doi:10.1148/radiol.2291021276
2. Si-Mohamed S, Thivolet A, Bonnot PE, Bar-Ness D, Képénékian V, Cormode DP, et al. Improved peritoneal cavity and abdominal organ imaging using a biphasic contrast agent protocol and spectral photon counting computed tomography K-edge imaging. Invest Radiol (2018) 53 (10):629–39. doi:10.1097/RLI.0000000000000483
3. Zhang L, Zhou C, Schoepf U, Sheng H, Wu S, Krazinski A, et al. Dual-energy CT lung ventilation/perfusion imaging for diagnosing pulmonary embolism. Eur Radiol (2013) 23 (10):2666–75. doi:10.1007/s00330-013-2907-x
4. Badea C, Johnston S, Qi Y, Ghaghada K, Johnson G. Dual-energy micro-CT imaging for differentiation of iodine- and gold-based nanoparticles. Proc SPIE (2011) 7961:79611X. doi:10.1117/12.878043
5. Achenbach S, Anders K, Kalender WA. Dual-source cardiac computed tomography: image quality and dose considerations. Eur Radiol (2008) 18:1188–98. doi:10.1007/s00330-008-0883-3
6. Panetta D. Advances in X-ray detectors for clinical and preclinical Computed Tomography[J]. Nucl Instrum Methods Phys Res Sect A Accel Spectrom Detect Assoc Equip (2016) 809: 2–12. doi:10.1016/j.nima.2015.10.034
7. Maturen KE, Kleaveland PA, Kaza RK, Liu PS, Quint LE, Khalatbari SH, et al. Aortic endograft surveillance: use of fast-switch kVp dual-energy computed tomography with virtual noncontrast imaging. J Comput Assist Tomogr (2011) 35: 742–6. doi:10.1097/RCT.0b013e3182372c14
8. Goo HW, Goo JM. Dual-energy CT: new horizon in medical imaging. Korean J Radiol (2017) 18:555–69. doi:10.3348/kjr.2017.18.4.555
9. Wang X, Meier D, Taguchi K, Wagenaar DJ, Patt BE, Frey EC. Material separation in x-ray CT with energy resolved photon-counting detectors. Med Phys (2011) 38 (3):1534–46. doi:10.1118/1.3553401
10. Schlomka JP, Roessl E, Dorscheid R, Dill S, Martens G, Istel T, et al. Experimental feasibility of multi-energy photon-counting K-edge imaging in pre-clinical computed tomography. Phys Med Biol (2008) 53 (15):4031–47. doi:10.1088/0031-9155/53/15/002
11. Taguchi K, Iwanczyk JS. Vision 20/20: single photon counting x-ray detectors in medical imaging. Med Phys (2013) 40(10):100901. doi:10.1118/1.4820371
12. Schmitzberger FF, Fallenberg EM, Lawaczeck R, Hemmendorff M, Moa E, Danielsson M, et al. Development of low-dose photon-counting contrast-enhanced tomosynthesis with spectral imaging. Radiology (2011) 259:558–64. doi:10.1148/radiol.11101682
13. Roessl E, Proksa R, K-edge imaging in x-ray computed tomography using multi-bin photon counting detectors. Phys Med Biol (2007) 52:4679–96. doi:10.1088/0031-9155/52/15/020
14. Shikhaliev PM. Photon counting spectral CT: improved material decomposition with K-edge-filtered x-rays. Phys Med Biol (2012) 57(6):1595. doi:10.1088/0031-9155/57/6/1595
15. Cunningham IA, Westmore MS, Fenster A. A spatial-frequency dependent quantum accounting diagram and detective quantum efficiency model of signal and noise propagation in cascaded imaging systems. Med Phys (1994) 21:417–27. doi:10.1118/1.597401
16. Anderson NG, Butler AP, Scott NJ, Cook NJ, Butzer JS, Schleich N, et al. Spectroscopic (multi-energy) CT distinguishes iodine and barium contrast material in MICE. Eur Radiol (2010) 20:2126–34. doi:10.1007/s00330-010-1768-9
17. Liang L, Li R, Zhang S, Chen Z. Simultaneous X-ray fluorescence and K-edge CT imaging with photo-counting detectors. Proc SPIE (2016) 9967:99670F. doi:10.1117/12.2238528
18. Ge Y, Zhang R, Li K, Chen GH. K-edge energy-based calibration method for photon counting detectors. Phys Med Biol (2018) 63:015022. doi:10.1088/1361-6560/aa9637
19. Sossin A, Rebuffel V, Tabary J, Létang JM, Freud N, Verger L, et al. “Influence of scattering on material quantification using multi-energy x-ray imaging,” in 2014 IEEE Nuclear Science Symposium and Medical Imaging Conference (NSS/MIC), Seattle, WA, November 8–15, 2014 (IEEE) (2014).
20. Kim JC, Anderson SE, Kaye W, Zhang F, Zhu Y, Kaye SJ, et al. Charge sharing in common-grid pixelated CdZnTe detectors. Nucl Instrum Methods Phys Res (2010) 654 (1):233–43. doi:10.1016/j.nima.2011.06.038
21. Wang AS, Harrison D, Lobastov V, Tkaczyk JE. Pulse pileup statistics for energy discriminating photon counting x-ray detectors. Med Phys (2011) 38:4265–75. doi:10.1118/1.3592932
22. Shikhaliev PM, Fritz SG, Chapman JW. Photon counting multienergy x-ray imaging: effect of the characteristic x rays on detector performance. Med Phys (2009) 36:5107. doi:10.1118/1.3245875
23. Taguchi K, Frey EC, Wang X, Iwanczyk JS, Barber WC. An analytical model of the effects of pulse pileup on the energy spectrum recorded by energy resolved photon counting x-ray detectors. Med Phys (2010) 37:3957–69. doi:10.1118/1.3429056
24. Lee Y, Lee AC, Kim H. A Monte Carlo simulation study of an improved K-edge log-subtraction x-ray imaging using a photon counting CdTe detector. Nucl Instrum Methods Phys Res (2016) 830:381–90. doi:10.1016/j.nima.2016.06.024
25. Pani S, Saifuddin S, Ferreira FIM, Henthorn N, Seller P, Sellin PJ, et al. High energy resolution hyperspectral X-ray imaging for low-dose contrast-enhanced digital mammography. IEEE Trans Med Imaging (2017) 36:1784–95. doi:10.1109/TMI.2017.2706065
26. Pani S, Saifuddin S, Ferreira F, Scuffham J, Stratmann P, Wilson M, et al. “Optimization of K-edge subtraction imaging using a pixellated spectroscopic detector,” in Nuclear Science Symposium and Medical imaging Conference, Anaheim, CA, October 3, 2012 (IEEE), 3063–6 (2012)
27. Feng M, Xu J, Treb K, Zhang R, Chen G-H, Li K. Spectrum optimization in photon counting detector based iodine K-edge CT imaging. Proc Medical imaging 2019: Physics of Medical imaging (2019) 10948:109481C. doi:10.1117/12.2512893
28. Ding H, Molloi S. Image-based spectral distortion correction for photon-counting x-ray detectors. Med Phys (2012) 39:1864–76. doi:10.1118/1.3693056
29. He P, Wei B, Cong W, Wang G. Optimization of K-edge imaging with spectral CT. Med Phys (2012) 39:6572. doi:10.1118/1.4754587
30. Meng B, Cong W, Xi Y, De Man B, Wang G. Energy window optimization for X-ray K-edge tomographic imaging. IEEE Trans Biomed Eng (2016) 63:1623–30. doi:10.1109/TBME.2015.2413816
31. Lee SW, Choi YN, Cho HM, Lee YJ, Ryu HJ, Kim HJ. A Monte Carlo simulation study of the effect of energy windows in computed tomography images based on an energy-resolved photon counting detector. Phys Med Biol (2012) 57:4931–49. doi:10.1088/0031-9155/57/15/4931
32. Roessl E, Brendel B, Engel KJ, Schlomka JP, Thran A, Proksa R, Sensitivity of photon-counting based K-edge imaging in X-ray computed tomography. IEEE Trans Med Imaging (2011) 30 (9):1678–90. doi:10.1109/TMI.2011.2142188
33. Hubbell JH, Seltzer SM. Tables of x-ray mass attenuation coefficients and mass-energy absorption coefficients 1 keV to 20 meV for elements z = 1 to 92 and 48 additional substances of dosimetric interest. Gaithersburg, MD: National Institute of Standards and Technology (1995). Available from: http://physics.nist.gov/pml/data/xraycoef/index.cfm.
34. Poludniowski G, Landry G, DeBlois F, Evans PM, Verhaegen F. SpekCalc: a program to calculate photon spectra from tungsten anode x-ray tubes. Phys Med Biol (2009) 54(19): N433–8. doi:10.1088/0031-9155/54/19/N01
35. Chen SC, Jong WL, Harun AZ Evaluation of X-ray beam quality based on measurements and estimations using SpekCalc and Ipem78 models. Malays J Med Sci (2012) 19(3):22–8.
36. Kalluri KS, Mahd M, Glick SJ. Investigation of energy weighting using an energy discriminating photon counting detector for breast CT. Med Phys (2013) 40:081923. doi:10.1118/1.4813901
37. Cheng Z, Li M, Xu Q, Zhang Z, Hu J, Wei C, et al. Improved projection-based energy weighting for spectral CT. Radiation Detection Technology and Methods (2019) 3:28. doi:10.1007/s41605-019-0106-2
38. Li ZH, Yun MK, Jiang XP, Zhang ZD, Cheng ZW, Wei CF, et al. Energy calibration method of the photon counting detector based on continuous x-ray spectrum[J]. CT Theory and Applications (2018) 27(3):363–72. doi:10.15953/j.1004-4140.2018.27.03.09
39. Ehn S, Sellerer T, Mechlem K, Fehringer A, Epple M, Herzen Jet al. Basis material decomposition in spectral CT using a semi-empirical, polychromatic adaption of the Beer–Lambert model [J]. Phys Med Biol (2017) 62 (1):N1–17. doi:10.1088/1361-6560/aa4e5c
Keywords: multienergy imaging, photon counting detector, K-edge decomposition imaging, K-edge signal, energy bins
Citation: Zhang Z, Zhang X, Hu J, Xu Q, Li M, Wei C, Wei L and Wang Z (2021) An Optimized K-Edge Signal Extraction Method for K-Edge Decomposition Imaging Using a Photon Counting Detector. Front. Phys. 8:601623. doi: 10.3389/fphy.2020.601623
Received: 01 September 2020; Accepted: 30 November 2020;
Published: 08 February 2021.
Edited by:
Liang Li, Tsinghua University, ChinaReviewed by:
Stefan Sawall, German Cancer Research Center (DKFZ), GermanyCopyright © 2021 Zhang, Zhang, Hu, Xu, Li, Wei, Wei and Wang. This is an open-access article distributed under the terms of the Creative Commons Attribution License (CC BY). The use, distribution or reproduction in other forums is permitted, provided the original author(s) and the copyright owner(s) are credited and that the original publication in this journal is cited, in accordance with accepted academic practice. No use, distribution or reproduction is permitted which does not comply with these terms.
*Correspondence: Zhe Wang, d2FuZ3poZUBpaGVwLmFjLmNu
Disclaimer: All claims expressed in this article are solely those of the authors and do not necessarily represent those of their affiliated organizations, or those of the publisher, the editors and the reviewers. Any product that may be evaluated in this article or claim that may be made by its manufacturer is not guaranteed or endorsed by the publisher.
Research integrity at Frontiers
Learn more about the work of our research integrity team to safeguard the quality of each article we publish.