- 1School of Resources and Safety Engineering, Central South University, Changsha, China
- 2Key Laboratory of Mining Disaster Prevention and Control, Qingdao, China
The dynamic tensile failure of rock is a main failure mode in deep underground engineering projects. The microscopic failure mechanism analysis of this failure mode plays a key role in dynamic disaster warning. Moment tensor inversion is a very well-known method used to analyze failure mechanisms. However, an acoustic emission (AE) event cannot be accurately distinguished in rock dynamic experiments at the laboratory scale, because there are hundreds of AE events generated within a few hundred microseconds in one dynamic test. Therefore, moment tensor analysis is rarely applied in rock dynamic tests with laboratory scale. In this paper, AE and moment tensor simulations with the discrete element method (DEM) are introduced to analyze the microscopic failure mechanism of rock under a dynamic Brazilian test. Comparing the simulation results of AE and moment tensor analysis with the simulation results of micro-crack with DEM, the moment tensor discriminant method can obtain the mechanical mechanism and energy level of micro-cracks. Furthermore, R, which is the ratio of isotropic and deviatoric components of the moment tensor, is used to analyze the AE source mechanism. The implosion, shear, and tensile of the AE source mechanism can better explain the evolution process of main axial crack and the shear failure zones of the Brazilian disc specimen under dynamic tensile simulation. These findings contribute to a better understanding of the microscopic failure mechanism of rock under a dynamic tensile test than the statistical types of micro-cracks based on break bonds with DEM.
Introduction
Dynamic tensile failure is a main mode of rock failure in deep underground engineering projects [1, 2]. The microscopic failure mechanism of this failure mode is vital for dynamic disaster warning. It is important and necessary to study the micromechanical mechanism of rock dynamic tensile failure [3]. Moment tensor inversion is a very well-known method used to analyze failure mechanisms [4, 5]. However, an acoustic emission (AE) event cannot be accurately distinguished in rock dynamic experiments at laboratory scale. The sampling rate of AE or micro-seismic monitoring equipment is about 10 MHz. The time of one rock dynamic experiment with SHPB is about 250 µs [6]. There are hundreds of AE events generated in one rock dynamic test. Therefore, moment tensor analysis is rarely applied in rock dynamic tests with laboratory scale. DEM simulation is also widely used to study failure mechanisms [7, 8]. The bond between particles break and many broken bonds will lead to rock failure when the rock specimen is under force action in simulation, which is often used to analyze the meso-crack extension [9]. The type statistics of bond break is used to distinguish the rock dynamic failure type [10]. However, the rock dynamic experiment and simulation studies show that the micro-crack of rock materials is mainly of the tensile crack variety no matter what the macroscopic failure mode is [11]. Therefore, a wrong result may be found if the macroscopic failure pattern is directly judged by statistical micro-crack types [12].
Some scholars introduced AE simulation based on DEM. Then the theory of AE can be used to analyze the micromechanical steps of the rock failure process with simulation. Hazzard and Young defined the range of bond break interplay between each other according to the crack propagation speed, and recorded the kinetic energy release in the process of intergranular bond fracture. In a closely packed particle assembly, this kinetic energy manifests itself as a seismic wave that propagates out from the location of the bond breakage, similar to an AE in real rocks. This method was then used to simulate the AE source in the process of a granite compression experiment [13]. On the basis of these studies, Hazzard and Young proposed a method to simulate a moment tensor with DEM. Then it was used to simulate the AE and moment tensor analysis of the tunnel excavation process. Comparing with the actual monitoring results, it was found that the model generated many implosion events agreeing partially with the actual recorded seismicity [14]. Cai et al. established a coupled numerical method with the finite element method (FEM) and DEM to simulation AE at the Kannagawa underground powerhouse cavern in Japan [15]. Lisjak et al. used two-dimensional FEM–DEM coupling analysis to simulate the AE in brittle rocks [16]. Zhang and Zhang built a rock model with two prefabricated cracks by PFC. Then the moment tensor was simulated to analyze the compression failure process of this model. This study analyzed the crack generation mechanism by using the moment tensor solutions and the statistic of the types of bond break contained in an AE event. It was discovered that the main bond break model of an AE event is tensile, while the AE mechanism is compression [17]. Zhang and Zhang used the moment tensor to distinguish the nature of primary cracks and secondary cracks in a single flaw-contained specimen based on the bonded-particle model [12, 18].
Previous studies mentioned above show that AE source simulation and moment tensor analysis have great advantages in studying rock fracture mechanisms. In this paper, we introduce this method of AE and moment tensor simulation based on PFC to analyze the micromechanical mechanism of the rock dynamic tensile failure process. Firstly, the model of SHPB for dynamic Brazil splits is established. Then, we introduce the theory of AE definition and moment tensor. Finally, the microscopic mechanism of macroscopic tensile crack generated in the middle and the shear zone at both ends of the Brazilian disk during the dynamic tensile failure process are analyzed by using the simulation results of AE and moment tensor.
Modeling Approach
Brief Description of Discrete Element Method
DEM was first proposed by Cundall in the 1970s [19, 20]. After years of development, it is now widely used in different fields. As a mature commercial software of DEM, PFC is often used to study the micro-fracture process of rock mass in the field of rock mechanics.
In PFC, the numerical models are respectively composed of particles with a certain density bonded by the contact. The particles are disks with a certain thickness in PFC2D. And in PFC3D, the particles are small spheres. Each particle can be translated and rotated, and the interaction between particles is simulated through contact. Particles only interact with neighboring particles. The relative displacement between particles is the basic variable, and its motion follows the classical motion equation. When a particle is subjected to an external force or constraint, it will generate forces and torques acting on neighboring particles. The acceleration of related particles can be obtained from Newton's second law. The velocity and displacement of particles and other parameters can be obtained through the time integral. The physical quantities of acceleration, velocity, displacement, and rotation angle of all particles at any time can be obtained through the repeated iterative cycle of time step.
The Model of Split Hopkinson Pressure Bar for Dynamic Tension
The model of SHPB for the dynamic tension test, established in this paper, consists of two materials. One is the SHPB bar and the other is the rock specimen. There are two methods to simulate the bars of SHPB using PFC, one is generated by an extrusion exclusion method. Firstly, particles are generated randomly in the area of the bars according to the set porosity and particle radius. Then the repulsive force is generated between the particles through repeated cycle calculation, and the randomly generated overlapping particles enter a state of close contact with each other under the action of repulsive force [21]. Another method is the regular arrangement method, which can be realized by generating the particles with same radius, orderly distributed in the bar region. Studies have shown that the bars generated by the regular arrangement method can greatly improve the generation speed. The stress wave propagates in the bar constituted of regularly arranged particles without attenuation and dispersion [22]. Therefore, we use the regular arrangement method to generate the incident bar and transmission bar in our paper. The contact model of the particles in the bars is a linear contact bond. The incident and transmitted bars are 1,250 and 750 mm long, respectively, with a diameter of 50 mm.
The specimen in this model is generated by the extrusion exclusion method. The particles are randomly generated with specified porosity and radius in the specimen region. Then the repulsion force is generated between the originally overlapped particles through cyclic calculation, and finally the particle model with close contact is generated. The contact model of the particles in the specimen is a linear parallel bond. The model of SHPB for the dynamic tensile simulation is shown in Figure 1. The stress wave (Figure 1A) is loaded on the left end of the incident bar. Five measure circles (Figure 1B) are embedded in the incident and transmitted bars. Figure 1C contains the details of the specimen sandwiched between the incident and transmitted bars.
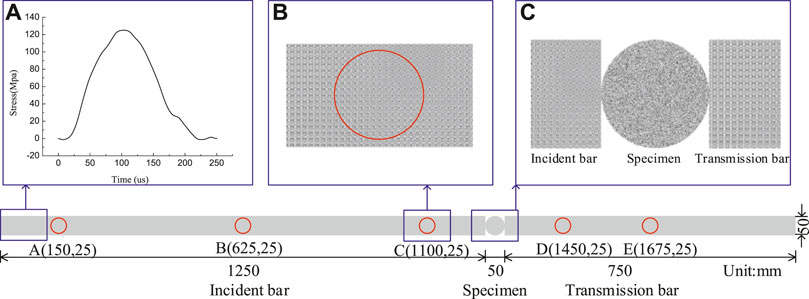
FIGURE 1. The model of SHPB for dynamic tensile simulation. (A) The incident stress wave in simulation and experiment; (B) measure circles on the bars of this model; (C) the details of the specimen sandwiched between the incident and transmitted bars.
Microscopic Parameter Determined in the Simulation
To obtain microscopic parameters in the simulation, the dynamic tensile experiment of red sandstone is carried out using SHPB. SHPB, oscilloscope, and HS photography were used in this experiment as shown in Figure 2. The improved SHPB consists of a gas gun, a cone-shaped striker, an incident bar, a transmission bar, an absorption bar, and a momentum trap. All of the bars and the striker are made up of high strength 40 cr alloy with an elastic modulus of 233 GPa, a density of 7,670 kg/m3, a P wave velocity of 5,462 m/s, and a yield strength of 800 MPa [23].
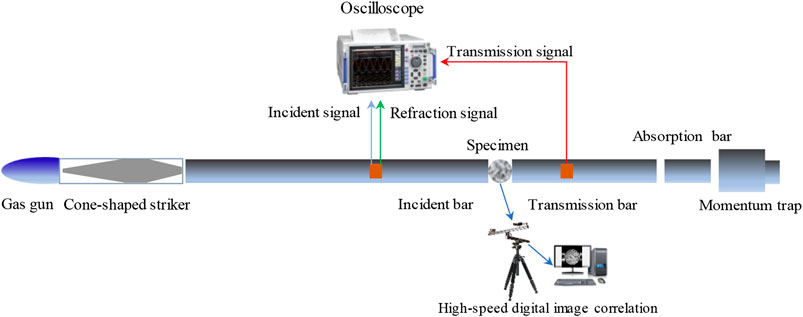
FIGURE 2. SHPB, oscilloscope, and high-speed digital image correlation used in the rock dynamic tensile experiment.
We use HS photography to obtain pictures during the failure process of the rock dynamic tensile test. The HS camera captured pictures in this experiment at a frequency of 79,161 frames/s with a resolution of 256 × 256 pixels. The HS camera uses an external trigger to start capturing images. When the voltage of strain gauge on the incident bar rises to −34 mv, the oscilloscope and HS camera are simultaneously triggered to ensure time consistency. The specimen used in this experiment is red sandstone with a radius of 50 mm and a height of 30 mm.
During the dynamic test, a longitudinal compressive wave (incident wave) is generated by the impact of a cone-shaped striker bar on the free end of the incident bar. Then this compressive wave (incident wave) propagates in the incident bar. When the compressive incident wave reaches the interfaces of bars and specimen, it is partly reflected (reflected wave), and the remainder passes through the rock specimen to the transmitted bar (transmitted wave). These three elastic stress pulses in the incident and transmitted bars are recorded with the strain gauges and denoted as the input strain pulse I(t), reflected strain pulse R(t), and transmitted strain pulse T(t), respectively [24]. The waveform data recorded by the oscilloscope are processed based on one dimensional stress wave theory [25, 26]. The results of incident stress wave, reflected stress wave, and transmitted stress wave are shown in Figure 3. The superposed waveform of the incident wave and the reflected wave is substantially the same as the transmitted wave near the peak, which verifies that this experiment satisfies the dynamic force balance.
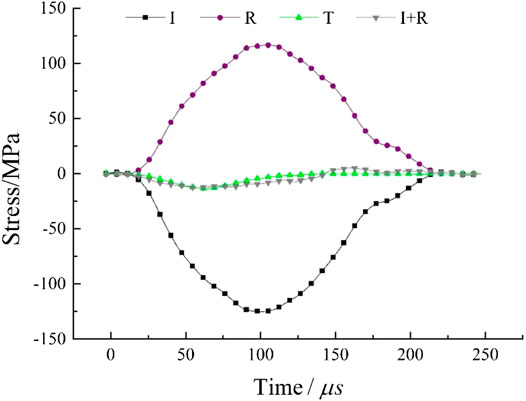
FIGURE 3. Incident (I), reflected (R), transmitted (T), and incident + reflected (I + R) stress wave of the dynamic tensile experiment.
We use the data of the incident wave in the dynamic test as the incident wave in the simulation. By adjusting the mesoscopic parameters in the simulation, the measured reflected wave and projected wave in the simulation are basically consistent with the experimental results, which ensures that the simulated dynamic tensile strength curve of red sandstone is basically consistent with the experimental results. The comparison results of the simulation and experimental waveforms are shown in Figure 4.
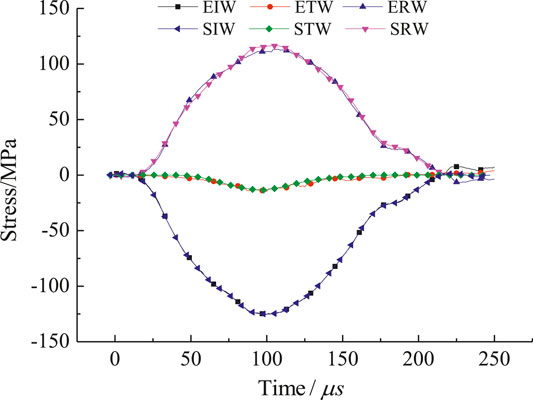
FIGURE 4. The comparison of waveforms in experiment and simulation. The experimental incident wave (EIW) and the simulated incident wave (SIW) are identical. The experimental reflected wave (ERW) and the simulated reflected wave (SRW) as well as the experimental transmitted wave (ETW) and the simulated transmitted wave (STW) are also substantially similar.
The microscopic and macroscopic parameters of the bars are shown in Table 1. The Young’s modulus and density of the model corresponds to the experiment. The bond strength of the bar in this model is set extremely large to ensure that the bars will not deform during the impact process.
The specimen in this model is calibrated according to the dynamic tensile results of sandstone. The microscopic and macroscopic parameters of the specimen are shown in Table 2.
Acoustic Emission Definition in Dynamic Tensile Simulation
Studies have shown that, the bond break between contacted particles can simulate the micro-cracks in the simulation of rock with DEM [27]. Based on this, Young proposed that the break of a bond between particles can be used to simulate AE [8, 9]. When bonds break, energy is released and AE locations and magnitudes can be calculated. Therefore, bonded particle models provide a unique method to simulate AE [28]. Based on this, the AE definition in the dynamic tensile simulation will be introduced in this section.
When the incident wave propagates from the incident bar to the specimen, the bonds in the specimen begin to break under the action of the stress wave. This bond break is marked as the beginning of an AE. If each bond break is considered as an AE event, then the magnitudes of these AE events will be similar. This is not conformed to power-law distribution which is already a law of magnitude distribution recognized in seismology [29]. According to the characteristics of AE in rock mechanic experiments, bond breaks occurring close together in space and time are regarded as the same AE event in the simulation. This is similar with the actual AE monitoring, which distinguishes different AE events by setting peak definition time (PDT), hit definition time (HDT), and hit lockout time (HLT) of the AE signal. In the simulation, an AE event is determined by monitoring the bond break. The continuing AE event is determined by the number of calculating steps, which is 40 steps in this simulation. The restriction of an AE event calculating steps is verified by Hazzard and Damjanac [16]. The maximum area of an AE event is defined as 6 times the average particle radius. Figure 5 is an AE event generation process in the dynamic tensile simulation. Figure 5A is the beginning state of this AE event. Figure 5B is the end state of this AE event.
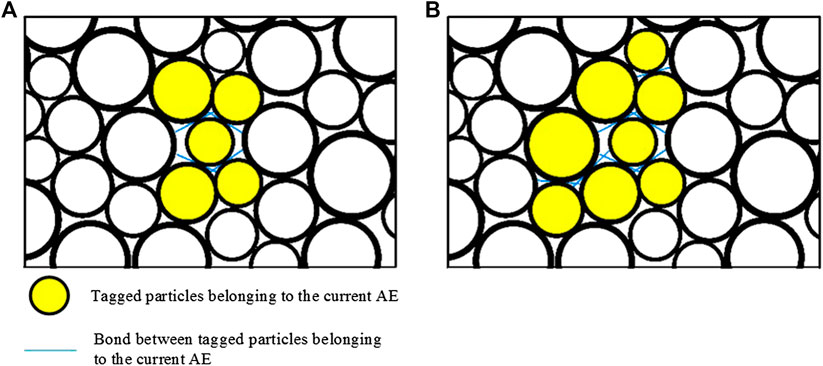
FIGURE 5. An AE event generation process in this simulation. (A) is the start of an event and (B) is the finish state of this event.
The magnitude of AE is an important parameter for AE evaluation. In the PFC simulation, AE energy is calculated by the differences of strain energy before and after the AE event generation [30]. The strain energy can be expressed as:
where Fn and Fs are normal and shear forces of contact; kn and ks are contact normal stiffness and contact shear stiffness.
For each calculation step, the strain energy of all particles in the AE region, Ek, is calculated, as:
where
And the AE energy, ∆Ek, is equal to the final strain energy,
then the magnitude can be expressed as [31]:
Moment Tensor Calculation in the Dynamic Tensile Simulation
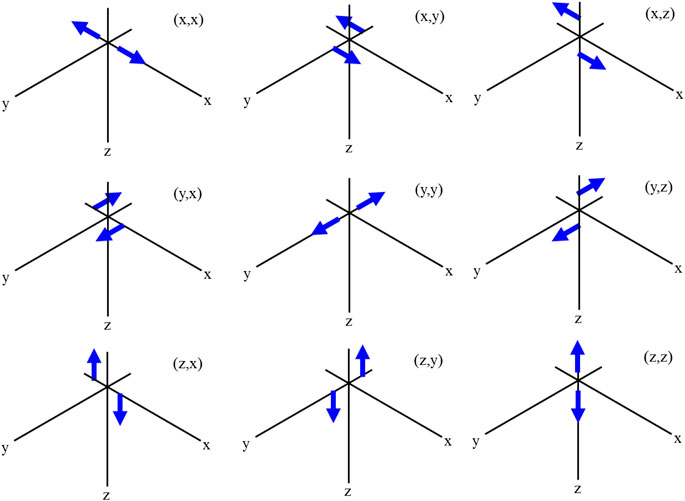
In seismology, a moment tensor is a mathematical representation of the movement on a fault during an earthquake, comprising nine generalized couples, or nine sets of two vectors [32]. They are described in Figure 6. The tensor depends of the source strength and fault orientation.
In 2D, it can be expression as follows:
PFC simulation can directly obtain the force state and displacement of all particles under the external force of the model. In 2D, the contact force vector and the displacement vector between the contact point and the centroid of an AE event has components in two directions [14]. Then the moment tensor can be obtained based on the definition of AE in simulation. The detailed calculation process of a moment tensor is shown below:
where
Figure 7 is the example of an AE event and its moment tensor. The contact forces of this AE event are shown in Figure 7A. The four Gy particles in the middle represent an AE event. The red arrows indicate the contact forces on the particles of this AE event. The value and action point of these contact forces can be directly obtained from the PFC simulation. Then the moment tensor can be calculated by Eqs (5) and (6). The length of these two lines in Figure 7B represents the principle eigenvalues and eigenvectors of the matrix.
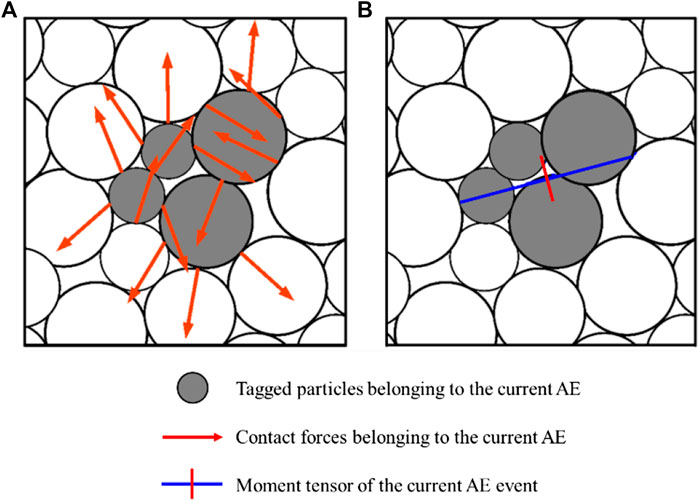
FIGURE 7. The example of an AE event and its calculation moment tensor. (A) The contact force of all particles in an AE event. (B) The calculated moment tensor of this event. The length of these two lines represent the principal values of the moment tensor. The red line represents tensile and the blue line represents compression.
Results of Acoustic Emission and Moment Tensor Simulation During the Dynamic Tension Failure of Rock
The rock dynamic tensile failure process is simulated by the SHPB model as established in the previous section. The AE and moment tensor of this failure process are calculated. The results of the moment tensor simulation and AE source mechanism are used to analyze the micro-mechanical mechanism of the rock dynamic tensile process. Studies show that the dynamic tensile process can be divided into two parts for analysis. One part analyzes the micro-mechanical mechanism of the main axial crack which is parallel to the impact direction and divides the specimen into two pieces. The other part analyzes the micro-mechanical mechanism of the shear failure zones that occur at the contact points of the Brazilian disk (BD) specimen [33]. These two parts will be analyzed separately in the following part.
Acoustic Emission and Moment Tensor of the Main Axial Crack Parallel to the Impact Direction
Figure 8 is the results of the AE and moment tensor before and after the axial macro-crack generated in the rock dynamic tensile simulation. Figure 8A shows the AE events as expressed by marked particles. Figure 8B is the normalized AE location of the left picture. Each AE event is expressed with a circle. The center of the circle is the barycenter of this AE event, and the radius is the value of the normalized AE event energy magnitude. Therefore, the middle picture can intuitively show the position and magnitude of each AE event. Figure 8C shows the results of the moment tensor simulation. The position of each moment tensor is the barycentric coordinates of an AE event. Figure 8D shows the results of HS photography.
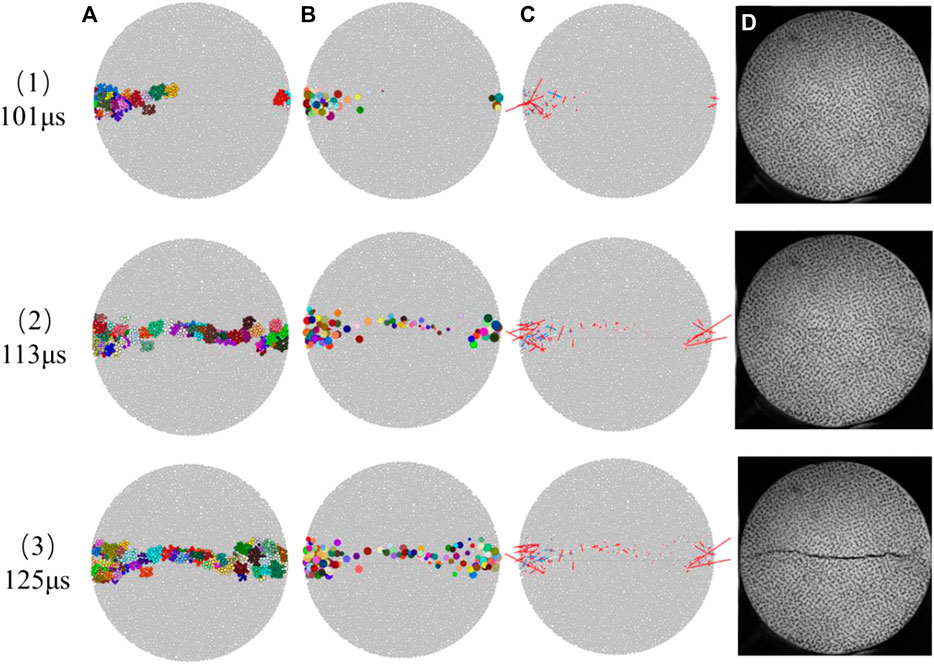
FIGURE 8. The results of AE location, moment tensor in simulation, and HS photography before and after the axial macro-crack generated. (A) is the AE location at different moments; (B) is the AE normalization diagram with the initial generating position of each AE event as the center of the circle and the AE energy level value as the radius; (C) is the results of the moment tensor; (D) is the results of high speed photographs in the dynamic tensile experiment.
Figures 8(1)–(3) are the results of the simulation and HS photography at 101 µs, 113 µs, and 125 µs, respectively. At 101 µs, the AE events distribute mainly in the two ends of the specimen, the cumulative number of these AE events is 76 with a magnitude range of −4.3 to −0.76. There is no macro-crack formation in the experiment from the results of the HS photographic image. Figure 8(2)B shows that most of these AE events are generated at middle of the specimen. The cumulative number of AE events is 116. The number of new AE events generated in this period is 40 with a magnitude range of −2.11 to −0.75. Figure 8(2)C shows the moment tensor of each AE event. Figure 8(2)D shows a macroscopic crack initiation at the middle of the specimen HS photographic image. At 125 µs, there are 41 new AE events generated with a magnitude range of −2.84 to −1.59. In the meantime, this initiation crack from the initiation position extends to the ends of the specimen in the experiment. From the results of the AE location and HS photography of these three stages, it can be found that macroscopic cracks occur only when the number of AE is enough or the AE magnitude reaches a certain value.
Acoustic Emission and Moment Tensor of the Shear Failure Zones
Studies show that there are shear failure zones that occur at the contact points of the BD specimen, which become more significant with an increase of loading rate, in the dynamic tensile experiment. The shear failure zone is a result of secondary fractures due to further compression between the bar and the cracked disc as demonstrated by the high-speed camera snapshots. In this section, the simulation results of the AE and moment tensor are used to analyze the generation process of the shear failure zones.
Figure 9 expresses the shear failure zones formation. Figures 9(1)–(3) show this new crack initiation, extension, and formation at 149 µs, 161 µs, and 173 µs, respectively. At 149, the new AE event generated at the ends of the specimen coincides with the results of the HS photographic image. There are 48 new AE events with a magnitude ranging from −3.25 to −1.08. At 161 µs, most of the new AE events continue to expand along the direction of the crack formed in the previous period. There are 23 new AE events with a magnitude of −2.6 to −1.27 in this period. The number of new AE events generated from 161 to 173 µs is 16 and the magnitude ranges from −2.14 to −0.89.
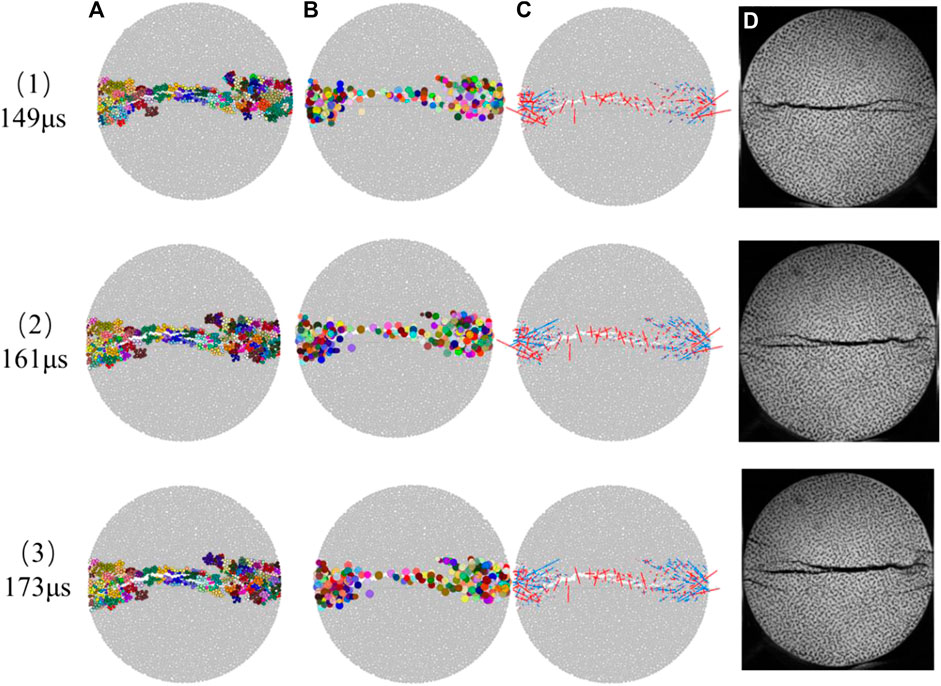
FIGURE 9. The results of AE location, moment tensor in simulation, and HS photography before and after the shear failure zones. (A)–(D) of Figure 9 correspond to the same figure values as Figure 8.
From the crack development process of the HS photography results and the corresponding AE simulation results in Figures 8 and 9, it can be concluded that the AE simulation in the rock dynamic tensile experiment is feasible. The simulation results of the AE location are consistent with the location of crack generation obtained by HS photography. The moment tensor simulation can explain the generation mechanism of the AE events. The microscopic failure mechanism of rock under a dynamic tensile test will be analyzed with the generation mechanism of AE events in the next section.
Discussion
The results of AE and moment tensor simulation have shown that they can be used to analyze the dynamic tensile failure process. In this section, the AE source mechanism is calculated based on the simulation results of the AE location and moment tensor in order to analyze the micromechanical mechanism of the rock dynamic tensile failure process. Firstly, the calculation method of the AE source mechanism is described. Then, we compare the results of the discrete fracture network (DFN) obtained by the PFC to the results of the AE source mechanism.
The Calculation Method of the Acoustic Emission Source Mechanism
AE source mechanism analysis is an important method to study the rock crack propagation mechanism and rock failure mechanism [34, 35]. Based on the simulation results of the AE location and moment tensor, the AE source mechanism in the sandstone dynamic tensile simulation is analyzed in this section. According to the calculation method of the moment tensor in the rock dynamic tensile in Moment Tensor Calculation in the Dynamic Tensile Simulation, the moment tensor of the AE source at different moments is calculated and represented by a vector diagram.
The ratio R of the isotropic and deviatoric components of the moment tensor can be used to analyze the mechanical mechanism of each AE source, which was first proposed by Feignier and Young [32]. Zhang and Zhang [11] used this method to analyze the crack nature in the bridge region of two pre-existing flaws under compressive loading. In 2D, the ratio is expressed as follow:
where tr(M) = (m1+m2), mi and
The value of R ranges from −100 to 100. The ratio R and corresponding AE source mechanism are shown in Table 3.
Microscopic Mechanism Analysis of the Rock Failure Process Under a Dynamic Brazilian Test
The value of R is calculated based on the moment tensor to analyze the AE source mechanism. AE source mechanisms can describe how the AE event is generated according to the position change of AE event formation relative to the initial position. Implosion is one of the AE source mechanisms, which means that this AE event is generated by extrusion. Therefore, the AE source mechanisms are used to analyze the microscopic mechanism.
Figure 10 is the microscopic mechanism of the generation process of main axial crack. Figure 10A is the results of DFN obtained by PFC. The blue lines are micro-shear cracks, and the red lines are micro-tensile cracks. In the user manual of PFC, the DFN is defined as a collection of fractures, which is often used to analyze failure type in rock mechanic simulations. A fracture will come out when a bond between two particles breaks. DFNs consist of two types: tensile fractures and shear fractures [36]. We use the results of DFN to obtain the micro-cracks. Then the statistics of micro-cracks are used to analyze mechanical mechanism of macro-crack. There are mainly micro-tensile cracks and a few micro-shear cracks in the generation process of main axial crack. Figure 10B is the AE source mechanism results of the main axial crack distinguished by the ratio R in the dynamic tensile simulation. The red box, blue triangle, and green circle show that the AE mechanism is tensile, implosion, and shear, respectively. The crack model in the center of the specimen is tensile in the process of the axial crack generation. At the ends of specimen, the crack model is mainly tensile in the initial stage. Then some shear cracks occurred. When the axial crack completely formed, the AE source mechanism models are mainly tensile, which is same with the results of the DFN fracture.
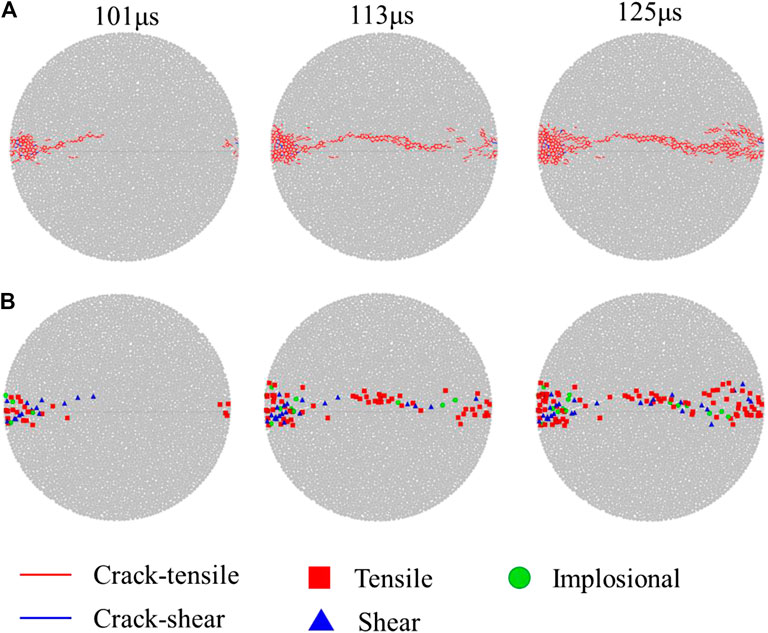
FIGURE 10. Microscopic mechanism of the axial crack generation. (A) is the results of DFN obtained by PFC. (B) is the results of AE source mechanism obtained based on the moment tensor.
Figure 11 is the statistical results of Figure 10. Figure 11A is the number of different crack types increased from 100 to 126 µs obtained by PFC simulation. The tensile micro-cracks continued to increase, and no new shear micro-cracks appeared based on PFC simulation. Figure 11B is the number of different types of AE source mechanisms increased from 100 to 126 µs obtained by the value of R. The three types of AE source mechanisms all increase. The tensile fracture mechanism increases the most. Therefore, the fracture mechanism of axial crack in the middle of the specimen is tensile, which can be both obtained by the PFC simulation or AE source mechanisms.
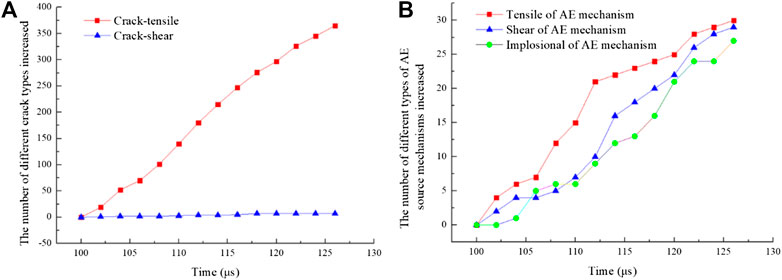
FIGURE 11. The new increased micro-crack from 100 to 126 µs. (A) is the number of different crack types increased from 100 to 126 µs. (B) is the number of different types of AE source mechanisms increased from 100 to 126 µs.
Figure 12 is the microscopic mechanism of the shear zones generation in the ends of specimen. Figure 12A is the DFN fracture obtained by the PFC. The red lines represent the bond break mode between two particles, tensile crack. The blue lines represent the bond break mode, shear crack. Figure 12B is the results of the crack model obtained by the value R based on moment tensor simulation. The red box, blue triangle, and green circle show that the AE mechanism is tensile, implosion, and shear, respectively.
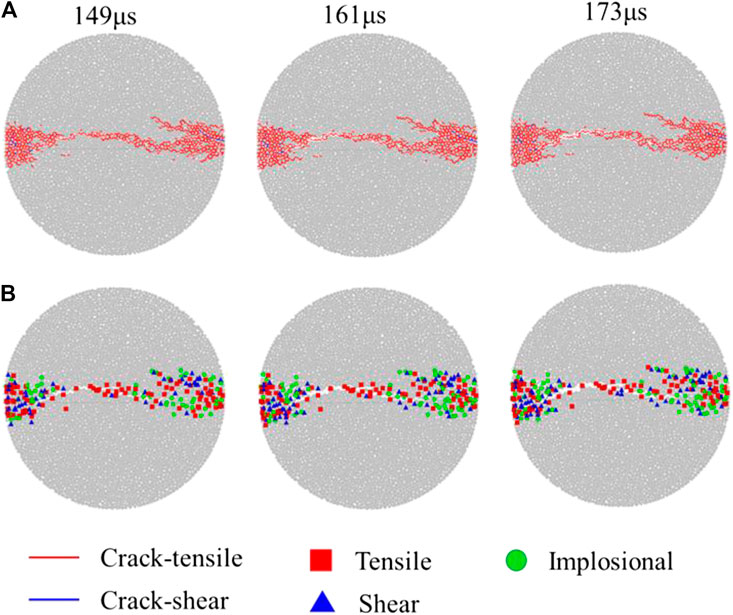
FIGURE 12. Microscopic mechanism of the shear zones generation in the ends of specimen. (A) is the DFN fracture obtained by the PFC. (B) is the results of the AE source mechanism obtained based on the moment tensor.
The results of the shear zone on both sides of the specimen in simulation are consistent in rock dynamic experiments of the existing research [37].
Figure 13 is the statistical results of Figure 12. Figure 13A is the number of different crack types increased from 148 to 173 μs obtained by PFC simulation. The tensile micro-cracks continued to increase from 148 to 161 µs. Then it stays stable from 161 to 173 µs, between which time the shear zones are formed. This phenomenon coincides with the HS photograph in Figure 7. There are no new shear micro-cracks based on the PFC simulation. Figure 13B is the number of different types of AE source mechanisms increased from 148 to 173 μs obtained by the value of R. The implosion and shear of the AE source mechanisms both increase from 148 to 161 µs. The number of implosion fracture mechanisms is the highest, which can be explained by the fact that the shear zones at both ends of the dynamic Brazil split specimen are formed by secondary loading. Comparing Figures 13A and Figure 13B, the fracture mechanism of the shear zones at the ends of the specimen obtained by the PFC simulation or AE source mechanisms are different. The statistical result of different crack types obtained by PFC shows that the fracture mechanism is tensile, which does not coincide with the HS photograph in Figure 8.
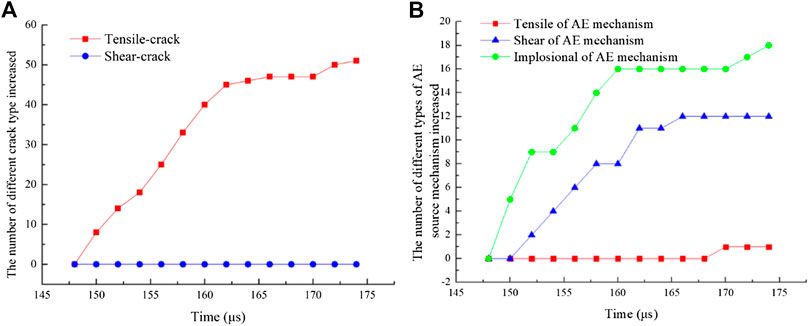
FIGURE 13. The statistical results of different types of micro-crack. (A) is the number of different crack types increased from 148 to 173 μs obtained by PFC. (B) is the number of different types of AE source mechanisms increased from 148 to 173 µs.
Figure 14A is the cumulative counts of different crack types obtained by bond break with the PFC simulation. The results show that the micro-mechanical mechanisms are tensile in all the failure processes. Therefore, we can confirm the macro-mechanical mechanisms of this dynamic test as tensile.
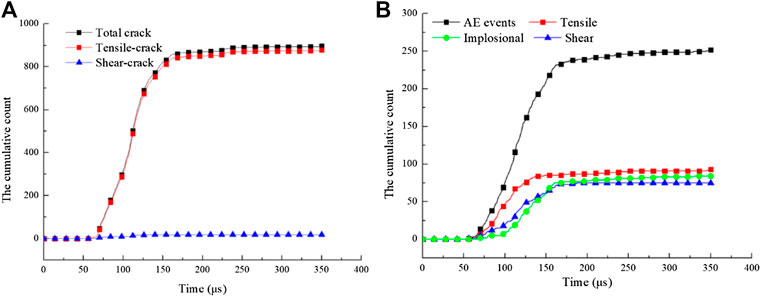
FIGURE 14. The cumulative counts of different types of micro-crack. (A) is the cumulative counts of different crack types obtained by PFC. (B) is the cumulative counts of AE events and three kinds of AE source mechanism in the simulation.
The number of AE events and three kinds of AE source mechanism (tensile, implosion, and shear) during the period from the initiation of micro-cracks to the formation of macroscopic cracks (no more new cracks generation) in the specimen are counted. These four cumulative counts are shown in Figure 14B. The cumulative counts of AE start to grow rapidly at 75 µs. and reach a stable value at about 175 µs. The cumulative counts of tension start to grow rapidly at 75 µs and reach a stable value at about 150 µs. The cumulative counts of implosion and shear start to grow rapidly at about 100 µs and reach a stable value at about 175 µs. The cumulative count of implosion and shear have an intersection point at about 150 µs. Before this point, the micro-mechanical mechanisms of the shear zones are mainly shear. After this point, the shear zone has been basically formed. The two ends of the specimen continue to be squeezed, the cumulative count of implosion becomes more than the shear.
Comparing with the results of the HS photograph in Acoustic Emission and Moment Tensor of the Main Axial Crack Parallel to the Impact Direction and Acoustic Emission and Moment Tensor of the Shear Failure Zones, the macro-mechanical mechanisms of the first macro-crack in the middle of the rock specimen is tensile. The macro-mechanical mechanisms of the other macro-crack in the two ends of the rock specimen are shear. The same results can be obtained by the simulation of the AE and moment tensor. However, the results of DFN with PFC can only explain the macro-mechanical mechanisms of the macro-crack generated in the middle of rock specimen in this dynamic test. Previous studies have also shown that the mechanical mechanisms of an AE event with moment tensor simulation are different with the result of DFN with PFC [14, 15].
Relationship Between AE Magnitude and Failure Process
Figure 15A shows that the failure process of rock under a dynamic Brazilian test can be divided into four stages according to magnitude and the stress on rock. Figure 15B shows the positions of these AE events. Before 101 µs, an AE event is mainly generated at the two ends of specimen. Magnitudes of these AE events are relatively small. There is no macro-crack generated in this phase. AE events with high magnitude mainly occur in the second phase. The macro-crack in the center of the specimen is also generated in this phase. The magnitude of AE generated in the third stage is slightly lower than that in the previous stage, and the positions generated are at both ends of the specimen which is the same as the first phase. The superposition of AE events in these two phases led to macro-crack. Therefore, we can confirm that the number and energy magnitude of AE events both affect the prediction of macro-crack generation during the failure process of a dynamic Brazilian test. The macro-crack in the center of the rock specimen is accompanied by AE events with a larger energy magnitude, while the macro-crack in the shear areas at both ends is accompanied by the accumulation of more AE events.
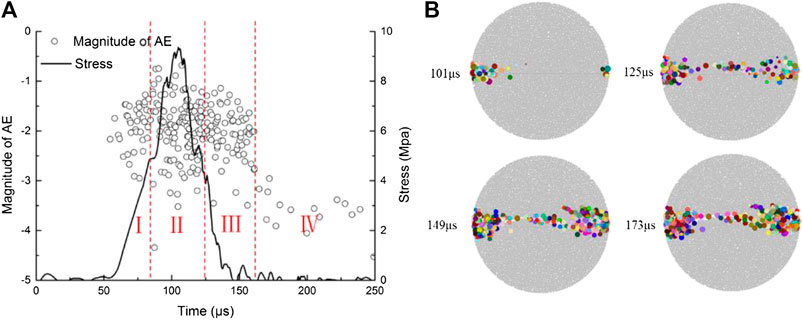
FIGURE 15. (A) The magnitude of AE and stress on rock changing with time. (B) The AE location in this simulation.
Conclusions
In order to analyze the microscopic mechanism of rock under a dynamic Brazilian test, an AE source and AE source moment tensor are simulated with PFC in this paper. The dynamic indirect tensile experiment of red sandstone with SHPB is conducted. HS photography is used to obtain the macroscopic failure process of the rock specimen. The simulated AE counts, different kinds of AE sources mechanism solutions, and b values are counted and discussed. The simulation results of rock under a dynamic Brazilian test with PFC are also compared with the results of HS photography. The conclusions are as follows.
(1) The simulation of an AE source and AE moment tensor are feasible in analyzing the microscopic mechanism of dynamic tensile simulation in rock dynamics. The results of AE simulation can be used to analysis the micro-crack propagation process, which is consistent with macroscopic cracking shown by HS photography. The AE magnitude and moment magnitude can be used to distinguish key events in the rock failure process. The AE mechanism obtained by the value of R verifies that they can be used to analyze the generation mechanism of micro-crack and rock dynamic failure.
(2) The results of the AE mechanism can explain the micro-mechanical mechanism of the main axial crack, which is parallel to the impact direction and divides the specimen into two pieces, and the shear failure zones which occur at the contact points of the BD specimen. The micro-mechanical mechanisms of the main axial crack are tensile. The micro-mechanical mechanisms of the shear zones are mainly tensile before the macro-crack generated in the two ends of the specimen. When the macro-crack is generated in the two ends of the specimen, the cumulative count of implosion and shear have an intersection point. Before this point, the micro-mechanical mechanisms of the shear zones are mainly shear. After this point, the shear zone has been basically formed. The two ends of the specimen continue to be squeezed, the cumulative count of implosion becomes more than the shear.
Data Availability Statement
The raw data supporting the conclusions of this article will be made available by the authors, without undue reservation.
Author Contributions
JZ and YZ conceived the idea, performed the data analyses, and wrote the manuscript. ZZ and CL contributed significantly to analysis and manuscript preparation and helped to perform the analysis with constructive discussions. All authors contributed to the article and approved the submitted version.
Funding
The authors gratefully acknowledge financial support from the National Natural Science Foundation of China (41772313) and the Fundamental Research Funds for the Central Universities of Central South University (2019zzts308).
Conflict of Interest
The authors declare that the research was conducted in the absence of any commercial or financial relationships that could be construed as a potential conflict of interest.
References
1. Zhu WC, Niu LL, Li SH, Xu ZH. Dynamic Brazilian test of rock under intermediate strain rate: pendulum hammer-driven SHPB test and numerical simulation. Rock Mech Rock Eng (2015) 48(5):1867–81. doi:10.1007/s00603-014-0677-7
2. Ai D, Zhao Y, Xie B, Li C. Experimental study of fracture characterizations of rocks under dynamic tension test with image processing. Shock Vib (2019) 2019:1–14. doi:10.1155/2019/6352609
3. Wu Z, Xu L, Liu Q. Numerical investigation of rock heterogeneity effect on rock dynamic strength and failure process using cohesive fracture model. Eng Geol (2015) 197:198–210. doi:10.1016/j.enggeo.2015.08.028
4. Zhao JS, Feng XT, Jiang Q, Zhou Y-Y. Microseismicity monitoring and failure mechanism analysis of rock masses with weak interlayer zone in underground intersecting chambers: a case study from the Baihetan Hydropower Station, China. Eng Geol (2018) 245:44–60. doi:10.1016/j.enggeo.2018.08.006
5. Chong Z, Li X, Hou P, Chen X, Wu Y. Moment tensor analysis of transversely isotropic shale based on the discrete element method. Int J Min Sci Technol (2017) 27(3):507–15. doi:10.1016/j.ijmst.2017.03.023
6. Cai X, Zhou ZL, Zang HZ, Song Z. Water saturation effects on dynamic behavior and microstructure damage of sandstone: phenomena and mechanisms. Eng Geol (2020) 276:105760. doi:10.1016/j.enggeo.2020.105760
7. Pei P, Dai F, Liu Y, Wei M. Dynamic tensile behavior of rocks under static pre-tension using the flattened Brazilian disc method. Int J Rock Mech Min Sci (2020) 126:104208. doi:10.1016/j.ijrmms.2019.104208
8. Imani M, Nejati HR, Goshtasbi K. Dynamic response and failure mechanism of Brazilian disk specimens at high strain rate. Soil Dynam Earthq Eng (2017) 100:261–9. doi:10.1016/j.soildyn.2017.06.007
9. Wong LNY, Einstein HH. Crack coalescence in molded gypsum and carrara marble: Part 1. Macroscopic observations and interpretation. Rock Mech Rock Eng (2009) 42(3):475–511. doi:10.1007/s00603-008-0002-4
10. Zeng W, Yang SQ, Tian WL. Experimental and numerical investigation of brittle sandstone specimens containing different shapes of holes under uniaxial compression. Eng Fract Mech (2018) 200:430–50. doi:10.1016/j.engfracmech.2018.08.016
11. Wu BB, Xia KW, Chen R. “Dynamic tensile failure of rocks subjected to simulated in situ stresses”, in International Congress on rock mechanics (2015).
12. Zhang Q, Zhang XP. The crack nature analysis of primary and secondary cracks: a numerical study based on moment tensors. Eng Fract Mech (2019) 210:70–83. doi:10.1016/j.engfracmech.2018.05.006
13. Hazzard JF, Young RP. Simulating acoustic emissions in bonded-particle models of rock. Int J Rock Mech Min Sci (2000) 37(5):867–72. doi:10.1016/S1365-1609(00)00017-4
14. Hazzard JF, Young RP. Moment tensors and micromechanical models. Tectonophysics (2002) 356(1):181–97. doi:10.1016/S1365-1609(00)00017-4
15. Cai M, Kaiser PK, Morioka H, Minami M, Maejima T, Tasaka Y, et al. FLAC/PFC coupled numerical simulation of AE in large-scale underground excavations. Int J Rock Mech Min Sci (2007) 44(4):550–64. doi:10.1016/j.ijrmms.2006.09.013
16. Lisjak A, Liu Q, Zhao Q, Mahabadi OK, Grasselli G. Numerical simulation of acoustic emission in brittle rocks by two-dimensional finite-discrete element analysis. Geophys J Int (2013) 195(1):423–43. doi:10.1093/gji/ggt221
17. Zhang XP, Zhang Q. Distinction of crack nature in brittle rock-like materials: a numerical study based on moment tensors. Rock Mech Rock Eng (2017) 50(10):1–9. doi:10.1007/s00603-017-1263-6
18. Ma J, Wu S, Zhang XP, Gan Y. Modeling acoustic emission in the Brazilian test using moment tensor inversion. Comput Geotech (2020) 123:103567. doi:10.1016/j.compgeo.2020.103567
19. Cundall PA. “A computer model for simulating progressive, large-scale movement in blocky rock system”, in Proceedings of the International Symposium on rock mechanics (1971).
20. Cundall PA, Strack ODL. Discussion: a discrete numerical model for granular assemblies. Geotechnique (1980) 30(3):331–6.
21. Li XB, Zou Y, Zhou ZL. Numerical simulation of the rock SHPB test with a special shape striker based on the discrete element method. Rock Mechanics and Rock Engineering (2014) 47(5):1693–709. doi:10.1007/s00603-013-0484-6
22. Zhou ZL, Zhao Y, Jiang YH, Zou Y, Cai X, Li DY. Dynamic behavior of rock during its post failure stage in shpb tests. Trans Nonferrous Metals Soc China (2017) 27(1):184–96. doi:10.1016/S1003-6326(17)60021-9
23. Cai X, Zhou Z, Tan L, Song Z. Fracture behavior and damage mechanisms of sandstone subjected to wetting-drying cycles, Eng Fract Mech (2020) 234:107109. doi:10.1016/j.engfracmech.2020.107109
24. Dai F, Huang S, Xia KW, Tan Z. Some fundamental issues in dynamic compression and tension tests of rocks using split Hopkinson pressure bar. Rock Mech Rock Eng (2010) 43(6):657–66. doi:10.1007/s00603-010-0091-8
25. Ai DH, Zhao YC, Wang QF, Li CW. Experimental and numerical investigation of crack propagation and dynamic properties of rock in SHPB indirect tension test. Int J Impact Eng (2019) 126:135–46. doi:10.1016/j.ijimpeng.2019.01.001
26. Li DY, Han ZY, Sun XL, Zhou T, Li XB. Dynamic mechanical properties and fracturing behavior of marble specimens containing single and double flaws in SHPB tests. Rock Mech Rock Eng (2019) 52(6):1623–43. doi:10.1007/s00603-018-1652-5
27. Zhou ZL, Zhao Y, Cao WZ, Chen L, Zhou J. Dynamic response of pillar workings Induced by Sudden pillar recovery. Rock Mechanics and Rock Engineering (2018) 51(10):3075–3090. doi:10.1007/s00603-018-1505-2
28. Hazzard JF, Damjanac B. “Further investigations of microseismicity in bonded particle models”, in Proceedings of the 3rd International FLAC/DEM Symposium. Minneapolis, MN: Itasca Consulting Group (2013), 22–4.
29. Gutenberg B, Richter CF. Frequency of earthquakes in California. Bull Seismol Soc Am (1944) 34(4):185–8. doi:10.1038/156371a0
30.Itasca Consulting Group Inc. PFC2D (Particle flow Code in 2 dimensions). Minneapolis, Minnesota: ICG (1999).Version 2.0
32. Feignier B, Young RP. Moment tensor inversion of induced microseisnmic events: evidence of non‐shear failures in the− 4< M<− 2 moment magnitude range. Geophys Res Lett (1992) 19(14):1503–6.
33. Zhang QB, Zhao J. A review of dynamic experimental techniques and mechanical behaviour of rock materials. Rock Mech Rock Eng (2014) 47(4):1411–78. doi:10.1007/s00603-013-0463-y
34. Ren FQ, Zhu C, He MC. Moment tensor analysis of acoustic emissions for cracking mechanisms during schist strain burst. Rock Mech Rock Eng (2019) 53:1–18. doi:10.1007/s00603-019-01897-3
35. Yamamoto K, Naoi M, Chen YQ, Nishihara K, Yano S, Kawakata H, et al. Moment tensor analysis of acoustic emissions induced by laboratory-based hydraulic fracturing in granite. Geophys J Int (2018) 216(3):1507–16. doi:10.1093/gji/ggy493
36. Benedetto MF, Berrone S, Pieraccini S, Scialò S. The virtual element method for discrete fracture network simulations. Comput Methods Appl Mech Eng (2014) 280:135–56.
Keywords: moment tensor, rock dynamics, microscopic mechanism, discrete element method, acoustic emission
Citation: Zhou Z, Zhou J, Zhao Y, Chen L and Li C (2021) Microscopic Failure Mechanism Analysis of Rock Under Dynamic Brazilian Test Based on Acoustic Emission and Moment Tensor Simulation. Front. Phys. 8:592483. doi: 10.3389/fphy.2020.592483
Received: 07 August 2020; Accepted: 30 November 2020;
Published: 15 January 2021.
Edited by:
Guoyang Fu, Monash University, AustraliaReviewed by:
Laurent Olivier Louis, New England Research, United StatesShida Xu, Northeastern University, China
Copyright © 2021 Zhou, Zhou, Zhao, Chen and Li. This is an open-access article distributed under the terms of the Creative Commons Attribution License (CC BY). The use, distribution or reproduction in other forums is permitted, provided the original author(s) and the copyright owner(s) are credited and that the original publication in this journal is cited, in accordance with accepted academic practice. No use, distribution or reproduction is permitted which does not comply with these terms.
*Correspondence: Yuan Zhao, emhhb3l1YW45MkBjc3UuZWR1LmNu; Lianjun Chen, Y3JlZWp4a0AxNjMuY29t
 Zilong Zhou1
 Jing Zhou

