 Jielin Li1,2*
 Liu Hong
94% of researchers rate our articles as excellent or good
Learn more about the work of our research integrity team to safeguard the quality of each article we publish.
Find out more
ORIGINAL RESEARCH article
Front. Phys. , 04 December 2020
Sec. Interdisciplinary Physics
Volume 8 - 2020 | https://doi.org/10.3389/fphy.2020.590710
This article is part of the Research Topic Physics and Seismicity of Rocks View all 18 articles
To study the acoustic emission evolution characteristics of saturated limestone under different loading and unloading paths, three cyclic loading and unloading tests were conducted with different loading rates and initial cyclic peak stresses, and acoustic emission monitoring was performed simultaneously. The results indicate that, during loading and unloading, the intermediate-frequency signals of saturated rock exhibit a variation trend of sparse–dense–sparse signals, whereas the low-frequency signals are continuously and massively produced. With the increase in the loading rate, the development trends of cumulative hits and energy become closer, and the development form of ringing count changes from N-type to U-type and then to N-type. The slight increase period and attenuation period are extended, whereas the intense growth period and postpeak calm period are shortened. With an increase in the initial cyclic peak stress, the change in cumulative energy is more obvious than that in cumulative hits near the rock failure. The development form of the ringing count changes from U-type to W-type and then to N-type, and each period is first shortened and then extended. With the increase in loading rate, the increase in the slow-change period tends to change from gradually increasing to increasing and then decreasing. By contrast, the increase in the step tends to change to a gradual increase. With the increase in the initial cyclic peak stress, the duration of and increase in the energy in the step and the slow-change period tend to decrease and then increase.
With the gradual depletion and exploitation of shallow mineral resources, deep mining has become an inevitable trend in mineral resource development. Considering that the rock surrounding deep wells is often eroded by groundwater, the mining process can be considered a loading and unloading process of the water-bearing rock mass [1]. Under loading and unloading, saturated rock produces plastic deformation and microfractures. Simultaneously, the stored energy is released in the form of an elastic wave, resulting in an acoustic emission (AE) phenomenon. Therefore, the deformation and fracture information of saturated rock can be dynamically monitored using AE technology, thereby providing the possibility for safety monitoring and early warning in deep rock engineering.
In the process of mining, the stress of the surrounding rock is redistributed, and the advancing speed of the stope in the engineering site often changes because of the hydrogeological environment, which changes the time and speed of the stress redistribution of the surrounding rock. Therefore, the loading rate can affect the internal fracture of saturated rock, which can be characterized by AE well. Generally, at a higher loading rate, the hits are higher, and their relationship with time changes from linear to exponential [2]. The low-amplitude events gradually decrease, and high-amplitude events gradually appear [3]. The higher the unloading rate, the shorter the calm period after unloading, and the faster the change rate of AE in the entire test [4].
Different excavation strengths result in different loads on the surrounding rock, and the internal fracture and AE characteristics of saturated rock are different under different loading and unloading stresses. Generally, the maximum value of AE parameters of rock changes in accordance with the peak stress [5], which is active in loading, calm in unloading [6], and active again at the unloading point in the plastic stage, showing a change of “small-increase–decrease–sudden-increase–decrease.” With an increase in the stress level, the felicity ratio decreases significantly. The AE event point source is produced intensively after the peak strength crosses 60% [7] and continuously expands along the joint surface. The AE parameters increase abruptly when the peak strength is approximately 85% [8] and exhibit fluctuations and calm. They then increase instantaneously when the rock approaches the peak strength [9] and decrease to 80% of the maximum value postpeak [10]. Meanwhile, the frequency decreases significantly before the peak strength. The crack develops from the top to the bottom before the peak and develops between the vertical planes after the peak. The above-mentioned research results demonstrate that the change law of AE parameters with the loading and unloading stress was obtained, but the development stage of the AE parameters was not considered comprehensively. The analysis of AE parameters in different stages under different stresses requires further study.
To understand the AE characteristics of saturated rock under different loading and unloading conditions further, saturated limestone was taken as the research object. The loading and unloading tests were carried out by varying the loading rates and initial cyclic peak stresses, and AE monitoring was simultaneously conducted. According to the test results, the evolution characteristics of AE characteristic parameters, steps, and development stages under different loading and unloading conditions can be summarized.
Limestone was selected as the rock sample. It was massive in structure and sampled from the Gaofeng tin mine, Guangxi, China, which is a deep mine that eroded by groundwater. The results of X-ray Fluorescence (XRF) and X-ray Diffraction (XRD) (see Tables 1 and 2) show that the rock was composed of argillaceous grains filled with calcite and cemented by serpentine, dolomite, pyrite, and a small amount of talc. According to the ISRM method, the limestone was processed into cylindrical samples with a size of 100 mm × F 50 mm [11]. After grouping, they were subjected to vacuum saturation treatment, and the average porosity of the limestone was 0.53%, as measured using a nuclear magnetic resonance testing system. Some rock samples were selected for the uniaxial compressive strength test, and the average compressive strength, σc, was 25.03 MPa as per the test result.
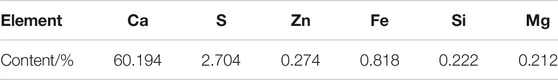
TABLE 1. Mineral elements of the limestone according to XRF.
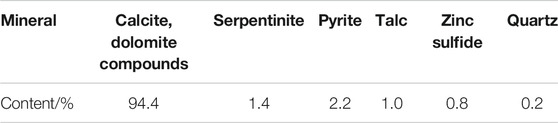
TABLE 2. Mineral composition of the limestone according to XRD.
The surrounding rock was gradually affected by the process of ore body mining [9], and the loading and unloading method of increasing the peak stress step by step, with an increased amplitude of σ△ = 5 MPa, was adopted in the test [12]. Because the surrounding rock of a roadway will not be disturbed by other stress environment before being disturbed by excavation, it can be considered as stable limit state, so the unloading mode of unloading to zero is selected [13]. The cyclic load path is shown in Figure 1A. Three loading rates of 0.15, 0.2, and 0.3 mm/min were set [14]. To study the AE characteristics at 10%, 30%, and 50% of the compressive strength, σc, three initial cyclic peak stresses, σ0 (hereinafter referred to as the “initial stress”) of 2.5, 7.5, and 12.5 MPa, respectively, were set at a loading rate of 0.2 mm/min. Besides, the unloading rate was fixed at 1 mm/min.
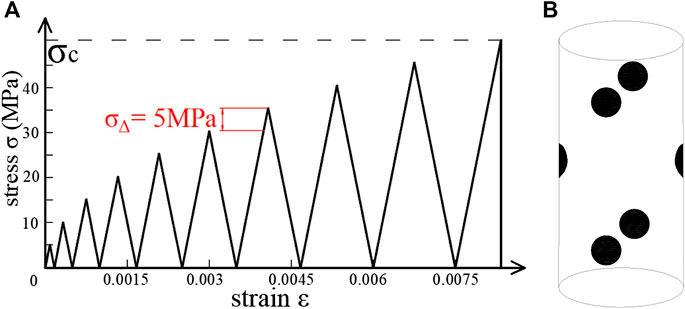
FIGURE 1. Cyclic loading and unloading diagram. (A) v = 0.15 mm/min; (B) v = 0.2 mm/min path.
Pico sensor was used to collect AE signal, Micro-Ⅱ Digital AE System was used to generate AE parameter data. AEwinTM software was used to set AE test parameters, and record, analyze, process AE parameters and localization data, and it adopted the absolute location method to perform linear inversion, only considering the travel times irrespective of velocity model, that is, the isotropic velocity model was used in this test, in which AE signals are assumed to travel with same velocity in different directions [26, 27]. To ensure the integrity of the acquired waveform, the AE acquisition threshold value was set at 45 dB. To simplify the noise reduction process in the later stage, the minimum noise threshold was set as 18 dB in AEwinTM software before the test.
In addition, the sensors were symmetrically arranged along the column at the level of 15 mm from the upper and lower ends of the sample and at the level of middle, as shown in Figure 1B. There were two sensors in each level, a total of six sensors were arranged. and the angle between adjacent levels is 90°. When more than four sensors collect the hit signal, AE event will be generated, then AE system will generate the coordinate data of the event according to the distance data transmitted by the six sensors, finally complete the localization.
According to the procedure above, the loading and unloading tests were conducted, and AE monitoring was performed simultaneously. Finally, the stress, strain, and AE monitoring results were obtained.
AE location technology can accurately describe the distribution of AE event point sources and can be used to analyze the structural failure mode and the development of rock microcracks. Before the localization test, a certain sensor was taken as the transmitter to test the localization data of other sensors when the transmitter sent out the acoustic signal. The localization errors were obtained by comparing the localization data with the actual position of the transmitter. Finally, the errors of X direction, Y direction and absolute distance of each source point were obtained, which were all less than 2 mm, then the localization test was carried out. Figure 2 shows the point source distribution and macroscopic failure structure of some typical rock samples. The lines in the point source diagram represent the density separation zone of the point source distribution, and the lines in the failure structure diagram represent the macroscopic failure surface. There is a good corresponding relationship that 1) the failure surface and the density separation zone of the point source are similar in each rock sample and 2) the fractures produced from the end of the dense point source gradually to the end of the sparse point source during the loading and unloading.
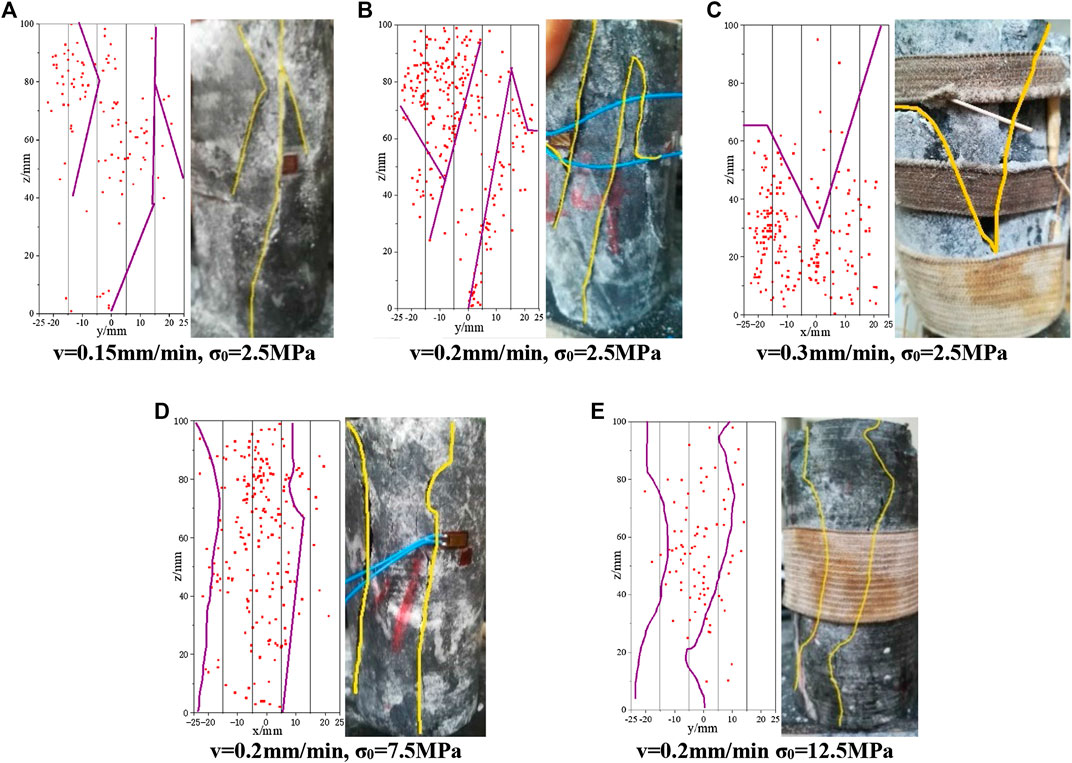
FIGURE 2. AE event point source distribution and macroscopic failure structure of rock under different loading rates and initial stresses.
Figures 2A–C show that, under σ0 = 2.5 MPa, the failure modes of the rock samples under different loading rates are clearly different. Considering the internal friction angle φ of the rock, φ = 90° − 2 θ, where θ is the angle between the failure surface and the maximum principal stress [24]. Under the condition of v = 0.15 mm/min, the upper end of the rock sample is compacted rapidly in the early period of loading and unloading, resulting in a shear crack sprouting on the left side of the upper end. After the downward expansion of the crack, a spalling occurs in the middle corner of the left side, and then an obvious longitudinal through main crack is produced on the right side of the upper end owing to the Poisson effect, showing obvious tensile failure characteristics. The angle between the tensile crack and the maximum principal stress is approximately 6°. The rock fracture structure is relatively complete, and the fragmentation is large. Under the condition of v = 0.2 mm/min, a shear fracture develops from the upper and lower ends of the rock sample without coalescence, and the two fractures continue to extend to both sides, the right side of which developed a longitudinal crack. At this time, the rapid increase in lateral deformation limits the continuous development of the crack and, finally, continues to extend to the right side, resulting in parallel shear failure of the rock, with θ of approximately 11°. The small cracks are dense, and the rock is clearly broken at the lower part of the rock. Under the condition of v = 0.3 mm/min, the rock sample first forms a shear crack from the upper right to the lower left. Then, with the increase in the peak stress, the shear crack breaks and changes direction in the middle lower part of the rock and gradually produces another shear crack on the upper left side. Finally, lateral failure occurs under the shear force, with θ of approximately 21°. The width of the cracks is large, the damage degree of the rock is large, and the surface is uneven.
Figures 2B,D,E show that, under a loading rate of 0.2 mm/min, the typical parallel shear failure occurs at σ0 = 2.5 MPa, with θ of approximately 11° and small cracks being densely distributed on the lower side of the rock. Under the condition of σ0 = 7.5 MPa, a crack sprouts downward on both sides of the upper end of the rock sample, and an arc-shaped shear crack finally forms on the left side. After short-term local crushing on the right side, longitudinal tensile cracks are formed under tensile stress. Finally, the two cracks are connected, and the loading and unloading end with tension shear composite failure, with θ of approximately 10° and a rough rock surface and with fewer flakes but larger fragmentation. Under the condition of σ0 = 12.5 MPa, there are left and right tension cracks, and most of the event point sources are concentrated in the middle of the rock sample. This is because the viscoplastic behavior of the rock under high initial stress is weak, and the lateral deformation produced is small. This increases the compression of the axial compressive stress on the rock sample, which causes the rock to exhibit typical brittle and tensile failure, with θ of approximately 9°. Large blocks form that have the same height as the intact rock sample.
It can be observed from the above that, with the increase in loading rate and decrease in initial stress, the viscoplasticity of the rock sample strengthens, the damage increases, and the bonding effect between particles becomes worse. Moreover, the fragmentation caused by rock failure decreases, which causes the internal friction angle of the rock to decrease, that is to say, the sliding friction needed to overcome for sliding between rock particles reduced, which leads to a gradual change of the rock failure mode from tensile failure to shear failure.
Figures 3 and 4 show the changes in cumulative hits (hereinafter referred to as “hits”), cumulative energy (hereinafter referred to as “energy”), and ringing count under different loading rates and initial stresses. The hits and energy under each loading and unloading condition exhibit the step growth characteristic, in which the three steps that exhibit the largest increasing extent are screened out in the figure. Step Ⅰ generally shows a rapid–slow change, and steps II and III mainly present a slow–rapid trend, which indicates that the generation of microfracture gradually slows down with loading and unloading.
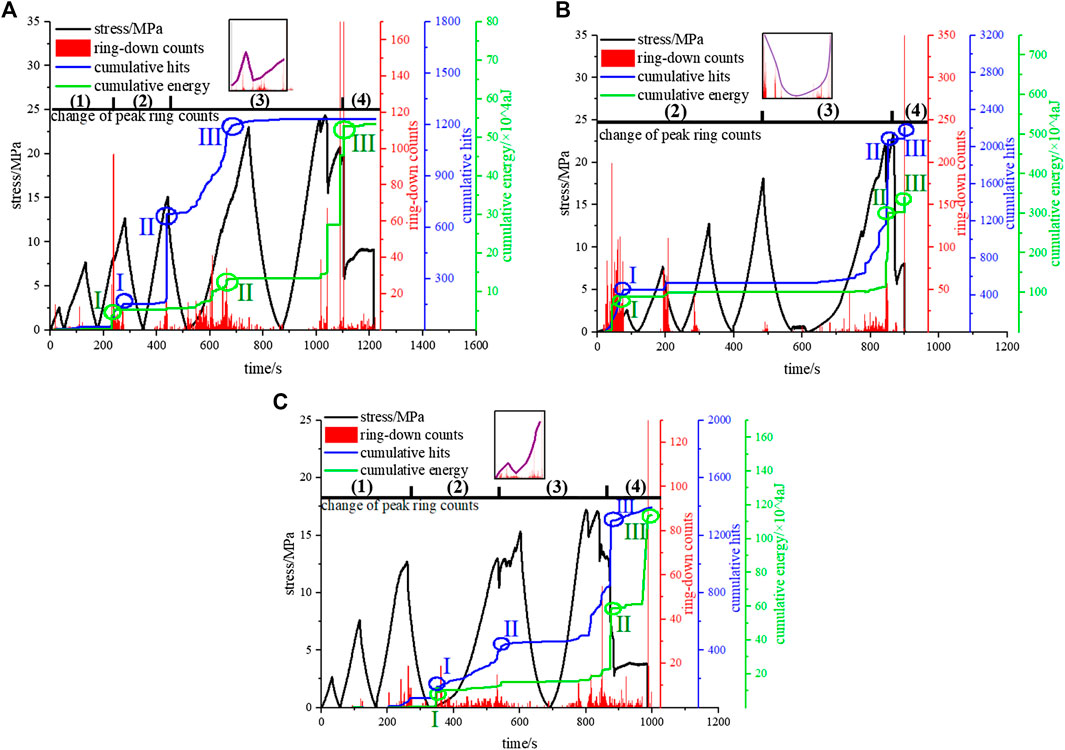
FIGURE 3. AE test results under different loading rates. (A) v = 0.15 mm/min; (B) v = 0.2 mm/min; (C) v = 0.3 mm/min: 1) slight increase period; 2) attenuation period; 3) intense growth period; 4)the postpeak calm period.
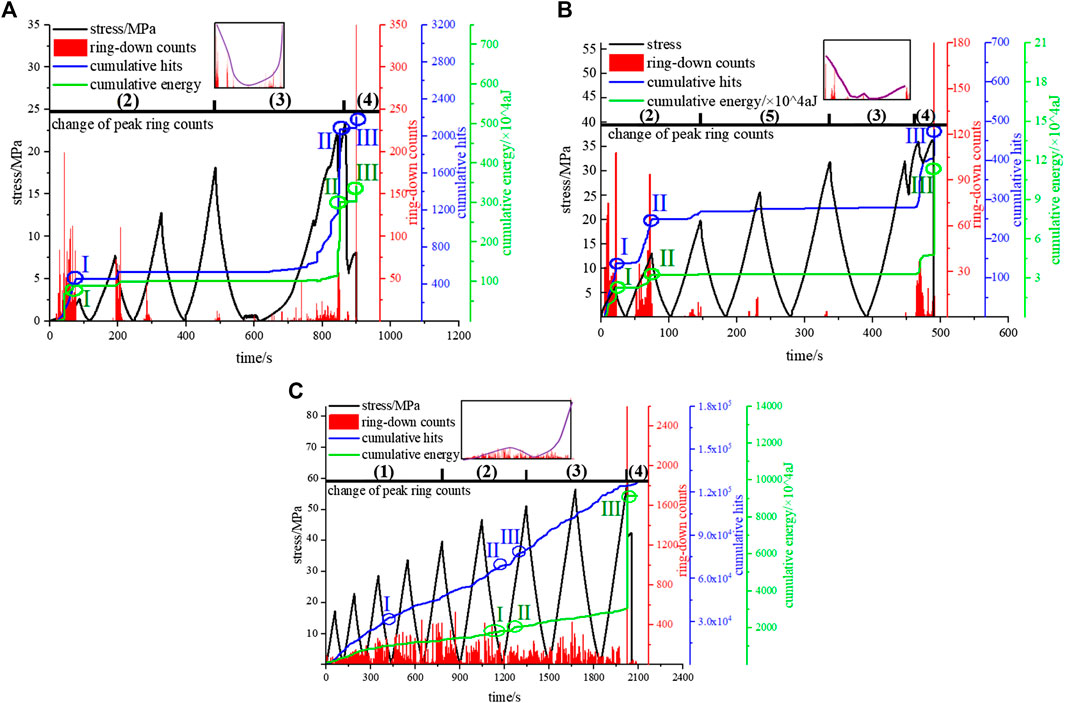
FIGURE 4. AE test results under different initial stresses. (A)σ0 = 2.5 MPa (B)σ0 = 7.5 MPa; (C)σ0 = 12.5 MPa: 1) slight increase period; 2) attenuation period; 3) intense growth period; 4) postpeak calm period; 5) transition period of increase and then decrease.
The peak count is defined as the highest value of the ringing count under a certain peak stress. According to the change in peak count, the loading and unloading process can be divided into a slight increase period, attenuation period, intense growth period, and postpeak calm period (within the softening stage). Figures 3 and 4 show that the ringing count increases sharply at the peak strength and then increases again suddenly at the end of the postpeak calm period. The highest ringing count in the entire test must appear in these two increases. In addition, the maximum increase in energy can only occur in the postpeak calm period, but the maximum increase in hits may also occur in the intense growth period. The peak count varies with the loading rate and initial stress.
Taking the AE monitoring results with v = 0.15 mm/min as an example, as shown in Figure 3A, the changes in the ringing count, hits, and energy of each cycle are as follows.
(1) In the first two cycles, the hits and energy are close to zero, and the ringing count is not obvious. This is because the lower stress is not sufficient to provide energy for the formation of new microcracks. Only a small amount of AE information is produced by the closure and sliding of primary fractures and the occlusive failure of particles.
(2) At the end of the slight increase period, the ringing count is suddenly active, and the hits and energy appear in step Ⅰ. The change in the step curve is steep first and then tends to be flat, and the step occurs at the inflection point of the stress curve instead of the peak stress. This is because of the sudden loss of the bearing capacity of local rock particles, resulting in a large number of microfractures.
(3) When loading and unloading to the attenuation period, the energy and ringing count return to calm again, while the hits appear in another step, which indicates that the rock mainly stores energy and produces many small fractures. Therefore, the energy is rarely released.
(4) When the stress increases into the intense growth period, the microcracks begin to form, and the ringing count gradually becomes active. In the cycle of the peak stress of 22.5 MPa, the ringing count appear since the stress zero point, showing a strong Felicity effect. The hits and energy also exhibit a large step near the peak stress of 22.5 MPa. The step curve exhibits a slow–rapid–slow process. After this step, energy has not reached half of the entire process, but the hits have completed 89% of the entire process. It is considered that, under a lower loading rate, although the internal fracture of rock can continue to develop, the energy can only be released after long-term accumulation; hence, its growth is concentrated in the postpeak calm period, instead of this period.
(5) At the end of the intense growth period, microcracks polymerize and run through the sample, the rock skeleton structure is gradually destroyed, forming structural planes, and sliding occurs on both sides of the structural plane. With the increase in rock deformation, the fracture of the sliding block results in two fluctuations in the stress–strain curve at the end of the intense growth period. Each fluctuation is accompanied by a large number of ringing counts and a steep-step-type energy release, the increase of which is greater than that at the peak strength. However, the number of hits at the two fluctuations is extremely quiet because the current energy is not sufficient for the fracture to continue to expand, forcing the rock to release energy rapidly [16, 17].
(6) When the loading continues to the postpeak calm period, the hits still do not increase, indicating that the residual resistance process of rock at a lower rate does not produce fracture information.
With an increase in the loading rate to 0.2 mm/min, except that the cycle of σ = 22.5 MPa showed a long-term Felicity effect (same as v = 0.15 mm/min) and the cycle of σ = 12.5 MPa showed a instantaneous Felicity effect, the ringing counts only occur when the stress exceeds the peak stress of the upper cycle—that is, showed a Kaiser effect, and the development trend and step trend of hits and energy become relatively closer than v = 0.15 mm/min. Compared with the low loading rate, the AE behavior of the cycle of low peak stress is no longer active at v = 0.3 mm/min, the distribution of the ringing count is the sparsest during loading and unloading, and the ringing count is the lowest when rock failure occurs. This is because the pore water pressure replaces the effective force to resist the external force when the loading rate is too fast, resulting in significant plastic deformation and weakening microfracture behavior. Moreover, under v = 0.3 mm/min, the long-term Felicity effect of rock occur in the cycle of the peak stress of 15 MPa. Compared with the low loading rate, it can be seen that the condition of v = 0.3 mm/min can advance the long-term Felicity effect of rock.
In addition, the hit of rock near failure varies with loading rates. Under v = 0.15 mm/min, the hit appears no obvious change in the last cycle, and there is no increase at the peak strength and at in the peak stress of softening stage. It shows that the brittleness of saturated limestone is weak near the failure, the rupture scale is small, the fracture behavior is less and not enough to converge to form a large fracture can be collected by acoustic emission, with weak precursor information. Under v = 0.2 mm/min, the hit presents a increase of two to three steps in the last cycle (800 s), followed by a sudden increase at the peak strength and softening stage, and the increasing extent at the peak strength is much greater than that at the softening stage, which indicates that the fracture behavior of saturated limestone is much more sensitive to stress than to time. Compared with v = 0.2 mm/min, what the difference which the hit appears under v = 0.3 mm/min is that there is no longer a sudden increase at peak stress, but a slow increase throughout the whole softening stage.
In Figure 3, the red part in the inset shows the development process of ringing count before softening stage, and the purple solid line shows the change trend of peak count, which is obtained by connecting the maximum ringing count values of each cycle. As can be seen from the insets, before the postpeak calm period, there are two types of change in peak count (including peak strength).
(1) When v = 0.2 mm/min, it is U-type, which means that the peak count was active in the early period, dropped to the lowest level after the attenuation period, and increased sharply at the end of the sudden rise.
(2) When v = 0.15 and 0.3 mm/min, it is N-type, which means that it increases slightly in the slight increase period, changes to a lower value in the attenuation period, and then increases sharply at the end of the intense growth period. Specifically, the peak count under v = 0.15 mm/min exhibits the former-N-type, which means that the final value of the intense growth period is higher than that of the slight increase period. The peak count under v = 0.3 mm/min is the latter-N-type.
With the increase in loading rate, before the postpeak calm period, the change of peak count gradually changes from the former-N-type to the U-type and the latter-N-type. Thus, the increase in the proportion of the intense growth period gradual.
Taking the AE monitoring results under σ0 = 7.5 MPa as an example, it can be seen from Figure 4B that the AE behavior in each cycle has a good Kaiser effect—that is, no AE behavior occurs in each unloading section and loading section lower than the previous peak stress. There are two peaks in the ringing count of each cycle: one in the loading section, and the other at the peak stress. They are defined as the front peak count and the postpeak count, respectively. The postpeak count is higher than the front peak count. The times of steps for energy and hits are basically the same, but the energy does not increase significantly until the peak strength, and the hits exhibit a larger proportion in the early period. The changes in ringing count, hits, and energy of each cycle are as follows.
(1) In the first cycle of the attenuation period, the peak count reaches the maximum value before rock failure, owing to the instantaneous contact, extrusion, and closure of primary fractures and pores in the rock during the compaction stage. The front peak count occurs at 46.7% σ (σ is the stress peak of the current cycle). Step Ⅰ of hits and energy appears at the peak stress of this cycle, and the step process presents a trend of “rapid–slow–rapid.”
(2) In the second cycle of the attenuation period, the front peak count dropped sharply, which occurred at 47.8% σ, and then decreased slightly. The ringing count of this cycle was lower, but the duration was the longest among all cycles. Step Ⅱ of hits and energy appeared in this cycle. Unlike in the past, this step exhibited a linear trend, and the increase in hits was larger than that of step Ⅰ. This is because the pore water pressure in saturated rock drives the pore cavity to disappear instantaneously, which is not subjected to the external force. Therefore, rock microfracture occurs without energy consumption. The hits have reached 52.3% of the entire process, but the energy has only reached 28.6%. This shows that, under the higher initial stress, the microfracture behavior is more in the early period, and the release of elastic energy is mostly concentrated in the later period.
(3) At the beginning of the transition period of increase and then decrease, only a small number of ringing counts were produced. The occurrence time of the former peak count was 58.4% σ, and the hits and energy increased slightly.
(4) In the middle of the transition period of increase and then decrease, the ringing count increased, but the hits and energy were calm for the first time, indicating that the rock had entered the linear elastic stage. The uneven elastic deformation between grains was well coordinated in this linear elastic stage, resulting in no new elastic energy being produced. The synchronization and homogenization of elastic deformation also increased the signals crossing the threshold among the hits and further increased the ringing count. Moreover, the occurrence time of the front peak count in this cycle was 59.3% σ. Combined with the previous cycles, the occurrence time was delayed with an increase in the number of cycles.
(5) At the end of the transition period of increase and then decrease, the ringing count dropped to the lowest level, and the hits and energy remained unchanged. This indicates that the linear elastic stage was ending, and the rock stiffness would not continue to increase greatly. Because of this, the fracture cavity did not further expand.
(6) In the intense growth period, the local stress dropped at 73.1% σc and the peak strength σc. The ringing count appeared as a small signal at 73.1% σc but increased rapidly at σc for a long time. The hits and energy also exhibited step Ⅲ at σc, but the increase in energy was small. This shows that the rock had entered the plastic stage, a large amount of uneven deformation had occurred between the grains, and the tensile force had formed on both sides of the fracture, resulting in a large number of microcracks connecting to form macrocracks. This increased the ringing count, hits, and energy. What the stored elastic energy was used for also changed from the initiation of new cracks to the destruction of the local structure of rock, and the elastic energy exhibited a short-term accumulation because suddenly there was no need for crack initiation; therefore, the increase in energy at the end of the intense growth period was extremely small.
(7) In the postpeak calm period, the stress increases automatically after decreasing, showing the characteristics of stress strengthening. The ringing count shows an abnormally sharp increase in rock failure, and the hits and energy also complete step Ⅲ with the largest increase. This is because the dislocation and slip of macrocracks after the peak strength can still produce a large number of AE behaviors.
Figure 4 also shows that, with the increase in initial stress, the postpeak calm period (i.e., softening stage) becomes less obvious. The gap between the hits and the energy curve develops from a close fit to a larger difference, the increase in energy during rock failure tends to be more obvious than that of hits, and the peak count changes from U-type to W-type and N-type gradually. This indicates that the increase in initial stress tends to increases the AE behavior in the early period. When the initial stress increases from 2.5 to 7.5 MPa, the transition period of increase and then decrease occurs, in which the process of “increase” is caused by the fracture polymerization by the primary and secondary stress. When the initial stress increases to 12.5 MPa, most of the load acts on the rock in the form of microfracture, which results in the ringing count appearing throughout the loading and unloading process, showing a strong felicity effect. The hits and energy also show a trend of uniform growth with time and do not show step growth, as with the lower initial stress. Meanwhile, under σ0 = 12.5 MPa, the distribution of the ringing count is the most dense, and the hits, energy, and ringing count are the largest during rock failure. This indicates that the rock has strong brittleness under a higher initial stress, which also leads to the tensile failure mode with large blocks, as in Figure 2E.
In addition, the hit of rock near failure varies with the initial stress. Under σ0 = 2.5 MPa, the hit increases greatly and slightly at the peak strength and the peak stress of the softening stage respectively. Under σ0 = 7.5 MPa, the rock does not increase suddenly near failure, showing a smooth growth from 460 s. It is considered via analysis that the increase of initial stress will accelerate the migration of water in saturated rock, thus buffer the increase of hit caused by rock fracture. Under σ0 = 12.5 MPa, the change of hit near peak strength is the same as that in the earlier cycles, in both of which the hit all appears the tend of slow increase, moreover, the increase rate of hit in softening stage is even lower than the earlier cycles. The hit under σ0 = 12.5 MPa verifies the rationality of the analysis on water migration.
Table 3 shows the duration of ringing count evolution under different loading rates and initial stresses. With the increase in loading rate v, the durations of the slight increase period and attenuation period tend to get extended, whereas the durations of the intense growth period and postpeak calm period are gradually shortened. It is considered that the faster loading rate promotes free water seepage inside the saturated rock, increases the slip behavior of the primary microcracks, and aggravates the microfracture and occlusal failure of the rough surface, which requires a long time; therefore, the early period is longer. However, when loading to the intense growth period, the seepage of free water saturates, and an increase in the loading rate aggravates the compression of the main stress on macrocracks, thus shortening the later period. With the increase in initial stress σ0, except for the slight increase period, the duration of each period decreases first and then increases, which can be interpreted as indicating the existence of a critical value of initial stress. When the initial stress is less than the critical value, the microfractures develop slowly, and the larger initial stress obviously shortens the development time of each period. When the initial stress is greater than the critical value, the pore water pressure replaces the rock skeleton to bear the compression of the external force. Therefore, a larger initial stress prolongs the process of each period.
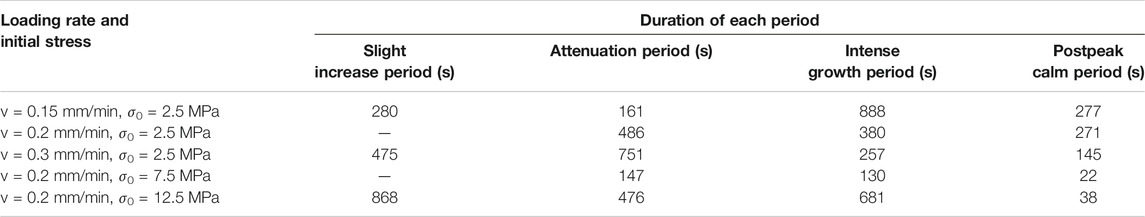
TABLE 3. Duration of each period of ringing count evolution.
Figures 3 and 4 show that there are some steps in the cumulative hits and energy. The three steps that exhibit the largest increasing amplitude and the slow-change period before each step (hereinafter referred to as the “slow-change period”) are used to analyze the step characteristics. To describe the step characteristics conveniently, the duration proportion is defined as the proportion of the duration of a certain step (or slow-change period) to that of the entire test. The increase proportion is defined as the proportion of the increase in the hit (or energy) of a certain step (or slow-change period) to that of the entire test. The softening duration is defined as the calm duration of the hits (or energy) in the softening stage.
Table 4 shows the duration and increase proportion in each step and slow-change period under different loading rates v and initial stresses σ0. From the transverse view, with the loading and unloading process, the increase proportion of hits and energy in the step and slow-change period gradually increase, and the increase proportion of energy in the step and slow-change period increases gradually. This indicates that there is a positive correlation between the damage of rock, the energy transformation behavior, and time at a lower loading rate. Under the condition of v = 0.2 mm/min, the increase proportion of hits and energy first increases and then decreases, and the value of step Ⅲ is the smallest. It is considered that the expansion limit of pores is easier to reach at a higher loading rate, causing the coalescence of pores to become saturated at step Ⅱ, leading to a decrease in the increase proportion of energy and hits in step Ⅲ. Under the condition of v = 0.3 mm/min, the increase proportion in the slow-change period increases first and then decreases, whereas the increase proportion in the step increases gradually. This is because step Ⅲ is close to failure, and the formation of the macrofailure surface destroys the bearing structure of the rock, resulting in a substantial increase in hits and energy. Under the condition of σ0 = 7.5 and 12.5 MPa, the duration and increase proportion of energy in the step and slow-change period first decrease and then increase. Analysis shows that, under a larger initial stress, the rock at the linear elastic stage shows obvious elastic characteristics, and the plastic deformation is small. Furthermore, the high elasticity enables the storage of elastic energy to be completed earlier. Therefore, the duration and increase in the proportion of energy in step Ⅱ and the second slow-change period occur through a trough.
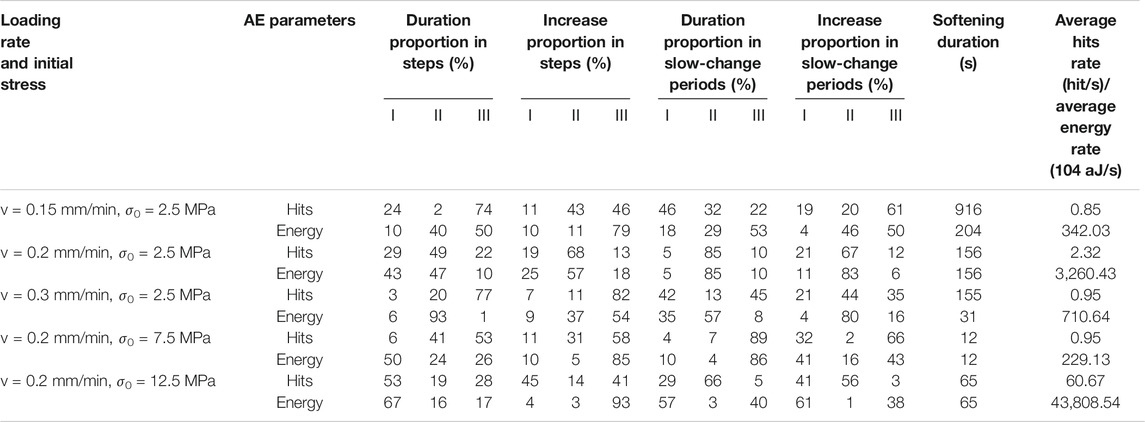
TABLE 4. Duration proportion and increase proportion in each step and slow-change period.
From the longitudinal view, with the increase in loading rate, the duration and increase proportion of hits in steps Ⅰ and Ⅱ first increase and then decrease, and the it is same in step Ⅰ of energy. With the increase in initial stress, the duration and increase proportion of hits in step Ⅰ and the slow-change period first decrease and then increase. In addition, the average hits/energy rate at v = 0.15 mm/min is the minimum, and the maximum value is at σ0 = 12.5 MPa, thereby indicating that a lower loading rate or initial stress slows the energy release under loading and unloading.
The amplitude and frequency of the AE signal vary with the loading rate and initial stress, which are affected by the fracture scale and structural evolution of the rock. To describe the variation characteristics of the maximum value of the amplitude signal better, the peak amplitude is defined as the signal with the highest amplitude in a certain cycle. Figures 5 and 7 show the variation process of the amplitude and peak frequency of typical rock samples under different loading rates and initial stresses. The circular particles and the curve on Figures 5 and 7 represent the amplitude signal and the variation of peak amplitude, respectively, and the triangular particles represent the peak frequency signal.
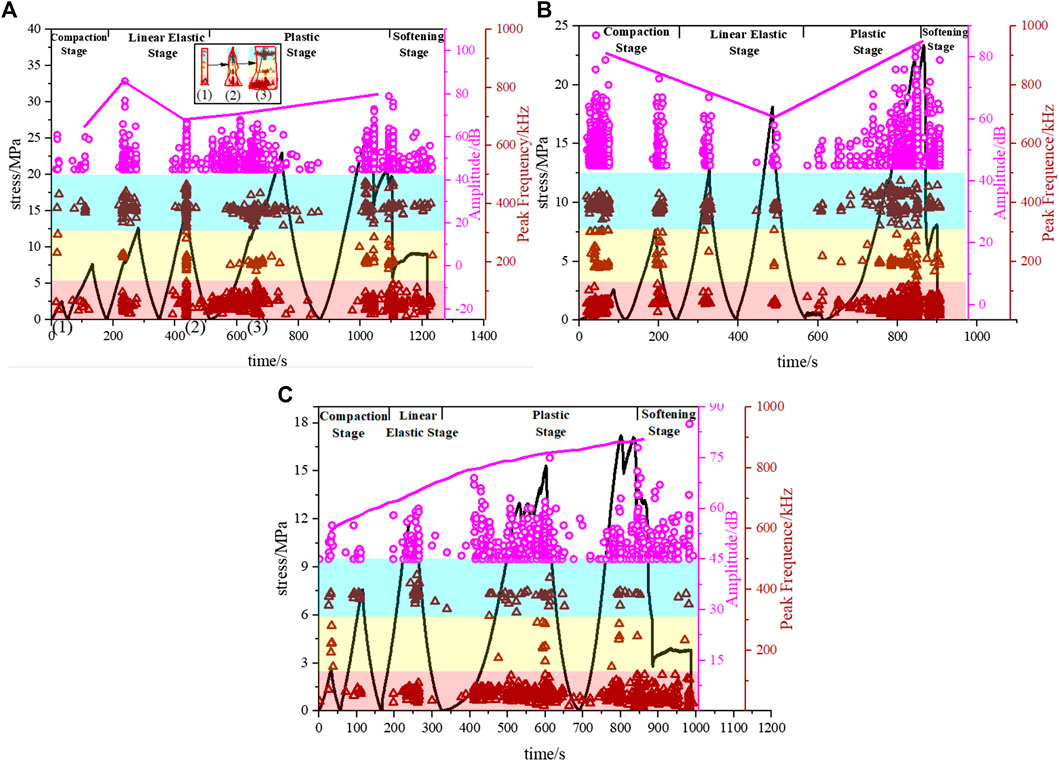
FIGURE 5. Variation process of the amplitude and peak frequency signals under different loading rates. (A) v = 0.15 mm/min; (B) v = 0.2 mm/min; (C) v = 0.3 mm/min.
Figures 5 and 7 show that the peak amplitude generally appears at the peak stress, but it appears in advance at the plastic stage. In the softening stage, the high-amplitude signal gradually disappears. For the frequency, Su et al. took the frequency less than 120 kHz as low-frequency of rock [15], and Kong et al. took the frequency greater than 300 kHz as the high-frequency of rock [18]. Based on the division method above, combined with the density distribution of the frequency signals in this test, the frequency is divided into a low-frequency band (0–125 kHz), intermediate-frequency band (125–320 kHz), and high-frequency band (320–500 kHz) here, corresponding to the red, yellow, and blue areas, respectively, in Figures 5 and 7. In a certain cycle, the low-frequency signal is generated first, and its number is the highest, followed by the high-frequency signals and intermediate-frequency signals. Intermediate-frequency signals appear in the first one to two cycles and then become calm. They then become active in the plastic stage, while low- and high-frequency signals are more stable and continuous. With the increase in the number of cycles, the outer contour composed of signals in the three frequency bands gradually changes from rectangular to a concave triangle. It finally becomes a concave trapezoid in the plastic stage, as shown in Figure 5A.
With the increase in the number of cycles, the amplitude signals and frequency signals do not increase singly [19, 20], and the number changes of the two signals have good consistency. Before the plastic stage, the two signals are concentrated on the stress that exceeds the previous peak stress, showing a good Kaiser effect, and become extremely dense in the plastic stage. This can be used as a precursor to determine the rock failure under loading and unloading [21, 22].
The amplitude and peak frequency show different laws under different loading rates and initial stresses.
Taking the frequency and amplitude monitoring results with v = 0.15 mm/min as an example, Figure 5A shows that the variation characteristics of peak frequency and amplitude in each cycle are as follows.
(1) In the first cycle of the compaction stage, only a small number of amplitude signals is generated, with a peak amplitude of 60 dB. The peak frequency signals are distributed in all three frequency bands, exhibiting obvious band division characteristics, but there are few signals in each frequency band.
(2) In the second cycle of the compaction stage, the amplitude signal increases slightly. This is caused by the collision and friction of particles on both sides of the primary fracture, and the peak amplitude appears at the peak stress. The signal in the intermediate-frequency band disappears, while the signal in the low- and high-frequency bands increases, especially in the low-frequency band. This indicates that the signal source of the low-frequency band is the contact behavior of the particles.
(3) In the first cycle of the linear elastic stage, a large number of amplitude signals appeared. The amplitude signals were very dense between 45 and 60 dB, with a peak amplitude of 85 dB, reaching the highest value among all cycles. The peak amplitude did not appear at the peak stress but appeared at the stress fluctuation. It is considered that the microcracks began to expand in the linear elastic stage, and the local weak rock blocks could not bear the expansion tension of the fracture, leading to the generation of a high-amplitude signal and the redistribution of stress in the rock. The signal of the high-frequency band increased significantly and exceeded that of the low-frequency band, and the signal range and duration of both expanded by several times. However, the distribution range of the signal in the intermediate-frequency band was even smaller than that in the compaction stage. Therefore, the signal source of the high-frequency band is the expansion behavior of the fracture, and the signal source of the intermediate-frequency band is the compression behavior of the fracture.
(4) In the second cycle of the linear elastic stage, the peak amplitude is 67 dB, which is lower than that of the previous cycle. This shows that the linear elastic stage is an important stage for storing elastic energy, and the released energy is very small. This is insufficient to make the crack continuously expand, and only a small amount of fracture is initiated. Moreover, the amplitude signal is continuous and symmetrical, the amplitude signal near the peak amplitude is continuous, and the signals on both sides of the peak amplitude decrease gradually. In terms of peak frequency, the frequency signal at the peak stress is continuous and dense, whereas the signal is sparse at other times, thereby indicating that the rock shows special characteristics before a large quantity of fracture propagation. The frequency range of each frequency band signal is double that in the previous cycle but exhibits a longer duration only at 400 kHz.
(5) In the first cycle of the plastic stage, the peak amplitude is 68 dB, which is higher than that of the previous cycles. The time of the peak amplitude is still at the stress fluctuation, and the amplitude signal decreases evenly from the peak amplitude to both sides, and the signal spreads throughout the entire cycle and is very dense. This indicates that the rock has begun to produce plastic damage. The frequency range of the intermediate- and high-frequency signals is shorter than that of the previous cycle, indicating that the contact behavior of particles in the early period of the plastic stage is the highest, followed by the expansion of cracks, and the fracture closure is the most rare.
(6) In the second cycle of the plastic stage, the peak amplitude is 80 dB, which is the highest among all cycles. The maximum amplitude increases from 970 to 1,100 s, in which only the stress fluctuation is broken. It is considered that the coalescence of a large number of cracks leads to a gradual increase in amplitude, while the macroscopic failure surface forms in this process. When the failure surface is not subjected to the compression suddenly, it stops rupturing, and only sliding friction occurs. As a result, the increase in the amplitude breaks at the stress fluctuation. After 970 s, the frequency signals in the intermediate- and high-frequency bands are only active at the peak strength and enhanced strength, while the low-frequency signals show continuous development characteristics. This indicates that the particles continuously produce sliding friction behavior, which is the same as the variation law of amplitude. In addition, the frequency range of the intermediate- and high-frequency signals is greatly increased, and the high-frequency signals have spread throughout the entire frequency band. However, the low-frequency signal is shortened. This indicates that the fracture is mainly expanded in the late period of the plastic stage, supplemented by being compacted, and the contact behavior of the particles is the least.
(7) In the softening stage, with the passage of time, the maximum amplitude of the amplitude signals gradually decreases, and it is densely distributed between 45 and 52 dB. It is sparse in the area of >52 dB. This is because the main failure crack of the rock has formed, and the amplitude signal can only be generated by the weak structural plane around the main crack. The number of intermediate-frequency signals decreases sharply, and the frequency range of intermediate- and high-frequency signals shortens several times. The low-frequency signals are dense and continuous. This shows that the contact behavior of particles only occurs in the process of residual resistance of rocks, and the expansion and compaction of fractures are limited.
Figure 5 shows that, with the increase in loading rate, the change form of the peak amplitude before the peak strength gradually changes from N-type to V-type and linear-type. The increase in the loading rate conceals the early variation process of the peak amplitude. This is because a higher rate increases the compression frequency on pores and then reduces the chance of their recovery and prolongs the variation period of the rock structure. This causes the previous change of amplitude to disappear.
Figure 6 shows the change of frequency value with peak stress in each frequency band. It can be seen that in the low-frequency band, the frequency at v = 0.15 mm/min first increases and then decreases, with a change critical point of peak stress of 17.5 MPa, which indicates that the contact behavior of rock particles reduces relatively compared with the fracture propagation behavior under low loading rate; the frequency at v = 0.2 mm/min first decreases and then increases, and the change critical point is the same as that under v = 0.15 mm/min; the frequency at v = 0.3 mm/min increases exponentially. In the medium frequency band, the frequency at v = 0.2 mm/min also decreases and then increases, while the frequency at v = 0.15 mm/min and 0.3 mm/min presents a monotonic increasing trend, which indicates that both too low and too high loading rate will make the fracture compression process more uniform, but only too high loading rate can promote the fracture uniform expansion. In the high frequency band, the frequency change trend of v = 0.15 and 0.2 mm/min is the same as that of low frequency band, while the frequency at v = 0.3 mm/min shows a complex process of increase-decrease-increase, which indicates that the development of particle is similar to that of fracture at a low loading rate, but the fracture development is full of randomness at a high rate, which is easily affected by external factors, showing a reciprocating change.
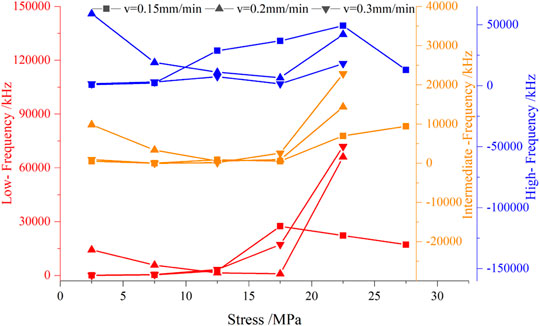
FIGURE 6. Variation of frequency value with peak stress in each frequency band under different loading rates.
In addition, the number of signals of the three frequency bands in Figure 5 and the amplitude attenuation value of the softening stage were calculated. The results are shown in Table 5. With the increase in loading rate, the amplitude attenuation value of the softening stage gradually decreases. The rock is considered to exhibit obvious viscoplasticity in the softening stage, resulting in large deformation. A higher loading rate promotes more changes in rock structure; hence, the amplitude does not decrease excessively. In addition, the peak frequency is mainly distributed in the low-frequency band. With the increase in the loading rate, the intermediate- and high-frequency signals gradually decrease, and the low-frequency signals gradually increase, especially in the range of 0.2–0.3 mm/min.
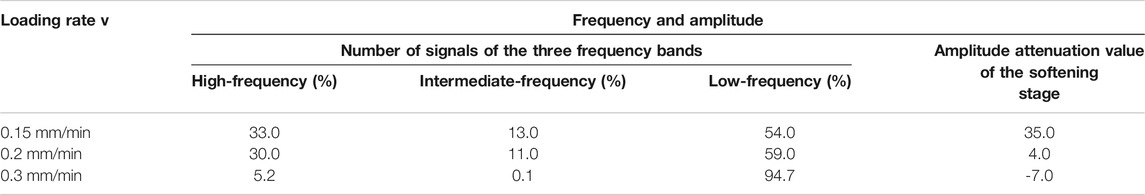
TABLE 5. Number of signals of the three frequency bands and amplitude attenuation value of the softening stage under different loading rates.
Taking the frequency and amplitude monitoring results under σ0 = 7.5 MPa as an example, as shown in Figure 7B, the variation characteristics of frequency and amplitude in each cycle are as follows.
(1) In the first cycle of the compaction stage, the amplitude and frequency signals are continuously generated in the loading section, and the peak amplitude is 67 dB. This is the highest value, except for the peak amplitude during rock failure. The frequency signals of the three frequency bands are relatively concentrated, and their outer contours exhibit rectangular characteristics. The number of low-frequency signals reaches the maximum among all cycles, indicating that, under the higher initial stress, the effect of the load on the rock in the initial cycle is large, and the contact and chimerism behaviors of particles are relatively more in the compaction stage.
(2) In the second cycle of the compaction stage, the peak amplitude is 65 dB, which is lower than that of the previous cycles. This is because the effective bearing area of the rock block increases significantly after the pores are compacted for a period of time, which reduces the chance of fracture production. The outer contours of the frequency signals in the three frequency bands all exhibit triangular characteristics, and the number of high- and intermediate-frequency signals is the greatest among all cycles. The low-frequency signals significantly decrease and last until the rock failure, indicating that the chimerism of particles is easily saturated under high initial stress, causing the fracture to expand earlier.
(3) In the linear elastic stage, the amplitude signals and the peak amplitude continue to decrease gradually. Intermediate-frequency signals do not appear. Low-frequency signals continue to be calm, and the frequency range and duration of high-frequency signals gradually shorten. The results show that, under the higher initial stress, the compaction behavior of fracture no longer occurs in the linear elastic stage, and the contact behavior of the particles is low. With the increase in the number of cycles, local microcracks and small events are also increasingly fewer in the linear elastic stage.
(4) In the plastic stage, the stresses at 73% σc and σc show a stress-strengthening phenomenon of decrease first and then increase, and the amplitude signals also show a prominent characteristic at the stresses above. Compared with 73% σc, the duration at σc is longer, which indicates that the stress strengthening of rock can improve the stiffness of the rock block in a short time. This makes the rock produce microfractures in a more brittle form and causes the AE behavior to be easier to monitor. The number of high-frequency signals reaches the maximum among all cycles, and the frequency range of the intermediate-frequency signals also increases. This indicates that the damage accumulation in the rock is accelerated, and a large quantity of fracture expands rapidly. In the test process, the fractures coalesce to form macrocracks at 470 s.
(5) In the softening stage, the amplitude and high-frequency signals show a continuous change characteristic, and the peak amplitude decreases slightly. The intermediate- and low-frequency signals only appear at the peak strength and residual strength. This is because the stress in the rock is redistributed to reach the next equilibrium point, and the time provided for stress distribution in the softening stage is extremely short, resulting in few microfractures and causing a decrease in the peak strength and the sparsity of the intermediate- and low-frequency signals.
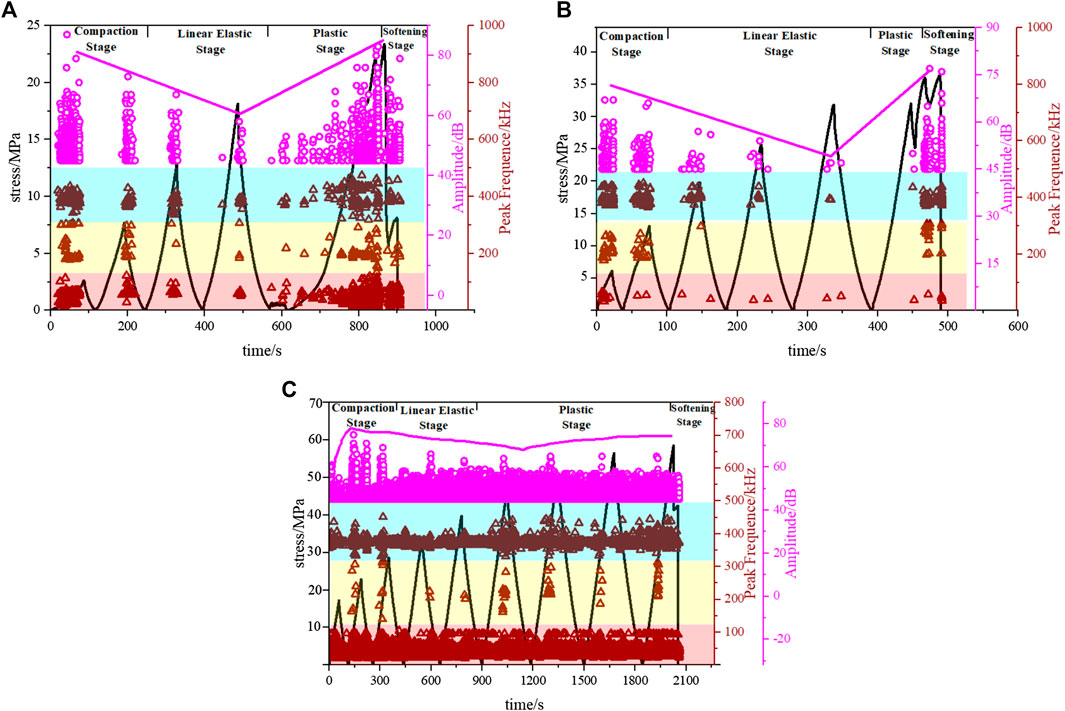
FIGURE 7. Variation process of the amplitude and peak frequency signals under different initial stresses (A) σ0 = 2.5 MPa, (B)σ0 = 7.5 MPa; (C)σ0 = 12.5 MPa.
With the increase in initial stress, the variation form of the peak amplitude changes from V-type to N-type, and the distribution of the peak frequency is more concentrated. This is very dense in a certain small frequency range. It is considered that, in the loading section starting from zero stress, a higher initial stress reduces the occurrence of irregular plastic deformation, making the distribution range of the peak frequency more concentrated, so that it gathers the distribution of the peak frequency. In addition, the Kaiser effect of AE becomes weak when σ0 = 12.5 MPa.
Figure 8 shows the change process of frequency value with peak stress in each frequency band. To better compare the frequency changes at each initial stress, the low-frequency and high-frequency values under σ0 = 12.5 MPa in the figure were reduced by an order of magnitude. It can be seen from the figure that the variations of the three kinds of frequency at σ0 = 2.5 MPa first decrease and then increase, with the change critical point of peak stress of 17.5 MPa, changing in a hook shape, which are consistent with the law under different loading rates. Under σ0 = 7.5 MPa, the variations of the three kinds of frequency show a bowl shape change, which first decrease and then increase, in which the low-frequency changes not obviously because of its small value. Under σ0 = 12.5 MPa, the changes of the three kinds of frequency become more complex, which are generally composed of two to three paraboloids, beginning with the decrease tend, ending with the decrease in the low-frequency and intermediate-frequency, ending with the increase in the high-frequency. This shows that the development process of particle and fracture in the earlier cycles reduce significantly, and the compression of fracture, the contact and extrusion of particles are restrained near the failure of rock, in which period the fracture expand vigorously.
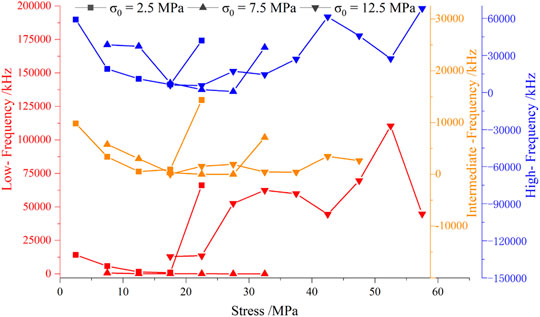
FIGURE 8. Variation of frequency value with peak stress in each frequency band under different initial stresses.
The number of frequency signals in the three frequency bands in Figure 7 and the amplitude attenuation value in the softening stage are recorded in Table 6. With the increase in initial stress, the amplitude attenuation value of the softening stage gradually decreases, and the intermediate-frequency signals also gradually decrease. This indicates that a higher initial stress inhibits the compaction behavior of fractures. Moreover, the high-frequency signals increase first and then decrease, and the low-frequency signals decrease and then increase. It is considered that there is a critical value of initial stress σm = 7.5 MPa. When σ0 < σm, the higher the initial stress, the more the extending behavior of fractures, and the less the extrusion behavior of particles. When σ0 > σm, the opposite of the above occurs.
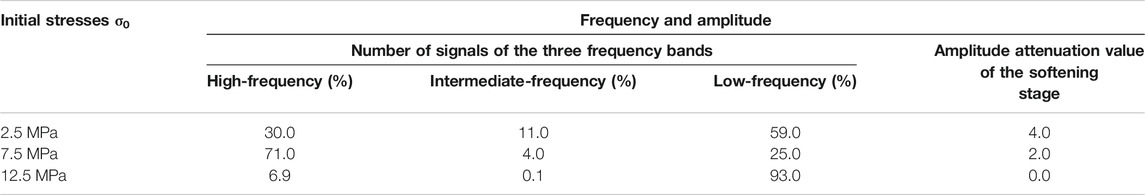
TABLE 6. Number of signals of the three frequency bands and amplitude attenuation value of the softening stage under different initial stresses.
Figure 9 shows the distribution of AE event amplitude and energy under different loading rates. It can be seen that under v = 0.15 mm/min, the distributions of amplitude and energy of rock were relatively dispersed, which mainly occurred in the three sections of 50–250, 500–700 and 1,000–1,180 s.
(1) In the first section (50–250 s), the energy was concentrated in a 10 s interval, and its value is very low, but the amplitude showed the law of dispersed change of decreasing first and then increasing, which shows that the internal lattice was moving back and forth, and when the movement accumulated to a certain extent, the energy was released concentratedly.
(2) In the second section (500–700 s), the energy also began to show a dispersed distribution, but the distribution of amplitude became dense, showing the law of increasing first and then decreasing, which is consistent with the stress change of loading first and then unloading, indicating that secondary fractures began to appear gradually in this section [23].
(3) In the third section (1,000–1,180 s), the energy and amplitude both increased first and then decreased. The maximum values were located at 1,080 s, which is the peak strength point of rock. Compared with other sections, the increase value of energy was far greater than the amplitude, which indicates that the large-scale fracture of saturated limestone was less when reaching the peak strength, only the sudden generation of many small-scale fractures leaded to the energy of rock was released concentratedly; the energy and amplitude decrease immediately after the peak strength point; at 1,180 s, the rock broke down, only the amplitude increased at that moment, but its value was lower than which at the peak strength point in terms of signal quantity and amplitude. The results also show that the energy increased suddenly from a very low value near 1,080 s, and the amplitude decreased first and then increased. Near 1,180 s, the rock was close to failure, and the energy showed a low value shortly after the peak strength (1,100 s), while the amplitude exhibited a trend of intermittent gradual decrease of 1,100 and 1,170 s.
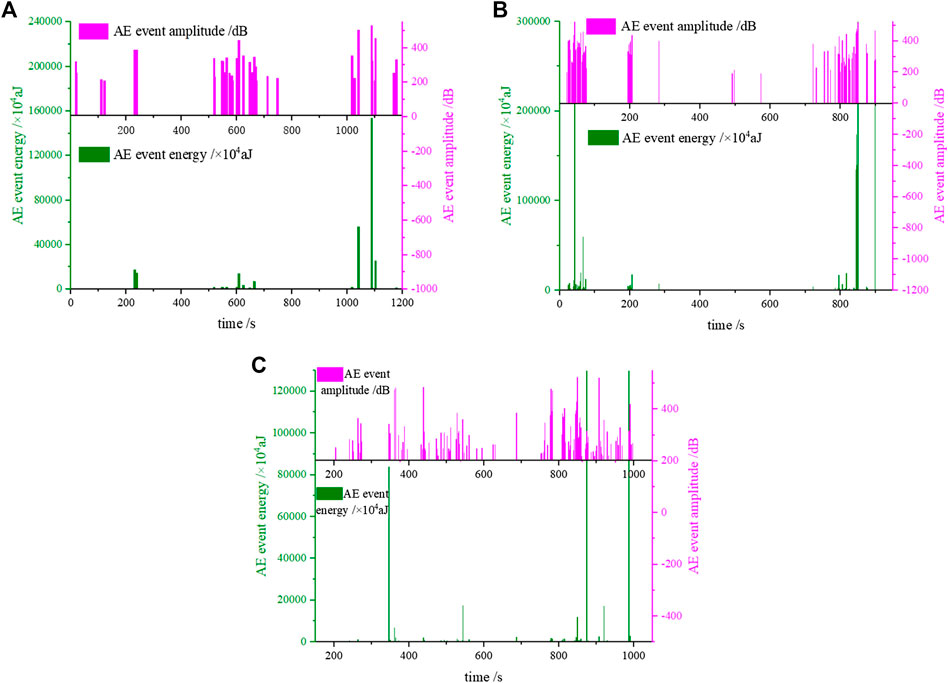
FIGURE 9. The distribution of AE event amplitude and energy under different loading rates. (A) v = 0.15 mm/min; (B) v = 0.2 mm/min; (C) v = 0.3 mm/min.
Under v = 0.2 mm/min, the variation of amplitude and energy of rock can be divided into two types as following.
(1) The first type is 20–80 and 720–900 s. The characteristics of the change is that the amplitude and energy all showed continuous change, and generally increased first and then decreased. Near 850 s (the stress is close to the peak strength), the amplitude showed the law of sparsity first and then densification, decrease first and then increase, and the energy value was sporadic distribution and not obvious. Near rock-failure point, the amplitude also exhibited a trend of intermittent decrease, and the energy exhibited a low value between the peak strength and the rock-failure point.
(2) The second type is 200–300 and 500–600 s. The characteristic of the change is: the amplitude and energy first exhibited a trend of gradual increase, then the signal disappears after reaching the maximum value, and then the signal appears again in the next 100 s, the amplitude and energy of which are slightly less than the previous maximum value.
Under v = 0.3 mm/min, the amplitude of rock showed a continuous change, exhibiting a “increase decrease increase” trend, and the energy was distributed dispersedly at 350, 550, 875 and 1,000 s. At 875 s (the peak strength), the energy increased greatly, reaching the maximum value of the whole loading and unloading process, while the amplitude decreased. It is considered via analysis that when the rock is loaded to the peak strength, due to the high loading rate, there was almost no chance of forming large-scale fractures that can control the rock-failure, which made the rock develop macro cracks extensively in a short time, therefore, quantities of energy was released in the rock, but the amplitude of the signals was not high. Near 875 s (the stress is close to the peak strength), the amplitude exhibited a “decrease-increase” trend, in which the “increase” process made the amplitude show the maximum value of the whole loading and unloading process, and some sporadic energy signals appeared near 875 s. Near 1,000 s, the rock was close to failure at that moment, the amplitude exhibited a continuous downward trend, however, the energy increased slightly during the period of peak strength point to the rock-failure point.
Based on the data of the distribution of AE event amplitude and energy under different loading rates, it can be seen that the AE event energy of saturated limestone decreased first and then increased during loading and unloading. Except for the amplitude value under v = 0.3 mm/min, the maximum values of amplitude and energy in the whole test all occurred at the peak strength. Near the peak strength point, the amplitude decreased first and then increased, and the energy value exhibited less and low. Near rock-failure point, the amplitude exhibited a downward trend, and the energy value also exhibited less and low. The law above can be used as the precursor information of reaching the peak strength point and rock-failure point. With the increase of loading rate, the change form of amplitude in whole test was changed from disperse to continuity. Near rock-failure point, the change trend of amplitude changed from intermittent decrease to continuous decrease, during the period, the occurrence time of low energy value changed from peak strength point to the middle time between peak strength point and rock-failure point.
Figure 10 shows the distribution of AE event amplitude and energy under different initial stresses. It can be seen that under σ0 = 2.5 MPa, 7.5 MPa, the amplitude and energy of rock exhibited a trend of decreasing first and then increasing, which was mainly composed of 4-6 sections, in which the amplitude was distributed in each section, however, the energy was only distributed in the first, second and last section. Near the peak strength point (850 s under σ0 = 2.5 MPa, 470 s under σ0 = 7.5 MPa), the amplitude of rock exhibited a trend of sparsity first and then densification, low first and then high, and the energy showed was not obvious. Near rock-failure point (900 s under σ0 = 2.5 MPa, and 490 s at σ0 = 7.5 MPa), the amplitude exhibited an intermittent decreasing trend, and the energy exhibited a very low value. Under σ0 = 12.5 MPa, the distribution of amplitude and energy became dense and concentrated, which concentrated at 200–1,300 and 1.900–2,000 s. Before 1,960 s in the test, the energy varies slightly. Near 1,960 s (peak strength point), the amplitude and energy exhibited a change law of “low-high-low”. Near 2,000 s, the rock is near rock-failure at that moment, but the amplitude and energy did not appear. It is considered via analysis that high initial stress made saturated limestone easier to show ductility, which made local rock block exhibit ductile failure at the peak strength point, triggering the adjustment of local stress, and further reduced the crack development near rock-failure [12].
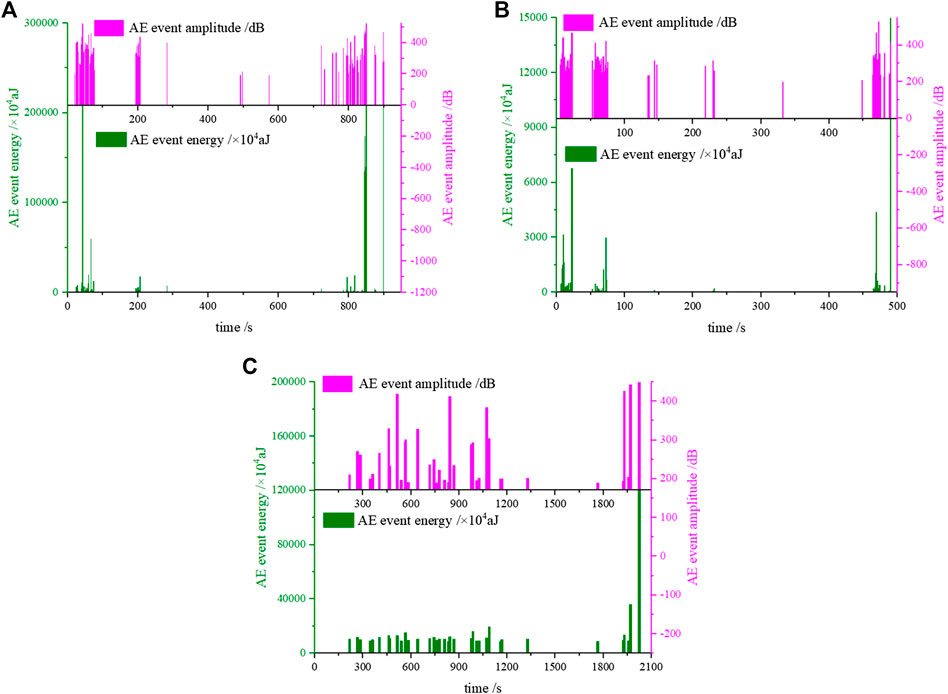
FIGURE 10. The distribution of AE event amplitude and energy under different initial stresses. (A) σ0 = 2.5 MPa; (B) σ0 = 7.5 MPa; (C) σ0 = 12.5 MPa.
According to the distribution data of AE event amplitude and energy under different initial stresses, it can be seen that the maximum value of amplitude of rock in the whole test all occurred at the peak strength point, and the maximum value of energy all occurred at the rock-failure point. Near peak strength point, with the increase of initial stress, the change trend of amplitude changed from “low-high” to “low-high-low” and the signal quantity is less and more concentrated, which indicates that the energy distribution characteristic changed from dispersed under low initial stress to concentrated under high initial stress; however, the energy remained calm all the time, which indicates that the failure form of saturated limestone was gradual. On the other hand, near rock-failure point, with the increase of initial stress, the change trend of amplitude changed from "intermittent gradual decrease" to " not appear,” which indicates that the rock-failure behavior and AE event evolution form changed from ductility to brittleness [25]. The phenomena above can be used as the precursory information of peak strength point and rock-failure point.
(1) With an increase in the loading rate and a decrease in the initial stress, the viscoplasticity of saturated limestone under loading and unloading is strengthened, the internal friction angle decreases, and the fragmentation during rock failure decreases. The failure mode changes from tensile failure to shear failure.
(2) During the loading and unloading, the intermediate-frequency signal shows a variation trend of sparse–dense–sparse and decreases with the increase in initial stress. However, the low-frequency signal is produced continuously and massively, and the amplitude attenuation value of the softening stage decreases with the increase in loading rate and initial stress.
(3) With an increase in the loading rate, the development trend of hits and energy becomes closer, and the maximum increase in hits is advanced. The variation form of ringing count changes from the former-N-type to U-type and latter-N-type, the slight increase period and attenuation period become longer, and the intense growth period and the postpeak calm period shorten. With the increase in initial stress, the felicity effect becomes better, and the variation of energy is more obvious near the failure than the hits. The variation form of the ringing count changes from U-type to W-type and N-type. Each period shortens first and then extends.
(4) With the process of loading and unloading, under a lower loading rate, the increase in hits and energy in the step and slow-change period increases continuously, and the duration of energy in the step and slow-change period increases gradually. With the increase in the loading rate, the variation trend of increase in the slow-change period tends to increase–decrease. In step, it tends to first increase–decrease and then gradually increase. With an increase in the initial stress, the variation trends of increase and duration of energy in the step and slow-change period all tend to decrease–increase.
(5) The increase and duration of hits in steps Ⅰ and Ⅱ exhibit the trend of increase–decrease with an increase in the loading rate, which exhibits a decreasing trend with an increase in the initial stress.
(6) The research results above bring the following enlightenment to the engineering site: for the deep surrounding rock which is eroded by groundwater for a long time, increasing the excavation speed and reducing the initial excavation footage, drilling strength can help to release the load in the form of deformation generally, and cause tension failure even burst not to occur easily and suddenly. With the progress of excavation, the compression behavior of surrounding rock fractures will appear a less-more-less change, so the support should be strengthened in the early and late period of excavation. With an increase in the excavation speed, the most period of rock fracture behavior will come in advance, and the synchronization of the change of rock fracture and its internal energy become better, but the duration of small fracture in the early stage become longer. Therefore, the roadway should be quickly excavated in the early stage, and slowly excavated after a certain period of time, so as to delay the most period of fracture behavior. In addition, if a roadway is already in excavating and the initial excavation footage is large, generally speaking, the changing extent of internal energy of surrounding rock is greater than that of fracture behavior, so the focus of safety monitoring should be transferred from crack inspection to rock deformation monitoring.
The raw data supporting the conclusions of this article will be made available by the authors, without undue reservation.
All authors listed have made a substantial, direct, and intellectual contribution to the work and approved it for publication.
This research was supported in part by Key Laboratory of Rock Mechanics and Geohazards of Zhejiang Province under Grant ZJRMG-2018-Z03; in part by the National Natural Science Foundation of China under Grant 51774323; and in part by the Fundamental Research Funds for the Central Universities of Central South University under Grant 2019zzts671.
The authors declare that the research was conducted in the absence of any commercial or financial relationships that could be construed as a potential conflict of interest.
1. Wang H, Yang TH, Liu HL, Zhao YC. Deformation and acoustic emission characteristics of dry and saturated sand under cyclic loading and unloading process. J North East Univ (Nat Sci) (2016). 37:1161–5. doi:10.3969/j.jssn.1005-3026.2016.08.020
2. Khandelwal M, Ranjith PG. Study of crack propagation in concrete under multiple loading rates by acoustic emission. Geomech Geophy. Geo-energ Geo-resour (2017). 3:393–404. doi:10.1007/s40948-017-0067-1
3. Sagar RV, Rao MVMS. An experimental study on loading rate effect on acoustic emission based b-values related to reinforced concrete fracture. Construct Build Mater (2014). 7:460–72. doi:10.1016/j.conbuildmat.2014.07.076
4. Cong Y, Wang ZQ, Zheng YR, Zhang LM. Experimental study on acoustic emission features of marbles during unloading failure process. J Southwest Jiao Tong Univ (2014). 49:97–104.
5. Meng Q, Zhang M, Han L, Pu H, Nie T. Effects of acoustic emission and energy evolution of rock specimens under the uniaxial cyclic loading and unloading compression. Rock Mech Rock Eng (2016). 49:1–14. doi:10.1007/s00603-016-1077-y
6. Li HR, Yang CH, Liu YG, Chen F, Ma HL. Experimental study of ultrasonic velocity and acoustic emission properties of salt rock under uniaxial compression load. Chin J Rock Mech Eng (2014). 33:2107–16.
7. Rodríguez P, Arab PB, Celestino TB. Characterization of rock cracking patterns in diametral compression tests by acoustic emission and petrographic analysis. Int J Rock Mech Min Sci (2016). 83:73–85. doi:10.1016/j.ijrmms.2015.12.017
8. He J, Pan JN, Wang AH. Acoustic emission characteristics of coal specimen under triaxial cyclic loading and unloading. J China Coal Soc (2014). 39:84–90. doi:10.13225/j.cnki.jccs.2013.0159
9. Song J, Li SC, Liu B, Yang L, Xu XJ, Nie LC, et al. Study on resistivity response law of limestone in processes of constant amplitude and tiered cyclic loading and unloading. Chin J Rock Mech Eng (2015). 34:3880–7. doi:10.13722/j.cnki.jrme.2014.1718
10. Deng CF, Liu JF, Chen L, Li Y, Xiang G. Mechanical behaviours and acoustic emission characteristics of fracture of granite under different moisture conditions. Chin J Geotech Eng (2017). 39:1538–44. doi:10.11779/cjge201708023
11.International Society for Rock Mechanics. Basic geotechnical description of rock masses. Int J Rock Mech Min Sci Geomech Abstr (1981). 18:85–110. doi:10.1016/0148-9062(81)90277-1
12. Yang DH, Zhao YX, Zhang C, Teng T, He X, Wang W, et al. Experimental study on the influence of cyclic loading on Kaiser effect of sedimentary rocks. Chin J Rock Mech Eng (2018). 37:2697–708. doi:10.13722/j.cnki.jrme.2018.0394
13. AlShebani MM, Sinha SN. Deformation characteristics of brick masonry due to partial unloading. Struct Eng Mech (2001). 11:565–74. doi:10.12989/sem.2001.11.5.565
14. Xiao XC, Ding X, Zhao X, Pan YS, Wang AW, Wang L. Experimental study on acoustic emission and charge signals during coal failure process at different loading rates. Rock Soil Mech (2017). 38:3419–26. doi:10.5772/33834
15. Su GS, Yan SZ, Yan ZF, Zhai SB, Yan LB. Evolution characteristics of acoustic emission in rockburst process under true-triaxial loading conditions. Rock Soil Mech (2019). 40:1673–82.
16. Liu XS, Ning JG, Tan YL, Gu QH. Damage constitutive model based on energy dissipation for intact rock subjected to cyclic loading. Int J Rock Mech Min Sci (2016). 85:27–32. doi:10.1016/j.ijrmms.2016.03.003
17. Chen W, Konietaky H, Tan X, Frühwirt T. Pre-failure damage analysis for brittle rocks under triaxial compression. Comput Geotech (2016). 74:45–55. doi:10.1016/j.compgeo.2015.11.018
18. Kong B, Wang EY, Li ZH, Wang XR, Niu Y, Kong XG. Acoustic emission signals frequency-amplitude characteristics of sandstone after thermal treated under uniaxial compression. J Appl Geophys (2017). 136:190–7. doi:10.1016/j.jappgeo.2016.11.008
19. Ohnaka M, Mogi KJ. Frequency characteristics of acoustic emission in rocks under uniaxial compression and its relation to the fracturing process to failure. Geophys. Res. (1982). 87:3873–84. doi:10.1029/jb087ib05p03873
20. Mavko G, Mukerji T, Dvorkin J. The rock physics handbook: tools for seismic analysis of porous media. Cambridge, UK: Cambridge University Press (2003). p. 339.
21. Raymer LL. An improved sonic transit time-to-porosity transform. Trans. Soc. Prof. Well Log Anal., Ann. Logging Symp. (1980). 1–13.
22. Goodfellow SD, Tisato N, Ghofranitabari M, Nasseri MHB, Young RP. Attenuation properties of fontainebleau sandstone during true-triaxial deformation using active and passive ultrasonics. Rock Mech Rock Eng (2015). 48:2551–66. doi:10.1007/s00603-015-0833-8
23. Wang CY, Chang XK, Liu YL, Chen SJ. Mechanistic characteristics of double dominant frequencies of acoustic emission signals in the entire fracture process of fine sandstone. Energies (2019). 12. doi:10.3390/en12203959
24. Su ZD, Sun JZ, Xia J, Wu CL. Research on effects of freeze-thaw cycles on acoustic emission characteristics of granite. Chin J Rock Mech Eng (2019). 38:865–74. doi:10.13722/j.cnki.jrme.2018.0953
25. Yang HM, Wen GC, Hu QT, Li YY, Dai LC. Experimental investigation on influence factors of acoustic emission activity in coal failure process. Energies (2018). 11. doi:10.3390/en11061414
26. Dong LJ, Hu QC, Tong XJ, Liu YF. Velocity‐free MS/AE source location method for three‐dimensional hole‐containing structures. Engineering (2020). 6(7):827–834. https://doi.org/10.1016/j.eng.2019.12.016.
Keywords: cyclic loading and unloading, loading rate, initial stress, acoustic emission characteristics, step characteristics, localization, frequency and amplitude
Citation: Li J, Hong L, Zhou K, Xia C and Zhu L (2020) Limestone Acoustic Emission Evolution Characteristics Under Different Experimental Loading and Unloading Conditions. Front. Phys. 8:590710. doi: 10.3389/fphy.2020.590710
Received: 02 August 2020; Accepted: 04 November 2020;
Published: 04 December 2020.
Edited by:
Wei Wu, Nanyang Technological University, SingaporeReviewed by:
Jiangfeng Liu, China University of Mining and Technology, ChinaCopyright © 2020 Li, Hong, Zhou, Xia and Zhu. This is an open-access article distributed under the terms of the Creative Commons Attribution License (CC BY). The use, distribution or reproduction in other forums is permitted, provided the original author(s) and the copyright owner(s) are credited and that the original publication in this journal is cited, in accordance with accepted academic practice. No use, distribution or reproduction is permitted which does not comply with these terms.
*Correspondence: Caichu Xia, eGlhY2FpY2h1QHRvbmdqaS5lZHUuY24=; Jielin Li, bGlqaWVsaW5AMTYzLmNvbQ==
Disclaimer: All claims expressed in this article are solely those of the authors and do not necessarily represent those of their affiliated organizations, or those of the publisher, the editors and the reviewers. Any product that may be evaluated in this article or claim that may be made by its manufacturer is not guaranteed or endorsed by the publisher.
Research integrity at Frontiers
Learn more about the work of our research integrity team to safeguard the quality of each article we publish.