- Laboratoire Interdisciplinaire Carnot de Bourgogne, UMR 6303 CNRS-Université Bourgogne-Franche Comté, 21000 Dijon, France
We report on experimental results where a temporal intensity profile presenting some of the main signatures of the Peregrine soliton (PS) is observed. However, the emergence of a highly peaked structure over a continuous background in a normally dispersive fiber cannot be linked to any PS dynamics and is mainly ascribed to the impact of Brillouin backscattering.
Introduction
Peregrine soliton (PS) or breather that was initially analytically derived by H. Peregrine [1] has since its first experimental demonstration in a physical system in 2010 [2] generated a very large number of experimental and theoretical studies driven primarily by the search for extreme events [3]. Therefore this coherent structure presenting temporal and spatial localizations has been extensively investigated first in the field of fiber optics [2, 4] and then in the hydrodynamic domain [5] and multicomponent plasmas [6]. In optics, PS is a rational solution of the nonlinear Schrodinger equation (NLSE) that describes the evolution of light in a fiber with focusing nonlinearity: the combination of anomalous dispersion and self-phase modulation induced by Kerr nonlinearity leads to the emergence of a wave that appears from nowhere and disappears without leaving a trace [3]. The list of the fiber-based nonlinear processes that are linked to the PS evolution is a long one and includes the modulation instability [7], the propagation of turbulent fields [8-10], the initial stage of temporal compression of higher-order soliton pulses [11], the focusing of super-Gaussian structures [12], the generation of ultrashort structures [13]… Peregrine-like structures have also more recently been observed in other photonic systems that may deviate from the simple NLSE framework. Indeed, PS or breather features have been experimentally or theoretically reported in lasers [14], optical cavities [15], metamaterials [16], quadratic or photorefractive media [17, 18].
In this present brief report, we discuss a simple experimental fiber-based configuration where temporal intensity profiles presenting several signatures of the PS waveform are recorded. However, we demonstrate that even if intriguing similarities may exist, the observed coherent structure must be carefully analyzed and we conclude that our observations should not be straightforwardly associated with a PS dynamics.
Method
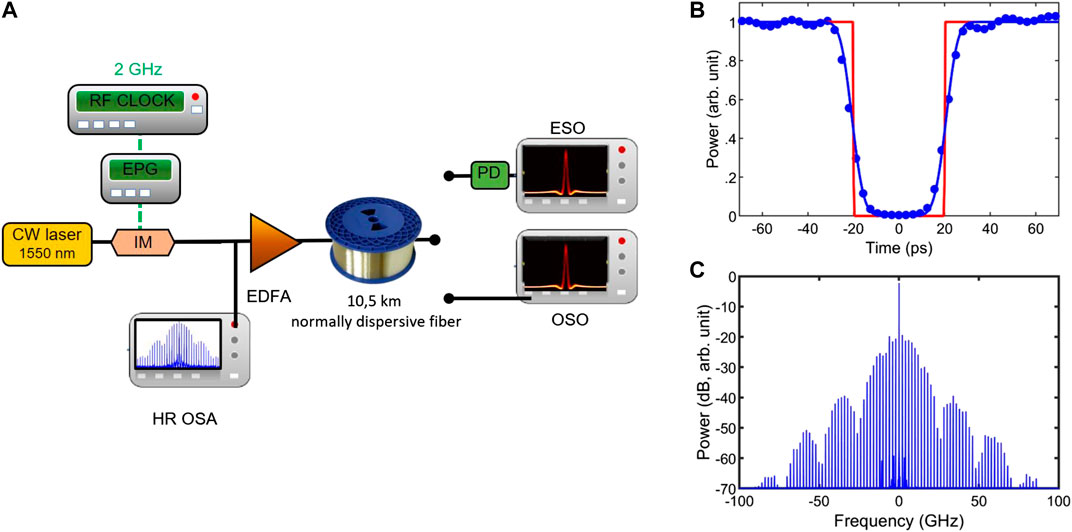
The experimental setup we implemented is sketched in Figure 1A and relies on devices from the telecommunication industry that are commercially available. A continuous wave at 1,550 nm is first intensity modulated thanks to a lithium niobate modulator operating at its point of maximum transmission and driven by an electrical pulse generator that delivers super-Gaussian pulses at a repetition rate of 2 GHz. The resulting temporal intensity profile is plotted in Figure 1B and is a continuous wave where light has been switched off for a duration of 40 ps. Particular care has been devoted to the optimization of the extinction ratio in order to prevent parasitic interference between a residual unwanted background and the main structures [19]. The temporal profile can be well fitted by an inverted second-order super-Gaussian pulse. Its spectrum is recorded on a high-resolution optical spectrum analyzer (see Figure 1C) and exhibits a high signal-to-noise ratio as well as a high level of symmetry and coherence degree (the spectral linewidth of the components being below the resolution of the optical spectral analyzer, i.e., 5 MHz). The signal is then amplified thanks to a low-noise erbium-doped fiber amplifier that delivers an average power that can be continuously tuned from 10 dBm up to 23 dBm. Propagation occurs in a single spool of 10.5 km of dispersion-shifted fiber with normal dispersion (second-order dispersion β2 of 19 ps2/km and a nonlinear coefficient γ of 2/W/km). After propagation, the signal is analyzed with a photodiode and a high-speed sampling oscilloscope (electrical bandwidth of 50 GHz) as well as with an optical sampling oscilloscope.

FIGURE 1. (A) Experimental setup: CW: continuous wave; IM: intensity modulator; EDFA: erbium-doped fiber amplifier; OSO: optical sampling oscilloscope; PD: photodiode; ESO: electrical sampling oscilloscope; HR OSA: high-resolution optical spectrum analyzer. (B) Temporal intensity profile of the input pulse. Experimental results (circles) are fitted with an inverted super-Gaussian pulse (blue solid line) and compared with an ideal rectangular waveform (red). (C) Experimental optical spectrum of the input pulse.
Light propagation in a single-mode fiber can be described by the NLSE that also includes losses. The evolution of the complex scalar field ψ(t, z) in the slowly varying approximation is therefore governed by Ref. 20:
with z and t being the longitudinal and temporal coordinates, respectively. α is a coefficient of optical losses. This equation can be numerically solved by the widely used split-step Fourier algorithm [20]. When light propagates in an anomalous dispersive fiber, one of the solutions of the loss-free NLSE is the PS which temporal profile ψS(τ) at the point of maximum focusing is described by the following typical rational solution:
where ψS is the field normalized with respect to the continuous background and τ a normalized time depending on the system parameters.
Results
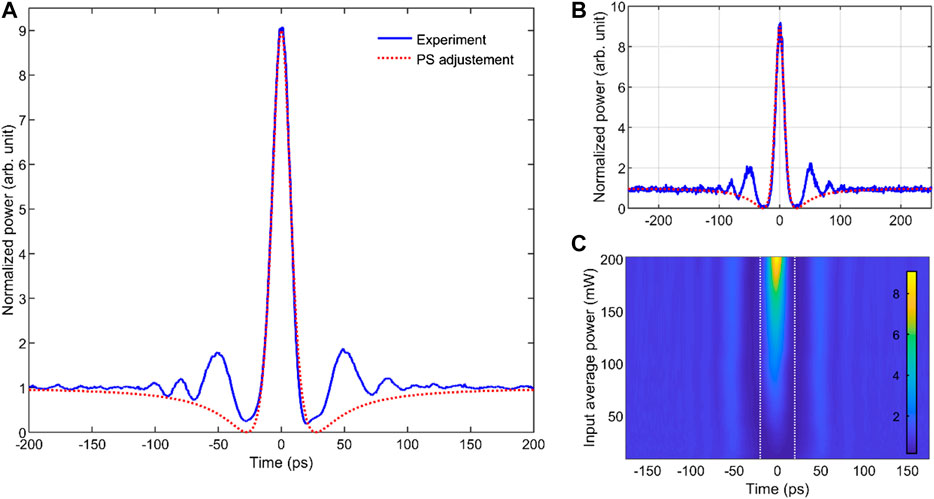
The temporal output profile recorded on a high-speed sampling oscilloscope for the highest input power available is plotted in Figure 2A (solid blue line). For this power, the initial 40 ps dip of light has significantly reshaped into a highly peaked structure having a temporal duration at half-maximum of 16.6 ps. The highly symmetric intensity profile goes down to a minimum value at t = ±28 ps and lies on a continuous background, that is, nine times weaker than the peak intensity. Results recorded independently on an optical sampling oscilloscope (Figure 2B) fully confirm these features of the intensity profile and stress that the minimum value of the wave is close to zero. The overall profile can be adjusted by the typical temporal intensity waveform of the PS at the point of maximum compression (Eq. 2, with τ adjusted to fit the experimental data, red dotted lines). Such a similarity is deeply intriguing as PS are supposed to exclusively exist in presence of focusing nonlinearity, i.e., in the anomalous regime of dispersion. The evolution of the output profile according to the input power is summarized in Figure 2C. It confirms that the ratio R of the peak-power/continuous background continuously increases with the input power, similarly to what can be usually observed with breathers in the initial stage of the growth and decay cycle.

FIGURE 2. (A) Experimental output temporal profile recorded on the ESO (blue line) compared with a fit by the PS waveform (Eq. 2, red dotted line). Input average power is 23 dBm. (B) Same as (A) but recorded on the OSO. (C) Evolution of the temporal intensity profile according to the input power. Intensity profiles are normalized by the intensity of the output continuous background. The white dashed line indicates the temporal location of the sharp edges of the input waveform.
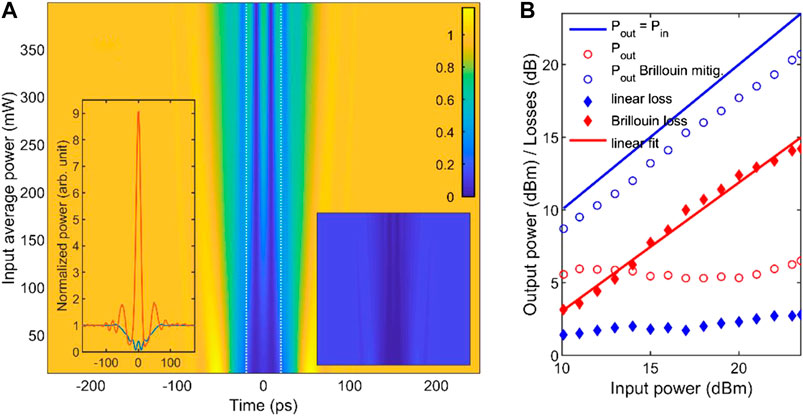
In order to confirm the experimentally recorded dynamics, we have run numerical simulations based on the NLSE (Eq. 1) including linear constant losses of 0.25 dB/km. The evolution of the output intensity profile according to the input power is summarized in Figure 3A. It is clear that the NLSE in its simplest form completely fails to reproduce the main experimental findings (see also the right and left insets for a direct comparison with the experimental results). The differences are so high that the NLSE cannot even be considered as a zero-order approximation giving a qualitative trend. A moderate bump is visible at the center of the waveform and can be interpreted as the temporal analog of the Arago spot as we have detailed in Ref. 21. However, its amplitude is well below the amplitude of the continuous wave. Even if its level increases with input power, numerical simulations ran for input powers up to 26 dBm do not predict any R above 1. This inability of the usual NLSE model to provide even qualitative insights on the pulse dynamics forces us to reconsider the validity of the various assumptions made and to rethink our model.

FIGURE 3. (A) Numerical simulations of the power-dependent output temporal intensity profiles based on the NLSE including constant losses. Intensity profiles are normalized by the intensity of the output continuous background. Left inset: comparison of the experimental and numerical results (red and blue lines, respectively) obtained for an input average power of 200 mW. Right inset: numerical results plotted with the same temporal and power ranges as Figure 2C and with the same color scale. (B) Experimental measurement of the output average power (circles) according to the input average power. Results without any Brillouin mitigation (red circles) are compared with results when mitigation is applied (blue circles). Diamonds represent the level of losses, that is, experienced: linear losses (blue diamonds) and nonlinear losses (red diamonds). The evolution of the experimental nonlinear losses according to the input power is fitted by a linear trend (solid red line).
Discussion
In order to better understand the physical origin of the major discrepancy between the numerical predictions and the experimental data, we recorded the output average power according to the input power. The results are reported in Figure 3B and outline that the assumption of a constant level of loss severely fails. Indeed, whereas the input power is increased by one order of magnitude, the output power remains more or less constant. This indicates that the losses grow continuously with power. Those extra-losses are ascribed to Brillouin backscattering [20, 22–24] induced by the constant background. Indeed, estimating the Brillouin threshold with the formula
In order to take into account these extra losses in a very simple and empirical way, we have plotted in Figure 3B with red diamonds the difference between the output power when Brillouin mitigation is applied and when no mitigation is involved. The experimental evolution of these extra losses is found to follow as a first approximation a linear trend (see linear fit, red line, losses and power expressed in dB). The optical spectrum of our input condition (Figure 1C) reveals that the main central component has a spectral intensity, that is, more than 20 dB higher than the other components. Consequently, we may assume that Brillouin backscattering will very predominantly be induced by the CW component and will in return only deplete this component. In our experiment, we have not observed clear signatures of a double-Brillouin effect on the co-propagating wave so that we can also neglect as a first approximation double Brillouin backscattering and do not need to take into account the details of the Brillouin frequency gain.
In order to take into account the experimentally observed trends in a simple way, we also assume for the sake of simplicity that the losses accumulated over propagation can be considered as distributed losses. For the range of power we study (i.e., input powers above the Brillouin threshold), all these assumptions result in the power and frequency dependent description of the losses as:
where α0 is the level of linear losses, ω the angular frequency and A, B coefficients extracted from the experimental measurements that can be linked to the Brillouin gain and threshold.
Note that our goal in this brief report is not to perform a detailed and accurate modeling of the Brillouin gain properties of fiber under investigation, but rather to identify the key elements that qualitatively explain our dynamics. Therefore, we have not tried to develop complete and accurate simulations of the interactions of the signal with the Brillouin wave [24]. As such a modeling requires the simulation of at least two counter-propagating waves, it may become quickly a long dedicated work that does not correspond to the target of this brief report.
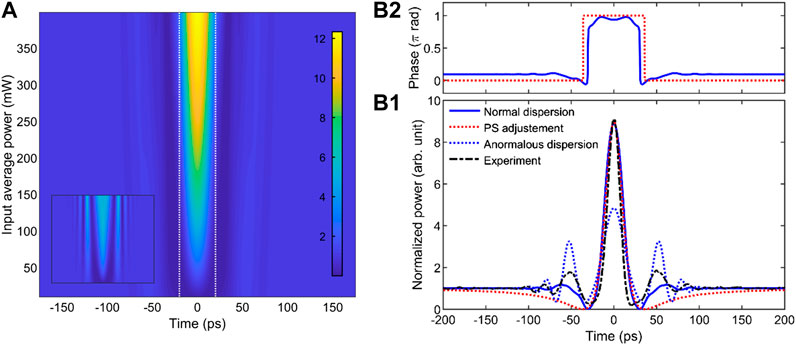
Results obtained with our experiment-inspired description of the losses plugged into the NLSE are reported in Figure 4A where we can make out the major differences compared to Figure 3A. A peak emerges from the central part and the ratio R between the peak power of the central structure and the continuous background is now clearly well above 1. The various trends recorded experimentally (Figure 2C) become well captured by the numerical simulations. The inset of Figure 4A shows results of the same simulations run with parameters of a virtual fiber having a dispersion coefficient opposite to the normally dispersive fiber under investigation (β2 of −19 ps2/km, all other parameters being kept identical). In this case, the central structure is much less pronounced, in agreement with the impact of the nonlinearity on the evolution of the temporal Arago spot [21].

FIGURE 4. (A) Numerical simulations of the output temporal intensity profiles based on the NLSE including power-dependent losses due to Brillouin backscattering. Intensity profiles are normalized by the intensity of the output continuous background. Inset shows the results obtained in a virtual fiber with opposite dispersion. (B). Details of the temporal intensity and phase profiles (panel (B1) and (B2), respectively) obtained for an input power of 23 dBm: numerical simulations of the propagation in the fiber with normal dispersion (blue line, nonlinear losses included) are compared with a fit with a PS waveform (dotted red line). The blue dotted line represents the results predicted with a virtual anomalously dispersive fiber (nonlinear losses included). The mixed black line recalls the experimental results.
Details of the temporal profile simulated in the normal regime of dispersion are provided in Figure 4B for an input average power of 23 dBm and confirm the ratio of nine between the peak intensity and the continuous background. Once again, the overall temporal intensity profile can be well fitted with the PS typical waveform and it is found that the intensity goes down to zero. However, some limits of our empirical and approximate description of the attenuation are also apparent such as its inability to retrieve quantitatively the pronounced oscillations surrounding the central peak. As a consequence, we cannot unambiguously identify the physical nature of the ripples observed on top of the continuous wave.
The numerical simulations also enable us to get access to the phase profile (Figure 4B2). Quite surprisingly, the observed phase profile also presents similarities with the phase profile of a PS, that is, characterized by a phase jump of π at the minimum of the intensity profile [28]. Profile simulated for propagation in the anomalous profile with nonlinear losses is also included and stresses that the combination of Kerr nonlinearity with dispersion affects the nonlinear dynamics even when Brillouin backscattering is a dominant effect. The focusing regime leads to a central peak with an amplitude, that is, underestimated whereas the two surrounding ripples are increased compared to the experiment.
From the numerical results based on our basic empirical description of the nonlinear losses, we can deduce that the physics involved in the emergence of the spiky structure is extremely different from the one involved in the PS dynamics. Contrary to the PS case where the wave emerges from the interaction of self-phase modulation and anomalous dispersion, the crucial component in our study is Brillouin scattering that depletes the continuous background and consequently increases the ratio R. In this context, normalization by the value of the continuous background may distort the interpretation as it gives the feeling that a strong peak emerges from an energy focusing process whereas the main effect is the drop of the value of the continuous background. One may also note that the coherent structure under investigation will not experience the growth-and-decay cycle typical of the PS and values of R above nine can be recorded as observed in Figure 4A with R = 12 for P0 = 400 mW. We can finally notice that contrary to the usual PS which temporal width decreases in the stage of temporal compression, both in experiments as well as in the numerics, the temporal duration of the central peak is not severely influenced by the input power, confirming that the underlying dynamics is very different.
Conclusion
To conclude, we have described an experimental configuration where several features of the Peregrine soliton seem to be reproduced during the propagation of a temporal hole of light in a fiber with normal dispersion. However, we demonstrate that despite these observed signatures, the physics, that is, involved is radically different and is essentially ascribed to the Brillouin backscattering that depletes the continuous background. With this example as well as another work dealing with breathers’ features [29], we stress that great care should always be devoted when trying to identify the nature of coherent structures in an experimental record. A deep understanding of the underlying physical dynamics is required before claiming that extreme structures such as Peregrine solitons are observed in a system. In this context, numerical simulations are of great help. For the problem under investigation, whereas the standard NLSE was unable to retrieve the experimental features, adding nonlinear losses that only affect the continuous component was sufficient to qualitatively reproduce the influence of the input power on the output field. Finally, note that in a recent contribution, we have numerically stressed that PS could be observed in a similar configuration when the intensity modulation is replaced by a phase modulation [30].
Data Availability Statement
The raw data supporting the conclusions of this article will be made available by the authors, without undue reservation.
Author Contributions
CF: Conceptualization, Methodology, Investigation, Validation, Writing, Project administration.
Funding
We acknowledge the financial support of the Institut Universitaire de France (IUF) and the Bourgogne-Franche Comté Region.
Conflict of Interest
The author declares that the research was conducted in the absence of any commercial or financial relationships that could be construed as a potential conflict of interest.
Acknowledgments
The research work has benefited from the PICASSO experimental platform of the University of Burgundy.
References
1. Peregrine H. Water waves, nonlinear Schrödinger equations and their solutions. J Austral Math Soc Ser B (1983) 25:16–43. doi:10.1017/S0334270000003891
2. Kibler B, Fatome J, Finot C, Millot G, Dias F, Genty G, et al. The Peregrine soliton in nonlinear fibre optics. Nat Phys (2010) 6:790–5. doi:10.1038/nphys1740
3. Akhmediev N, Ankiewicz A, Taki M. Waves that appear from nowhere and disappear without a trace. Phys Lett (2009) 373:675–8. doi:10.1016/j.physleta.2008.12.036
4. Hammani K, Kibler B, Finot C, Morin P, Fatome J, Dudley JM, et al. Peregrine soliton generation and breakup in standard telecommunications fiber. Opt Lett (2011) 36:112–4. doi:10.1364/OL.36.000112
5. Chabchoub A, Hoffmann NP, Akhmediev N. Rogue wave observation in a water wave tank. Phys Rev Lett (2011) 106:204502. doi:10.1103/PhysRevLett.106.204502
6. Bailung H, Sharma SK, Nakamura Y. Observation of Peregrine solitons in a multicomponent plasma with negative ions. Phys Rev Lett (2011) 107:255005. doi:10.1103/PhysRevLett.107.255005
7. Dudley JM, Genty G, Dias F, Kibler B, Akhmediev N. Modulation instability, Akhmediev Breathers and continuous wave supercontinuum generation. Opt Express (2009) 17:21497–508. doi:10.1364/OE.17.021497
8. Kibler B, Hammani K, Michel C, Finot C, Picozzi A. Rogue waves, rational solitons and wave turbulence theory. Phys Lett A (2011) 375:3149–55. doi:10.1016/j.physleta.2011.07.006
9. Tikan A, Bielawski S, Szwaj C, Randoux S, Suret P. Single-shot measurement of phase and amplitude by using a heterodyne time-lens system and ultrafast digital time-holography. Nat Photon (2018) 12:228–34. doi:10.1038/s41566-018-0113-8
10. Toenger S, Godin T, Billet C, Dias F, Erkintalo M, Genty G, et al. Emergent rogue wave structures and statistics in spontaneous modulation instability. Sci Rep (2015) 5:10380. doi:10.1038/srep10380
11. Tikan A, Billet C, El GA, Tovbis A, Bertola M, Sylvestre T, et al. Universality of the peregrine soliton in the focusing dynamics of the cubic nonlinear schrödinger equation. Phys Rev Lett (2017) 119:033901. doi:10.1103/PhysRevLett.119.033901
12. Audo F, Kibler B, Fatome J, Finot C. Experimental observation of the emergence of Peregrine-like events in focusing dam break flows. Opt Lett. (2018) 43:2864–7. doi:10.1364/OL.43.002864
13. Fatome J, Kibler B, Finot C. High-quality optical pulse train generator based on solitons on finite background. Opt Lett (2013) 38:1663–5. doi:10.1364/OL.38.001663
14. Hu X, Guo J, Song YF, Zhao LM, Li L, Tang DY. Dissipative pergrine solitons in fiber lasers. J Phys Photonics (2020) 2:034011. doi:10.1088/2515-7647/ab95f3
15. Bao C, Jaramillo-Villegas JA, Xuan Y, Leaird DE, Qi M, Weiner AM. Observation of fermi-pasta-ulam recurrence induced by breather solitons in an optical microresonator. Phys Rev Lett (2016) 117:163901. doi:10.1103/physrevlett.117.163901
16. Xu G, McNiff J, Boardman A, Kibler B. Space-time evolution of optical breathers and modulation instability patterns in metamaterial waveguides. Wave Motion (2020) 93:102448. doi:10.1016/j.wavemoti.2019.102448
17. Schiek R, Baronio F. Spatial Akhmediev breathers and modulation instability growth-decay cycles in a quadratic optical medium. Phys Rev Res (2019) 1:032036. doi:10.1103/physrevresearch.1.032036
18. Marcucci G, Pierangeli D, Agranat AJ, Lee RK, DelRe E, Conti C. Topological control of extreme waves. Nat Commun (2019) 10:5090. doi:10.1038/s41467-019–12815-0
19. Parriaux A, Conforti M, Bendahmane A, Fatome J, Finot C, Trillo S, et al. Spectral broadening of picosecond pulses forming dispersive shock waves in optical fibers. Opt Lett (2017) 42:3044–7. doi:10.1364/OL.42.003044
21. Finot C, Rigneault H. Arago spot formation in the time domain. J Opt (2019) 21:105504. doi:10.1088/2040-8986/ab4105
22. Damzen MJ, Vlad V, Mocofanescu A, Babin V. Stimulated Brillouin scattering: fundamentals and applications. CRC Press (2003)
23. Ippen EP, Stolen RH. Stimulated Brillouin scattering in optical fibers. Appl Phys Lett. (1972) 21:539–41. doi:10.1063/1.1654249
24. Kobyakov A, Sauer M, Chowdhury D. Stimulated Brillouin scattering in optical fibers. Adv Opt Photon. (2010) 2:1–59. doi:10.1364/AOP.2.000001
25. Finot C. Optical pulse doublet resulting from the nonlinear splitting of a super-Gaussian pulse. Laser Phys Lett. (2020) 17:025103. doi:10.1088/1612-202X/ab66c3
26. Hanzard P-H, Talbi M, Mallek D, Kellou A, Leblond H, Sanchez F, et al. Brillouin scattering-induced rogue waves in self-pulsing fiber lasers. Sci Rep. (2017) 7:45868. doi:10.1038/srep45868
27. Boukhaoui D, Mallek D, Kellou A, Leblond H, Sanchez F, Godin T, et al. Influence of higher-order stimulated Brillouin scattering on the occurrence of extreme events in self-pulsing fiber lasers. Phys Rev A. (2019) 100:013809. doi:10.1103/PhysRevA.100.013809
28. Xu G, Hammani K, Chabchoub A, Dudley JM, Kibler B, Finot C. Phase evolution of Peregrine-like breathers in optics and hydrodynamics. Phys Rev E. (2019) 99:012207. doi:10.1103/PhysRevE.99.012207
PubMed Abstract | CrossRef Full Text CrossRef Full Text | Google Scholar
29. Andral U, Kibler B, Dudley JM, Finot C. Akhmediev breather signatures from dispersive propagation of a periodically phase-modulated continuous wave. Wave Motion. (2020) 95:1025–45. doi:10.1016/j.wavemoti.2020.102545
Keywords: peregrine soliton, optical fiber, nonlinear propagation, brillouin scattering, ultrashort pulses
Citation: Finot C (2021) A Peregrine Soliton-Like Structure That Has Nothing to Deal With a Peregrine Breather. Front. Phys. 8:590415. doi: 10.3389/fphy.2020.590415
Received: 01 August 2020; Accepted: 28 October 2020;
Published: 14 January 2021.
Edited by:
Heremba Bailung, Ministry of Science and Technology (India), IndiaReviewed by:
PIerre Suret, Université de Lille, FranceSupriyo Bandyopadhyay, Virginia Commonwealth University, United States
Copyright © 2021 Finot. This is an open-access article distributed under the terms of the Creative Commons Attribution License (CC BY). The use, distribution or reproduction in other forums is permitted, provided the original author(s) and the copyright owner(s) are credited and that the original publication in this journal is cited, in accordance with accepted academic practice. No use, distribution or reproduction is permitted which does not comply with these terms.
*Correspondence: Christophe Finot, Y2hyaXN0b3BoZS5maW5vdEB1LWJvdXJnb2duZS5mcg==;
 Christophe Finot