 Zhiqiang Chen1,2*
 Siyuan Zhang
 Liang Li
94% of researchers rate our articles as excellent or good
Learn more about the work of our research integrity team to safeguard the quality of each article we publish.
Find out more
ORIGINAL RESEARCH article
Front. Phys. , 29 October 2020
Sec. Medical Physics and Imaging
Volume 8 - 2020 | https://doi.org/10.3389/fphy.2020.587625
This article is part of the Research Topic Energy-Sensitive X-Ray Computed Tomography Imaging View all 9 articles
X-ray fluorescence computed tomography (XFCT) is a high-sensitivity imaging modality for high-atomic elements such as gadolinium (Gd) or gold (Au). In order to improve the contrast of x-ray fluorescence (XRF) signals in the raw projection data, common XFCT systems use single-pixel x-ray spectrometers to record XRF photons stimulated by the pencil-beam x-ray source and achieve line-by-line scan of the whole object by translating the x-ray source or the object. However, this kind of design results in waiting time of the translation device. One improvement would be to replace the traditional x-ray tube with a spatially distributed multi-beam x-ray source and scan the whole object by switching the exposure of each focus. In this study, we present a design of the XFCT system using a spatially distributed multi-beam source, and a XFCT imaging experiment was performed to investigate its feasibility. Each cold cathode of the x-ray source used in this study was made of carbon nanotubes, and each focus was independently controlled by the electronic control system. The incident beam was collimated by a pinhole array to produce a pencil-beam source. The object scanned by the system was a polymethyl methacrylate (PMMA) cylinder (8 cm in diameter) with Gd (20 mg/ml) and I (100 mg/ml) insertions. Results show that the distribution of iodine (I) and Gd in a PMMA phantom was successfully reconstructed, but the imaging performance was limited by the collimation and exposure mode of the current distributed x-ray source. The practicality of the current distributed x-ray source used for XFCT scan and further optimization of the proposed system are discussed according to the experimental results.
X-ray fluorescence computed tomography (XFCT), which detects the characteristic x-rays emitted from the target element, is a high-sensitivity imaging modality for high-atomic elements such as gadolinium (Gd) or gold (Au). As the signal of XFCT is independent from background tissues, the concentration distribution of the target element obtained by XFCT has lower background noise and higher contrast than the traditional transmission CT [1, 2]. Therefore, XFCT has been considered as a promising approach for applications of imaging of certain elements with low concentration, such as in vivo imaging of nanoparticle probes [3–7].
Early studies of XFCT experiments often use synchrotron beams to stimulate x-ray fluorescence (XRF) photons [8]. The x-ray beam produced by the synchrotron beam is monochromatic and linear polarized so that the energy of incident photons can be adjusted to maximize the fluorescence field, and the Compton scattered background can be effectively reduced by optimizing the detection angle [9–11]. However, the research and application of XFCT based on synchrotron is limited by its requirement of space and cost. Although synchrotron beam is the ideal source for XFCT, researchers focus more on the XFCT system based on conventional x-ray tubes in recent years [12–15].
In order to improve the contrast of x-ray fluorescence (XRF) signals in the raw projection data, common XFCT systems use single-pixel x-ray spectrometers to record XRF photons stimulated by the pencil-beam x-ray source and achieve line-by-line scan of the whole object by translating the incident beam or the rotation stage [16–19]. Another kind of system design is to use a cone-beam source to irradiate the whole object and then use the panel detector with pinhole collimation to record the intensity and spatial information of XRF photons [20–24]. Compared with the linear design, the projection data obtained by the first kind of system have higher sensitivity and lower scattered background due to the high-energy resolution of the spectrometer. However, this kind of scan strategy results in waiting time of the translation device.
One improvement would be to replace the traditional x-ray tube with the spatially distributed multi-beam x-ray source [25–27] and scan the whole object by switching the exposure of each focus. Stationary CT technique using the distributed x-ray source, as well as its application on a transmission CT field such as baggage inspection, is now in rapid development due to its higher scanning speed than that of traditional spiral CT [28–30]. To our knowledge, relevant research report about XFCT using the spatially distributed multi-beam x-ray source has not been previously published. Therefore, a design of the XFCT system using the spatially distributed multi-beam source in this study and a XFCT imaging experiment was performed to investigate its feasibility.
Each cold cathode of the x-ray source used in the experimental device was made of carbon nanotubes, and each focus was independently controlled by the electronic control system. The incident beam was collimated by a pinhole array to produce a pencil-beam source. The object scanned by the system was a polymethyl methacrylate (PMMA) cylinder (8 cm in diameter) with Gd (20 mg/ml) and iodine (I) (100 mg/ml) insertions. The spectrum of projection data was recorded by a single-pixel x-ray spectrometer. Results show that the distribution of I and Gd in a PMMA phantom was successfully reconstructed, but the imaging performance was limited by the collimation and exposure mode of the current distributed x-ray source. The practicality of the current distributed x-ray source used for XFCT scan and further optimization of the proposed system are discussed according to the experimental results.
The structure of the x-ray source [31] used in this study is shown in Figure 1A. Multiple anodes are integrated in one vacuum chamber. Common x-ray tubes with single focus produce electron beams through the hot cathode, which results in high difficulty of integration and slow start. Therefore, the material of each cold cathode in this study is carbon nanotubes, which enables rapid switching of start–stop. The anode material is tungsten, and the spectrum is the same as the bremsstrahlung spectrum produced by conventional x-ray tubes with tungsten anodes. The x-ray exposure of each cathode–anode component is controlled by the corresponding electronic control system.
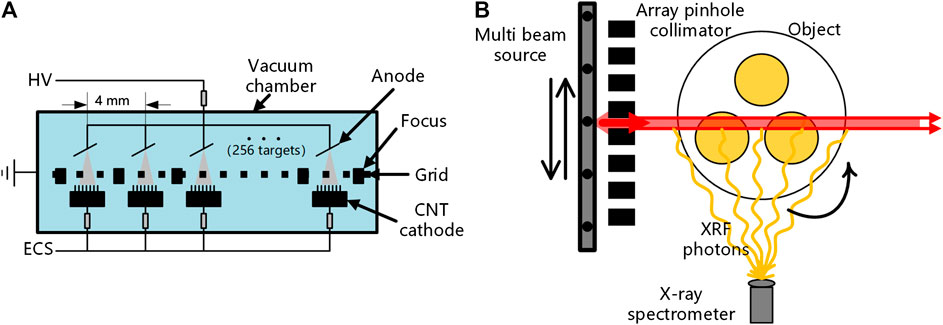
FIGURE 1. (A) Structure of the spatially distributed multi-beam source in this study and (B) geometry of the X-ray fluorescence computed tomography system.
As shown in Figure 1B, the system design of the XFCT device in this study is composed of a spatially distributed multi-beam x-ray source arranged in a straight line, an array collimator made of tungsten, a rotation stage, and an x-ray spectrometer. The distance between the x-ray source and the collimator is 9.6 cm, and the distance between the center of the collimator and the rotation stage is 7 cm. The spectrometer is placed on the side of the beam path to collect the XRF signal stimulated along the path of the incident beam so that each pixel value of the projection data corresponds to the line integral of the intensity of the XRF signal along a certain path in the object. The distance between the spectrometer and the rotation stage is about 14 cm.
As many anodes are integrated in one vacuum chamber, the internal structure of the x-ray source used in this study is compact and it is difficult to place the collimator inside the chamber, which results in a long distance between the target and the pinhole collimator. Therefore, the incident photons will pass through not only the pinhole corresponding to the target but also the adjacent pinholes, forming multiple pencil beams (as shown in Figure 2).
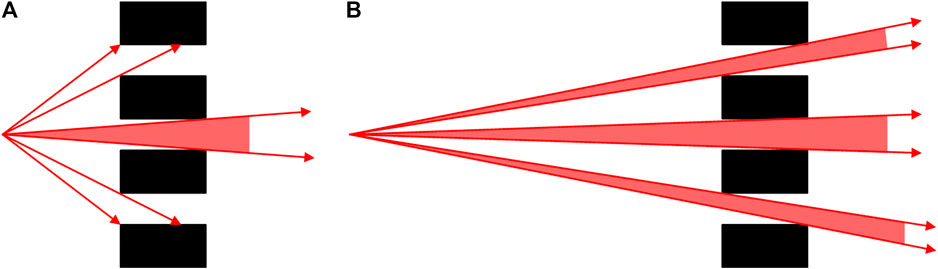
FIGURE 2. Point spread distribution of the array pinhole collimator: (A) when the target is close to the pinhole; (B) when the target is far from the pinhole.
The point spread distribution caused by array pinhole collimation will seriously affect the spatial resolution of the imaging system, so it is necessary to optimize the collimation parameters to reduce the loss of spatial resolution. In this study, the distance between the target and the collimator is 10 cm. Each pinhole is 1 mm in diameter and 12 mm thick. The target spacing of each focus is 4 mm, so the pinhole spacing has to be the integral multiple of 4 mm. The collimation effect with different pinhole spacing was simulated, and the results are shown in Figure 3. The number of pencil beams produced by the collimator and the proportion of the primary beam are listed in Table 1. According to the simulation results, there are up to five pencil beams produced by the collimator when the pinhole spacing is 4 mm with the proportion of the primary beam being only 59.2%. When the pinhole spacing is 12 mm, the collimation effect is ideal but the spatial resolution is extremely limited. Therefore, the design of the collimator with 8-mm pinhole spacing was applied in this study (3 pencil beams with the primary beam proportion of 98.1%).
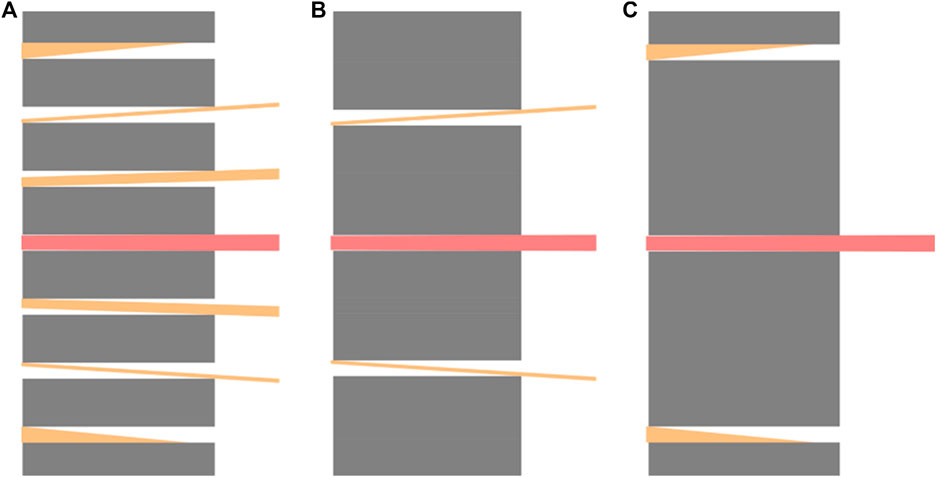
FIGURE 3. Collimation results with different pinhole spacing: (A) 4 mm; (B) 8 mm; (C) 12 mm.
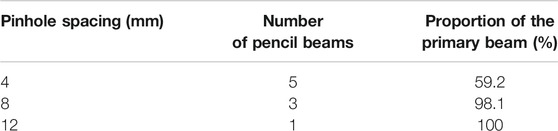
TABLE 1. Collimation results with different pinhole spacing.
Energy calibration of the x-ray spectrometer was performed before XFCT scan. Kα XRF photons of different high-atomic elements were used as the quasi-monochromatic source for energy calibration in this study. The fluorescent materials used for calibration were NaI (Kα = 28.6 keV), GdO (Kα = 42.9 keV), W (Kα = 59.3 keV), and Pb (Kα = 74.9 keV). Each material was irradiated by an x-ray tube (110 kVp, 0.5 mA), and the spectrometer was placed on one side of the beam line to record the XRF spectrum. The spectrum measurement results of different materials are shown in Figure 4.
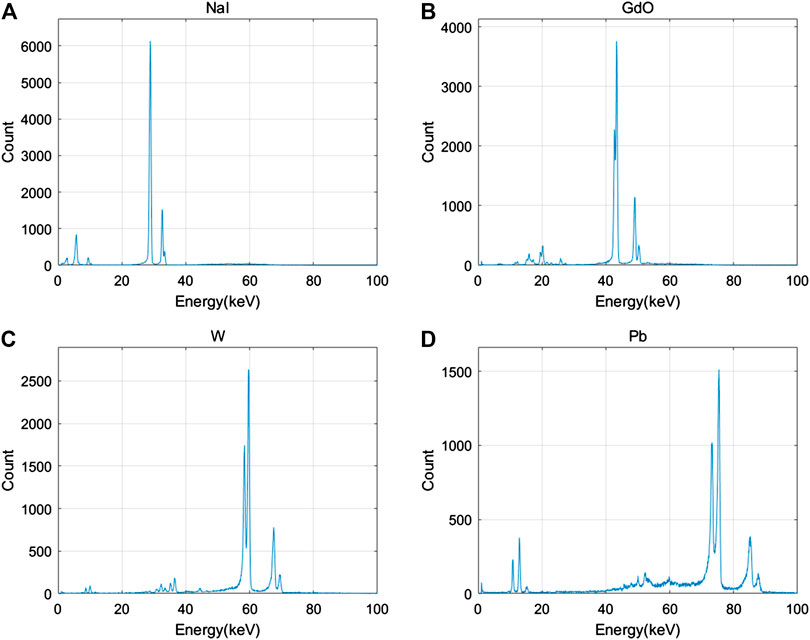
FIGURE 4. Fluorescence peaks of four materials: (A) I; (B) gadolinium (Gd); (C) w; (D) Pb.
The channel number corresponding to the XRF peak was calculated using the second derivative peak search method, and the linear relationship between channel number and energy was then fitted by the least square method (as shown in Figure 5). According to the calibration results, the position of XRF peaks of different materials can be determined and then the XRF signal intensity can be extracted from the spectrum of the projection data.
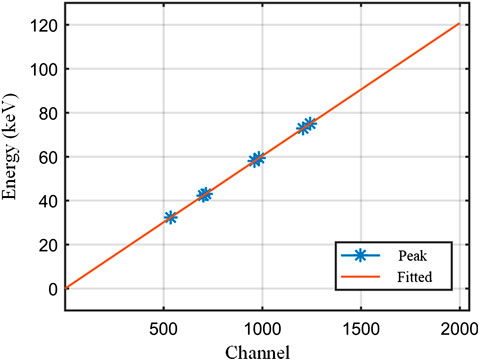
FIGURE 5. Energy calibration results (E = 0.0605 × bin + 0.14, R-square = 0.99998).
The XFCT experimental device used in this study is shown in Figure 6. The phantom was irradiated by the x-ray source operating on pulse-out mode (110 kVp, 10 mA, 1% duty cycle) with a pinhole array collimator. A CdTe x-ray spectrometer (Amptek XR100) with lead shield was placed on one side of the rotation stage collecting the XRF photons. The pinhole spacing was 8 mm, and 11 targets were used to irradiate the whole phantom. Eighteen projection angles were scanned with the angle interval of 20° and the scanning time of 30 s per sample point, resulting in the total scanning time of about 100 min and the total exposure time of 59.4 s.
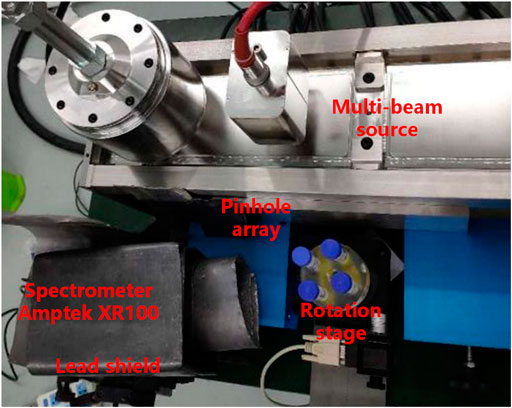
FIGURE 6. X-ray fluorescence computed tomography experimental device based on the spatially distributed multi-beam source.
The collimation effect of a single cone-beam source was measured, and the results are shown in Figure 7. It can be seen that the primary beam was not an ideal circle, which is caused by the rectangle shape of the focal spot. In addition to the primary beam directly facing the target, there were also a small amount of incident photons passing through the two adjacent pinholes, and the measured proportion of the primary beam was about 83.3%, which is relatively smaller than the simulation results in Figure 3 due to the nonideal focal spot size. The point spread function (PSF) of each target was calculated according to Figure 7 and was used for the calculation of the reconstruction system matrix.
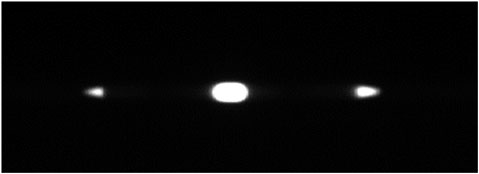
FIGURE 7. Measurement of the collimation results.
As shown in Figure 8, the phantom used in the XFCT experiment was a PMMA cylinder which was 8 cm in diameter with insertions of Gd (20 mg/ml) and I (40 and 100 mg/ml) solutions. Two kinds of fluorescent materials were scanned and imaged simultaneously using the experimental system shown in Figure 6.
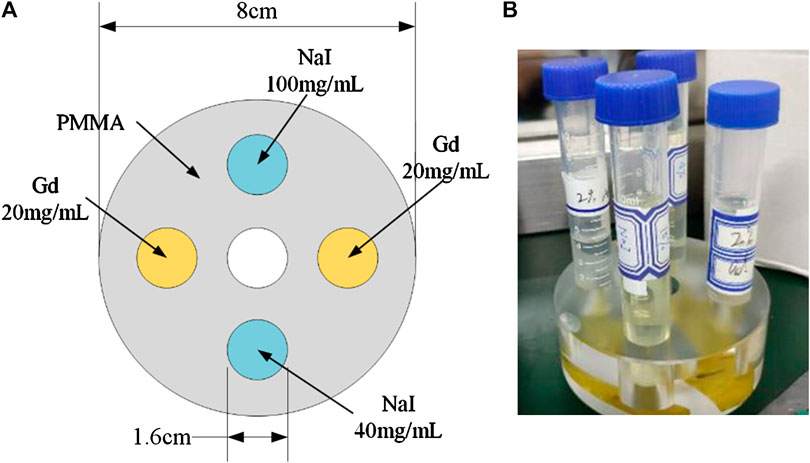
FIGURE 8. Phantom used in the experiment: (A) schematic diagram; (B) physical diagram.
The spectrum of the projection data (11 × 18 sample pixels) was measured during the XFCT scanning. The Compton scattered background curve was fitted by the cubic polynomial method, and the XRF peaks of I and Gd in each sample pixel were then extracted. The fitting results are shown in Figure 9. The XRF signal of I and Gd after extraction from the raw projection data is shown in Figure 10. As the complete spectrum was already obtained, simultaneous scanning of multiple XRF signals from different elements was enabled.
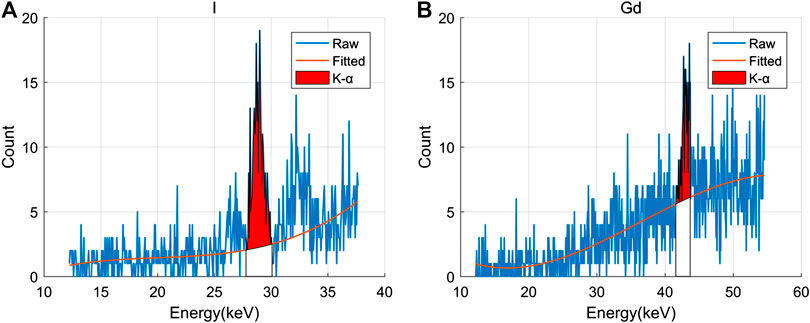
FIGURE 9. Fitting results of the scattered background in the region of the XRF peak: (A) I; (B) gadolinium (Gd).
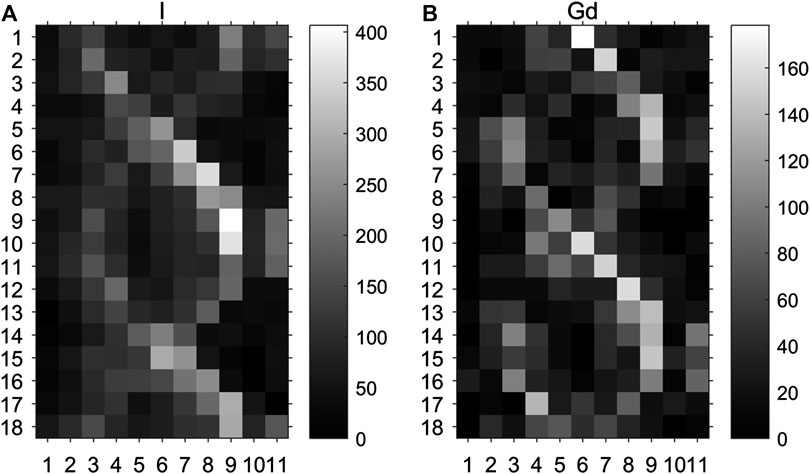
FIGURE 10. Projection data of the two target elements: (A) I; (B) Gd.
The XFCT images (40 × 40 pixels with the pixel size of 2.5 mm × 2.5 mm) were reconstructed using the EM-TV algorithm:
where fj denotes the jth pixel of the reconstructed image (j = 1, 2, …, 1,600), Pi denotes the ith pixel of the projection (i = 1, 2, …, 198), and aij denotes an element of the system matrix which can be expressed as
where Cij is a constant related to the fluorescence yield of the target elements and scanning parameters, Sij denotes the attenuation of incident photons and fluorescent photons in the object, and Pij denotes the contribution of image pixel j to projection pixel i, which can be calculated according to the system geometry and the measured PSF of the incident beam.
The parameter β (β = 0.25 in this study) controls the weight of TV norm UjTV, which can be expressed as
where m,n is the coordinate of image pixel j and ε is a small value preventing the denominator to be zero.
The reconstructed images of the two elements are shown in Figure 11 and the image fusion result is shown in Figure 12. According to the experimental results, the distribution of I and Gd in a PMMA phantom was successfully reconstructed, which indicates the feasibility of XFCT imaging using a spatially distributed multi-beam x-ray source. However, it can also be seen that the spatial resolution and scanning efficiency of this experimental device are not optimal. There are two main factors which limit the image performance: one is the distance between the pinhole collimator and the target, which results in an imperfect pencil beam and reduction of spatial resolution; the other factor is the pulse-out mode of the x-ray source used in this study with low duty cycle (1%), which seriously reduces the scanning efficiency and image sensitivity.
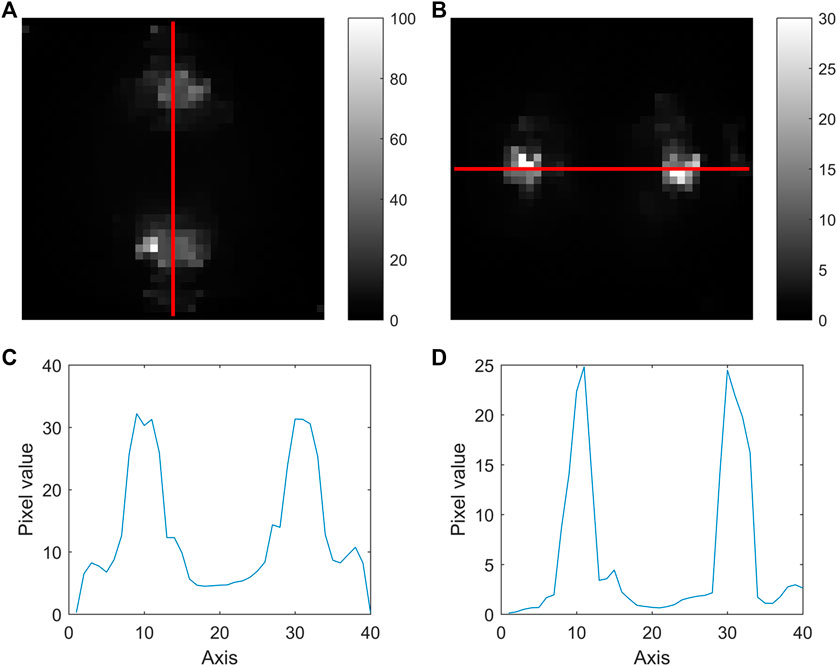
FIGURE 11. Reconstruction results: (A) I ([0 100 mg/ml]) and (B) Gd ([0 30 mg/ml]); and line profiles of (C) I and (D) Gd.
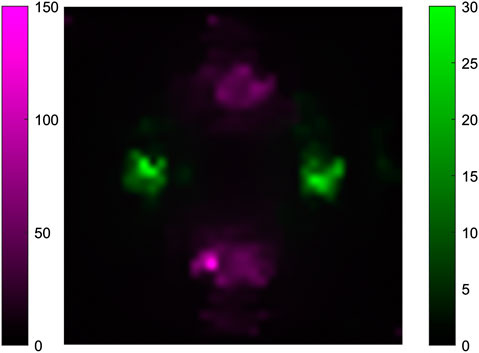
FIGURE 12. Fusion of X-ray fluorescence computed tomography images of I and Gd.
One main factor limiting the practicability of the XFCT system with pencil beam is the long scanning time. The movement of the pencil-beam source is required to scan the whole object, which results in waiting time of mechanical movement. An XFCT experimental device based on a spatially distributed multi-beam source using carbon nanotubes is presented in this study. Compared with the traditional design of the XFCT system, the translation of the pencil-beam source was replaced by successive exposure from different focal spots. The exposure of each focal spot can be switched instantly so that the time consumption caused by translating the x-ray source is avoided.
The distribution of I and Gd was successfully reconstructed, which indicates the feasibility of XFCT imaging using the proposed system. As the x-ray source used in this experimental device was originally designed for transmission CT, there is still room for further improvement of its spatial resolution and scan efficiency. However, these defects are not in imaging principle and can be solved by optimization of the collimation and exposure mode of this x-ray source specifically for XFCT imaging.
The spatial resolution of the projection was 8 mm in this study, and only half the number of the focal spots was used (the spacing of the focal spots is 4 mm). As we are unable to place the external collimator inside the chamber limited by the compact chamber design, the distance between the focal spot and the collimator results in weakness of the collimating effect and reduction of the spatial resolution. A new design of the vacuum chamber taking into consideration the pinhole collimation may enable the collimator to be close to the focal spot so that all the focal spots could be used and the sampling density of each projection angle could be improved effectively.
Although there was no time consumption caused by translating the x-ray source, the total scan time (about 100 min) of the experiment was still much longer than the real exposure time (59 s) because the x-ray source in this study was operating on pulse-out mode with the duty cycle of only 1%. The total scan time could be further reduced by making full use of the duty cycle, such as switching the focal spots instead of waiting for the next pulse of the current focal spot, and then collecting data of the corresponding projection.
A design of the XFCT system using a spatially distributed multi-beam x-ray source is presented in this study. Simultaneous XFCT imaging of I and Gd was performed on an experimental device to investigate the feasibility of the proposed system, and the distribution of I (40 mg/ml) and Gd (20 mg/ml) in a PMMA phantom was successfully obtained. The limitations of the current experimental device and corresponding improvement methods are discussed according to the experimental results. Our future work will focus on further optimization of the spatial resolution and scanning efficiency of the current system.
The raw data supporting the conclusions of this article will be made available by the authors, without undue reservation.
The research about the XFCT using a spatially distributed multi-beam x-ray source was proposed by ZC. The research funds were provided by ZC. The experiments were designed by LL and were carried out by SZ. The manuscript was written by SZ and revised by ZC and LL.
This work was supported in part by the National Key R&D Program of China (No. 2018YFC0115502) and NSFC 11525521.
The authors declare that the research was conducted in the absence of any commercial or financial relationships that could be construed as a potential conflict of interest.
The authors acknowledge NuRay Technology Co., Ltd, China, for the provision of the experimental place and technical support for the spatially distributed multi-beam x-ray source.
1. Bazalova, M, Kuang, Y, Pratx, G, and Xing, L. Investigation of x-ray fluorescence computed tomography (XFCT) and K-edge imaging. IEEE Trans Med Imaging (2012). 31(8):1620–7. doi:10.1109/tmi.2012.2201165
2. Feng, P, Cong, W, Wei, B, and Wang, G. Analytic comparison between x-ray fluorescence CT and K-edge CT. IEEE Trans Biomed Eng (2014). 61(3):975–85. doi:10.1109/tbme.2013.2294677
3. Paunesku, T, Vogt, S, Maser, J, Lai, B, and Woloschak, G. X-ray fluorescence microprobe imaging in biology and medicine. J Cell Biochem (2006). 99(6):1489–502. doi:10.1002/jcb.21047
4. Takeda, T, Wu, J, Huo, Q, Yuasa, T, and Akatsuka, T. X-ray fluorescent ct imaging of cerebral uptake of stable-iodine perfusion agent iodoamphetamine analog imp in mice. J Synchrotron Radiat (2009). 16(Pt 1):57–62. doi:10.1107/s0909049508031853
5. Lo, P-A, Lin, M-L, Jin, S-C, Chen, J-C, Lin, S-L, Chang, CA, et al. Cone beam x-ray luminescence computed tomography reconstruction with a priori anatomical information. In Reflection, scattering, and diffraction from surfaces IV; 2014 Oct 3 (Vol. 9205) (2014).
6. Manohar, N, Reynoso, FJ, Diagaradjane, P, Krishnan, S, and Cho, SH. Quantitative imaging of gold nanoparticle distribution in a tumor-bearing mouse using benchtop x-ray fluorescence computed tomography. Sci Rep (2016). 6(1):22079. doi:10.1038/srep22079
7. Zhang, S, Li, L, Chen, J, Chen, Z, Zhang, W, and Lu, H. Quantitative imaging of Gd nanoparticles in mice using benchtop cone-beam X-ray fluorescence computed tomography system. Int J Mol Sci (2019). 20(9):2315. doi:10.3390/ijms20092315
8. Boisseau, P, and Grodzins, L. Fluorescence tomography using synchrotron radiation at the NSLS. Hyperfine Interact (1987). 33(1):283–92. doi:10.1007/bf02394116
9. Hanson, AL. The calculation of scattering cross sections for polarized x-rays. Nucl Instrum Methods Phys Res A (1986). 243(2–3):583–98. doi:10.1016/0168-9002(86)90999-x
10. Takeda, T, Maeda, T, Yuasa, T, Akatsuka, T, Ito, T, Kishi, K, et al. Fluorescent scanning x‐ray tomography with synchrotron radiation. Rev Sci Instrum (1995). 66(2):1471. doi:10.1063/1.1145944
11. Bohic, S, Simionovici, A, Snigirev, A, Ortega, R, Devès, G, Heymann, D, et al. Synchrotron hard x-ray microprobe: fluorescence imaging of single cells. Appl Phys Lett (2001). 78(22):3544–6. doi:10.1063/1.1366362
12. Cong, W, Xi, Y, and Wang, G. X-ray fluorescence computed tomography with polycapillary focusing. In: Quality Control, Transactions (2014). 2(2):1138–42.
13. Cheong, S-K, Jones, BL, Siddiqi, AK, Liu, F, Manohar, N, and Cho, SH. X-ray fluorescence computed tomography (XFCT) imaging of gold nanoparticle-loaded objects using 110 kvp x-rays. Phys Med Biol (2010). 55(3):647–62. doi:10.1088/0031-9155/55/3/007
14. Sjölin, M, and Danielsson, M. Improved signal-to-noise ratio for non-perpendicular detection angles in x-ray fluorescence computed tomography (XFCT). Phys Med Biol (2014). 59(21):6507–20. doi:10.1088/0031-9155/59/21/6507
15. Ahmad, M, Bazalova, M, Xiang, L, and Xing, L. Order of magnitude sensitivity increase in x-ray fluorescence computed tomography (XFCT) imaging with an optimized spectro-spatial detector configuration: theory and simulation. IEEE Trans Med Imag (2014). 33(5):1119–28. doi:10.1109/tmi.2014.2305101
16. Bazalova, M, Ahmad, M, Pratx, G, and Xing, L. L-shell x-ray fluorescence computed tomography (XFCT) imaging of cisplatin. Phys Med Biol (2014). 59(1):219–32. doi:10.1088/0031-9155/59/1/219
17. Manohar, N, Reynoso, FJ, and Cho, SH. Technical Note: a benchtop cone-beam x-ray fluorescence computed tomography (XFCT) system with a high-power x-ray source and transmission CT imaging capability. Med Phys (2018). 45(10):4652–9. doi:10.1002/mp.13138
18. Vernekohl, D, Ahmad, M, Dai, X, Zhao, W, Cheng, K, and Xing, L. Reduced acquisition time for L‐shell x‐ray fluorescence computed tomography using polycapillary x‐ray optics. Med Phys (2019). 46(12):5696–702. doi:10.1002/mp.13822
19. Hertz, HM, Larsson, JC, Lundström, U, Larsson, DH, and Vogt, C. Laboratory x-ray fluorescence tomography for high-resolution nanoparticle bio-imaging. Opt Lett (2014). 39(9):2790–3. doi:10.1364/ol.39.002790
20. Dunning, CAS, and Bazalova-Carter, M. Sheet beam x-ray fluorescence computed tomography (XFCT) imaging of gold nanoparticles. Med Phys (2018). 45(6):2572–82. doi:10.1002/mp.12893
21. Yoon, C, and Lee, W. Fluorescence x-ray computed tomography (FXCT) using a position-sensitive CdTe detector. J Kor Phys Soc (2014). 64(1):122–8. doi:10.3938/jkps.64.122
22. Jones, BL, and Cho, SH. The feasibility of polychromatic cone-beam x-ray fluorescence computed tomography (XFCT) imaging of gold nanoparticle-loaded objects: a Monte Carlo study. Phys Med Biol (2011). 56(12):3719–30. doi:10.1088/0031-9155/56/12/017
23. Cong, W, Shen, H, Cao, G, Liu, H, and Wang, G. X-ray fluorescence tomographic system design and image reconstruction. J X Ray Sci Technol (2013). 21(1):1–8. doi:10.3233/xst-130362
24. Li, L, Zhang, S, Li, R, and Chen, Z. Full-field fan-beam x-ray fluorescence computed tomography with a conventional x-ray tube and photon-counting detectors for fast nanoparticle bioimaging. Opt Eng (2017). 56(4):043106.1–043106.5. doi:10.1117/1.oe.56.4.043106
25. Calderón-Colón, X, Geng, H, Gao, B, An, L, Cao, G, and Zhou, O. A carbon nanotube field emission cathode with high current density and long-term stability. Nanotechnology (2009). 20(32):325707. doi:10.1088/0957-4484/20/32/325707
26. Zhang, J, Yang, G, Lee, YZ, Chang, S, Lu, JP, and Zhou, O. Multiplexing radiography using a carbon nanotube based x-ray source. Appl Phys Lett (2006). 89(6):064106. doi:10.1063/1.2234744
27. Lu, Y, Yu, H, Cao, G, Zhao, J, Wang, G, and Zhou, O. Multibeam field emission x-ray system with half-scan reconstruction algorithm. Med Phys (2010). 37(7):3773–81. doi:10.1118/1.3446801
28. Cao, G, Lee, YZ, Peng, R, Liu, Z, Rajaram, R, Calderon-Colon, X, et al. A dynamic micro-ct scanner based on a carbon nanotube field emission x-ray source. Phys Med Biol (2009). 54(8):2323–40. doi:10.1088/0031-9155/54/8/005
29. Chen, Y, Xi, Y, and Zhao, J. A stationary computed tomography system with cylindrically distributed sources and detectors. J X Ray Sci Technol (2014). 22(6):707–25. doi:10.3233/xst-140456
30. Cramer, A, Hecla, J, Wu, D, Lai, X, Boers, T, Yang, K, et al. Stationary computed tomography for space and other resource-constrained environments. Sci Rep (2018). 8(1):14195. doi:10.1038/s41598-018-32505-z
Keywords: x-ray fluorescence, computed tomography, carbon nanotubes, spatially distributed multi-beam x-ray source, x-ray spectrometer
Citation: Chen Z, Zhang S and Li L (2020) Experimental Demonstration of X-Ray Fluorescence CT Using a Spatially Distributed Multi-Beam X-Ray Source. Front. Phys. 8:587625. doi:10.3389/fphy.2020.587625
Received: 27 July 2020; Accepted: 16 September 2020;
Published: 29 October 2020.
Edited by:
Zhen Cheng, Stanford University, United StatesReviewed by:
Changqing Li, University of California, Merced, United StatesCopyright © 2020 Chen, Zhang and Li. This is an open-access article distributed under the terms of the Creative Commons Attribution License (CC BY). The use, distribution or reproduction in other forums is permitted, provided the original author(s) and the copyright owner(s) are credited and that the original publication in this journal is cited, in accordance with accepted academic practice. No use, distribution or reproduction is permitted which does not comply with these terms.
*Correspondence: Zhiqiang Chen, Y3pxQHRzaW5naHVhLmVkdS5jbg==, Liang Li, bGxpYW5nQHRzaW5naHVhLmVkdS5jbg==
This article was submitted to Medical Physics and Imaging, a section of the journal Frontiers in Physics
Disclaimer: All claims expressed in this article are solely those of the authors and do not necessarily represent those of their affiliated organizations, or those of the publisher, the editors and the reviewers. Any product that may be evaluated in this article or claim that may be made by its manufacturer is not guaranteed or endorsed by the publisher.
Research integrity at Frontiers
Learn more about the work of our research integrity team to safeguard the quality of each article we publish.