
94% of researchers rate our articles as excellent or good
Learn more about the work of our research integrity team to safeguard the quality of each article we publish.
Find out more
ORIGINAL RESEARCH article
Front. Phys., 18 January 2021
Sec. Social Physics
Volume 8 - 2020 | https://doi.org/10.3389/fphy.2020.586561
This article is part of the Research TopicFrom Physics to Econophysics and Back: Methods and InsightsView all 31 articles
 Ali Namaki1,2*
 Reza Raei1,2
 Jamshid Ardalankia3,4Leila Hedayatifar4,5
 Ali Hosseiny6
 Emmanuel Haven7,8
 G. Reza Jafari6*
Since the financial crisis of 2008, the network analysis of financial systems has attracted a lot of attention. In this paper, we analyze the global banking network via the method of Random Matrix Theory. By applying that method on a cross border lending network, it is shown that while the connectivity between different parts of the network has risen and the profile of transactions has diversified, the role of hubs remains important in the weighted perspective. The largest eigenvalue of the transaction matrix as the leading mode of the system shows sharp growth since 2002. As well, it is observed that its growth has diminished since 2008. This indicates that the crisis of 2008 has left a long-lasting footprint on the financial system. Analyzing the mean value of the participation ratio reveals the fact that the role of countries in forming small modes, has increased since 2002. In our final analysis, we provide snapshots of the hubs in the network over time. We observe that the share of countries in total transactions is not equal to their share in shaping the eigenvector of the largest eigenvalue. In 2018 for example, while the United Kingdom leads the share of transactions, it is the United States that has the largest value in the leading eigenvector. The proposed technique in the paper can be useful for analyzing different types of interaction networks between countries.
Since the recent global financial crisis, cross-border lending and financial contagions have gained in importance. The propagated effects [1, 2] of financial crises on political and economic systems [3, 4] are not to be underestimated. Those developments have prompted a lot of research on the systemic dependence of the international banking sector [5–13].
The field of complexity can aid in understanding better such systemic dependence [5, 14–22]. Complex networks are useful instruments for describing a large number of financial systems [23–31].
Most of the networks have different topological properties such as small-world and scale-free characteristics [24–26, 32–39].
The purpose of complexity science in finance focusses on the analysis of the structure and the dynamics of entangled systems.
Many scholars have applied complexity techniques for the analysis of financial contagion [6, 9, 10, 40–42].
Their findings suggested that the connectivity of financial institutions is the source of potential contagions.
For example, Glasserman and Young [40] reviewed the extensive literature on the network’s structures and their interactions with other key variables such as leverage, size, and short-term funding. They emphasized that the network connections expand the firms’ risk exposures, and through different routes, the shocks can be proliferated via contagion.
Random Matrix Theory is one of the useful methods for analyzing the behavior of complex systems [16, 43–54].
This theory was developed to describe the energy levels of quantum systems [55, 56].
It is the universality regime of the eigenvalue statistics which provides for the success factor of Random Matrix Theory [57–59]. Based on previous studies, it is shown that when the size of the matrix is very large, the eigenvalue distribution tends toward a specific distribution [59].
Random Matrix Theory has been applied to analyze the behavior of coupling matrices [16]. This technique divides the contents of the coupling matrix into noise and information parts. The noise part of the coupling matrix conforms to the Random Matrix Theory findings, and the information part deviates from them. This concept stems from the idea of solving the problem of non-stationary cross-correlation and measurement noise which result from market conditions and the finite length of time series [57, 59].
A system which can be analyzed by the complexity approach is the global banking network [60].
Minoiu and Reyes [60] have analyzed the global banking network from 1978 to 2009. They have applied network metrics such as centrality, connectivity, and clustering for analyzing financial interconnectedness. They have shown that during and after systemic banking crises (and sovereign debt crises), the connectivity drops. Also, it was shown that the 2008–2009 financial crisis provided for an unusually large perturbation to the global banking network. For more research on this, please see [61–69].
In this paper, by applying Random Matrix Theory on bilateral locational statistics data provided by the Bank for International Settlements (BIS) [70] from 1978 until 2019, we aim to analyze the global banking network. This data includes all ‘core’ countries (the qualifier ‘core’ is used by many researchers such as [60], for countries which regularly report their financial data to BIS).
Our paper is organized as follows. In Section 2 we present our methods and, in Section 3 we apply Random Matrix Theory on the global banking network and present our findings. Then, in Section 4 we conclude.
Random Matrix Theory has been presented by some scholars in nuclear physics such as Mehta [55, 56], for analyzing the energy levels of complex quantum systems. Subsequently, the method has helped to address specific issues in other fields, such as finance [45, 57–59, 71, 72].
From random matrix theory, we know that the eigenvalues–in the real matrix–which deviate from the range of the eigenvalues–in the random matrix–possess relatively more complete information from the system [51, 58, 59]. It can be shown that the majority of the eigenvalues of coupling matrices, agree with the random matrix predictions, but the largest eigenvalue has deviations from those estimations [50, 57, 58, 73]. In essence, this eigenvalue develops an energy gap that separates it from the other eigenvalues [45]. The largest eigenvalue is related to a strongly delocalized eigenvector that represents the collective evolution of the system. This is called market mode. From this perspective, the largest eigenvalue’s magnitude reflects the coupling strength of the system [45].
In Random Matrix Theory, there is a parameter named Inverse Participation Ratio IPR [74]. Its inverse provides a measure for the number of components which significantly participate in each eigenvector. This notion shows the effect of components of each eigenvector and specifically indicates how the largest eigenvalues deviate from the bulk region which is densely occupied by eigenvalues of the random matrix. Based on previous papers [45, 75], IPR can be applied as an indicator for measuring the collective behavior of the networks. The formula of this concept is as follows:
where
i. In case all elements of a certain eigenvector are equal to
ii. On the other hand, if just a single element is equal to one and the others are equal to 0, IPR would be equal to 1. This implies that only this component is effective in the corresponding eigenvector. Hence, one can perceive that
The banking industry is one of the most important sectors in finance. Given this importance, it is not surprising that a significant aspect of financial contagion shows that the banking network is the conduit, through which the emergence and transmission of crises occurs. In this paper, we create a weighted and directed financial transaction network corresponding to each quarter from 1978 until 2018. Each link corresponds to a loan given by a certain country to another one. Previous studies have shed light on a country’s dependency network and they showed an increase, over time, of the dependency structure of the network [7, 60].
In Figure 1, the evolution of the global banking network in three snapshots (1978-Q3, 1998-Q3, and 2018-Q3) has been depicted. The left panel in Figure 1 shows the dendrogram structure of communities for trading weighted matrices. Furthermore, the right panel shows the evolution, over time, of the network topology and the size of nodes stands for the degree. As depicted, not only the size of the network has grown but also transactions have become more diversified. It is obvious that, over time, the degree of all countries has grown and has become more homogeneous. If the size of degrees is considered, a few countries can be distinguished as hubs, and this will be discussed later in the paper. For the continuous monitoring of networks during the period of study, Figure 2 is plotted. The results show the same outcomes as Figure 1. The left panel of Figure 2 represents the evolution of the degree for each country over time. As can be seen at the beginning of the period, only a small portion of countries has a high degree. But over time, both the degree across more countries and the average degree rise. It means that the sparseness has declined and connectivity has risen. The right panel of Figure 2 shows this fact, i.e., that only a small number of countries are in charge of a big portion of transactions.
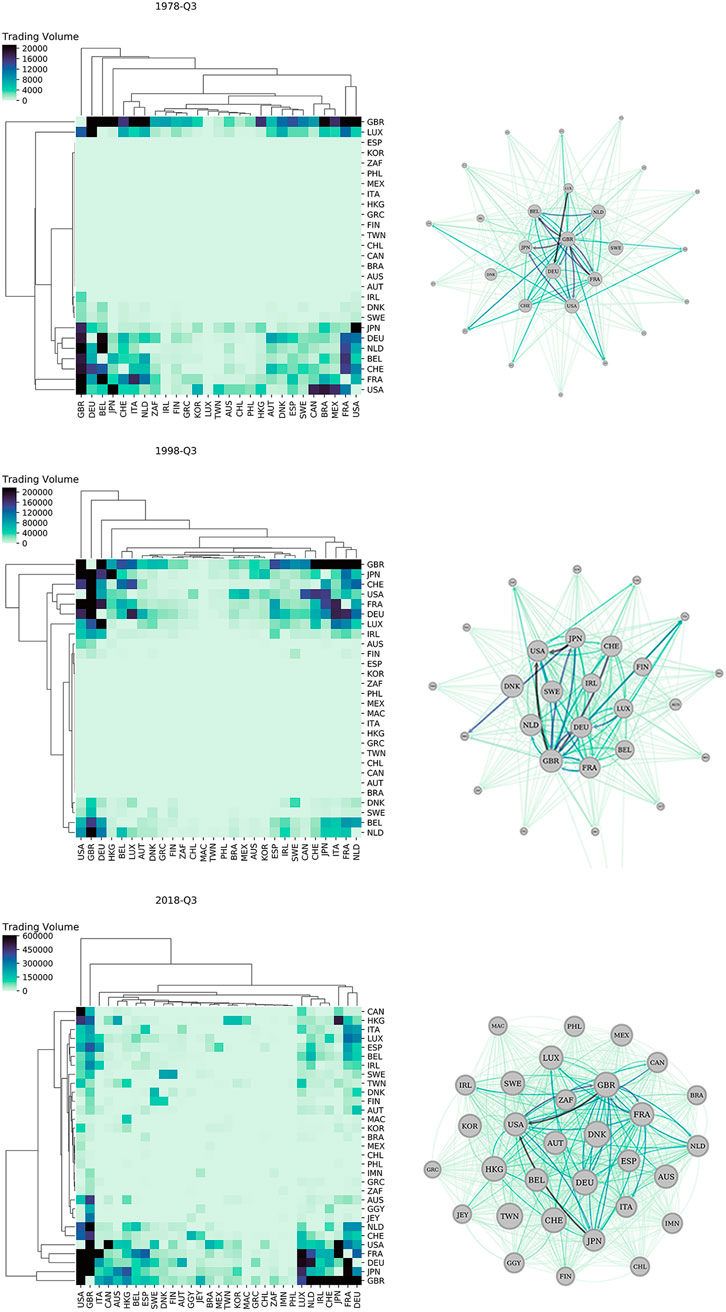
FIGURE 1. The evolution of the global banking network is demonstrated for three snapshots of 1978-Q3, 1998-Q3, and 2018-Q3. Left) shows the dendrogram structure of communities for trading weighted matrices. Right) the network topology is graphed. The size of each node represents the degree.
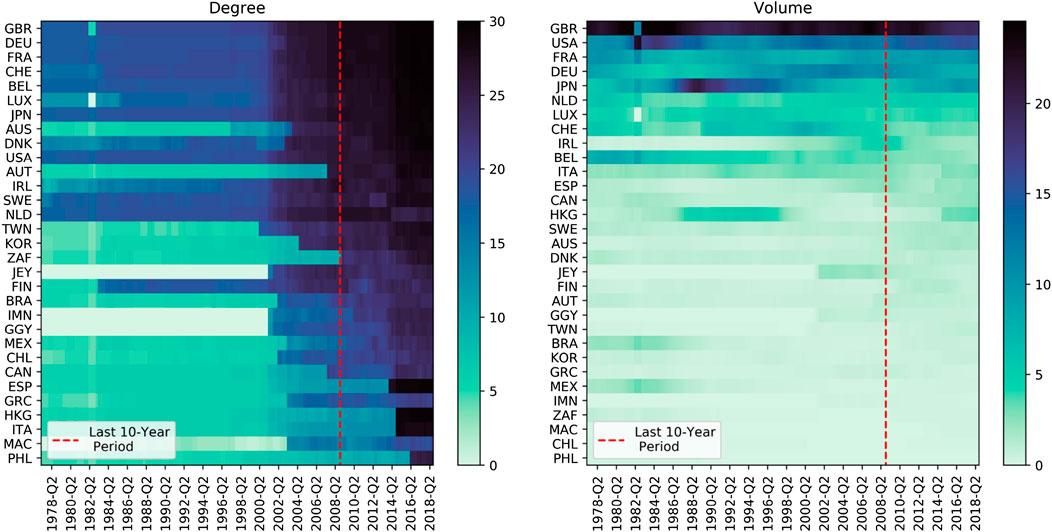
FIGURE 2. Temporal evolution of: (Left) the degree, and (Right) the volume of each country over time. The sorting order of countries is based on the average of the last 10-year period.
To move further into our analysis, we now apply random matrix techniques. The global banking network possesses an adjacency matrix. In random matrix theory, we have learned that the largest eigenvalue is important and addresses the global trend of a system [45, 57, 58, 76]. In Figure 3 we have depicted the evolution of the largest eigenvalue (
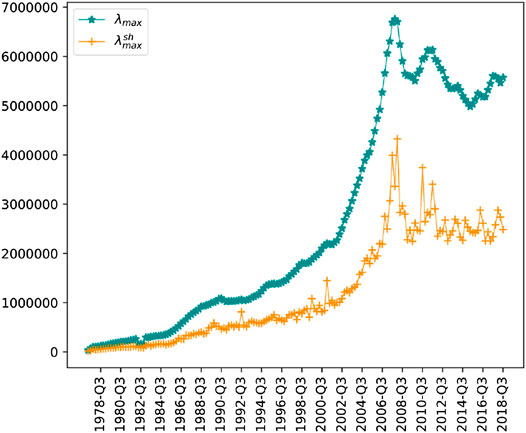
FIGURE 3. The evolution of the largest eigenvalue,
The difference between
The fact that the largest eigenvalues of both the banking network and the shuffled network, have lost their growth trends after 2008, means that the financial crisis has left a long-lasting footprint on the network. Since the obtained eigenvalue does not describe all the details and properties of the collective behavior, one should investigate other quantities in the network.
As already discussed in the method section, one should keep in mind that the IPR possesses the ability of information extraction from the collective the behavior of systems. Figure 4 represents the evolution of the
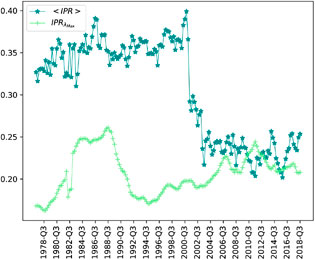
FIGURE 4. The average of the Inverse participation ratio of all eigenvectors
In a network of size N, IPR could have a value within
The sustainability of the relatively high rate of IPR in the largest eigenvalue leads us to investigate the share of countries in shaping its eigenvector. We expect the countries which have a higher share of transactions, to play a more important role in shaping the trend of the system embedded in this eigenvector. Figure 5 visualizes the contribution of countries in the structure of the leading mode vs. their contribution to trading volume in five snapshots since 1978. A couple of interesting results can be inferred from the figure.
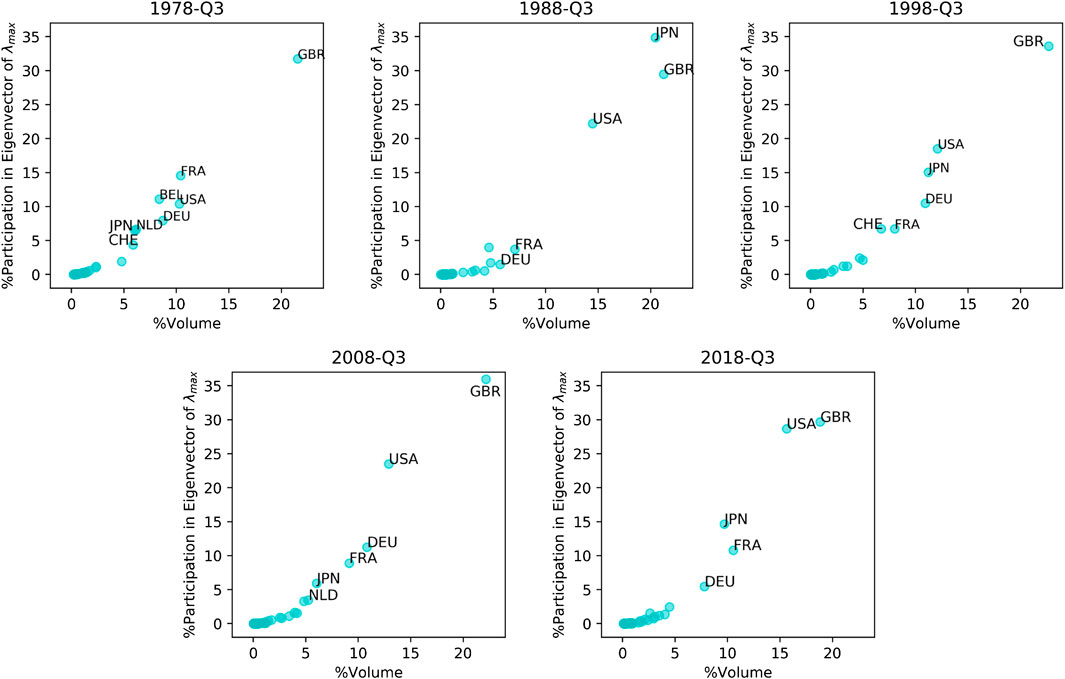
FIGURE 5. The percentage of the participation of each country in the eigenvector of
In all snapshots, the share of hubs in the leading mode has been higher than their share in transactions. For example, in 1978 while the share of the United Kingdom in total transactions has been 21.5 percent, its share in the leading eigenvector has been 31.73 percent. Hence, this means that the role of the United Kingdom in shaping the leading eigenvalue has been larger than its share in total transactions. The same scenario works for other hubs such as France and the United States.
The interesting observation of 1988 is that, while the United Kingdom holds the lead in the share of transactions, Japan has the largest component of the leading eigenvector. On the eve of the economic downturn, Japan has not repeated its leading role in any other snapshots.
Within the last 2 decades, the United States has become closer to the United Kingdom in shaping the eigenvector of the largest eigenvalue. However, for both countries, their share in the largest eigenvalue is bigger than their share in the total transactions. Such an effect could be a matter of the country’s role in the structure of the leading mode in the network.
In this paper, by applying Random Matrix Theory, the global banking network is analyzed. For this purpose, we consider the matrix of the interaction of the banking sectors of BIS countries. We first focus on the largest eigenvalue which defines the leading mode in a system. We observe that the largest eigenvalue grows over time. By making a comparison with the largest eigenvalue of the network itself and the shuffled network, we conclude that the growth of the largest eigenvalue originates from two sources. The first source is the growth of the transaction volume and the other source is the network structure. We observe that the growth of the largest eigenvalue has vanished after 2008.
By focusing on the temporal behavior of the IPR of the largest eigenvalue, we observe that it has kept a sustainable value far above its possible minimum. This emphasizes the role of a few countries as hubs in the system. In comparison, the mean value of the IPR of all eigenvectors has declined sharply after 2002. This leads us to conclude, that the contribution of countries to shape small modes and possibly local structures, has grown. This phenomenon has occurred in tandem with the fast growth of transactions from 2002 to 2004. In comparing the share of countries in total transactions with their share in the leading mode, we observe that usually the share of the leading countries in shaping the market mode, is larger than their share in total transactions.
In this work, we analyzed the network of the international banking system. Our work sheds light on some features of this network. We suggest future research where financial networks are studied along with other variables such as commercial interactions in a multi-layer scheme.
Publicly available datasets were analyzed in this study. This data can be found here: https://www.bis.org/.
All authors contribute to all sections. All authors have read and agreed to the published version of the manuscript. GJ and RR supervise the project; AN administrates the project.
The authors declare that the research was conducted in the absence of any commercial or financial relationships that could be construed as a potential conflict of interest.
1. Iori G, Mantegna RN, Marotta L, Miccichè S, Porter J, Tumminello M. Networked relationships in the e-MID interbank market: a trading model with memory. J Econ Dynam Contr (2015) 50:98–116. doi:10.1016/j.jedc.2014.08.016
2. Haldane AG, May RM. Systemic risk in banking ecosystems. Nature (2011) 469(7330):351–5. doi:10.1038/nature09659
3. Reinhart C, Rogoff K. This time is different: eight centuries of financial folly. 1st ed. Princeton, NJ: Princeton University Press (2009).
4. Contreras MGA, Fagiolo G. Propagation of economic shocks in input-output networks: a cross-country analysis. Phys Rev (2014) 90(6). doi:10.1103/physreve.90.062812
5. Rama C, Moussa A, Bastos e Santos E. Network structure and systemic risk in banking systems. Available at: https://ssrn.com/abstract=1733528 (2010).
6. Etesami J, Habibnia A, Kiyavash N. Econometric modeling of systemic risk: going beyond pairwise comparison and allowing for nonlinearity (2017). The London School of Economics and Political Science. Technical Paper 70769.
7. Battiston S, Gatti DD, Gallegati M, Greenwald B, Stiglitz JE. Liaisons dangereuses: increasing connectivity, risk sharing, and systemic risk. J Econ Dynam Contr (2012) 36(8):1121–41. doi:10.1016/j.jedc.2012.04.001
8. Betz F, Hautsch N, Peltonen TA, Schienle M. Systemic risk spillovers in the european banking and sovereign network. J Financ Stabil (2016) 25:206–24. doi:10.1016/j.jfs.2015.10.006
9. D’Errico M, Battiston S, Peltonen T, Scheicher M. How does risk flow in the credit default swap market? Available at: https://ssrn.com/abstract=3723379 (2018).
10. Battiston S, Caldarelli G. Systemic risk in financial networks. J Finan Manag Markets Inst (2013) 2013:129–54. doi:10.12831/75568
11. Maluck J, Glanemann N, Donner RV. Bilateral trade agreements and the interconnectedness of global trade. Front Phys (2018) 6:134. doi:10.3389/fphy.2018.00134
12. Almog A, Bird R, Garlaschelli D. Enhanced gravity model of trade: reconciling macroeconomic and network models. Front Phys (2019) 7:55. doi:10.3389/fphy.2019.00055
13. Atyabi F, Buchel O, Hedayatifar L. Driver countries in global banking network. Entropy (2020) 22(8):810. doi:10.3390/e22080810
14. Arthur WB. Complexity and the economy. Science (1999) 284(5411):107–9. doi:10.1126/science.284.5411.107
15. Turalska M, West BJ. Fractional dynamics of individuals in complex networks. Front Phys (2018) 6:110. doi:10.3389/fphy.2018.00110
16. Jafari G, Shirazi AH, Namaki A, Raei R. Coupled time series analysis: methods and applications. Comput Sci Eng (2011) 13(6):84–9. doi:10.1109/mcse.2011.102
17. Ardalankia J, Askari J, Sheykhali S, Haven E, Jafari GR. Mapping coupled time-series onto complex network (2020). Available at: https://arxiv.org/abs/2004.13536.
18. Martnez-Jaramillo S, Prez OP, Avila FE, Dey FLG. Systemic risk, financial contagion and financial fragility. J Econ Dynam Contr (2010) 34(11):2358–74. doi:10.1016/j.jedc.2010.06.004
19. Lee D, Park H. Measuring global financial linkages: a network entropy approach. Sustainability (2019) 11(17):4691. doi:10.3390/su11174691
20. Berardi S, Tedeschi G. From banks strategies to financial (in)stability. Int Rev Econ Finance (2017) 47:255–72. doi:10.1016/j.iref.2016.11.001
21. Raei R, Namaki A, Vahabi H. Analysis of collective behavior of Iran banking sector by random matrix theory. Iranian J Finan (2019) 3(4):60–75. doi:10.22034/ijf.2019.111729
22. Namaki A, Raei R, Asadi N, Hajihasani A. Analysis of Iran banking sector by multi-layer approach. Iranian Journal of Finance (2019) 3(1):73–89. doi:10.22034/ijf.2019.101367
23. Albert R, Barabási A-L. Statistical mechanics of complex networks. Rev Mod Phys (2002) 74(1):47–97. doi:10.1103/revmodphys.74.47
24. Newman MEJ. The structure and function of complex networks. SIAM Rev (2003) 45(2):167–256. doi:10.1137/s003614450342480
25. Watts DJ, Strogatz SH. Collective dynamics of ‘small-world’ networks. Nature (1998) 393(6684):440–2. doi:10.1038/30918
26. Barabási A-L, Albert R. Emergence of scaling in random networks. Science (1999) 286(5439):509–12. doi:10.1126/science.286.5439.509
27. Hosseiny A, Bahrami M, Palestrini A, Gallegati M. Metastable features of economic networks and responses to exogenous shocks. PloS One (2016) 11(10):e0160363. doi:10.1371/journal.pone.0160363
28. Hosseiny A. A geometrical imaging of the real gap between economies of China and the United States. Phys Stat Mech Appl (2017) 479:151–61. doi:10.1016/j.physa.2017.02.079
29. Faizliev A, Balash V, Petrov V, Grigoriev A, Melnichuk D, Sidorov S. Stability analysis of company co-mention network and market graph over time using graph similarity measures. J Open Innov (2019) 5(3):55. doi:10.3390/joitmc5030055
30. Balash V, Chekmareva A, Faizliev A, Grigoriev A, Sidorov S. Analysis of financial network topological dynamics of the Russian stock market from 2012 to 2019. J Phys Conf (2020) 1564:012030. doi:10.1088/1742-6596/1564/1/012030
31. Afsharizand B, Chaghoei PH, Kordbacheh AA, Trufanov A, Jafari G. Market of stocks during crisis looks like a flock of birds. Entropy (2020) 22(9):1038. doi:10.3390/e22091038
32. Newman M, Watts D. Renormalization group analysis of the small-world network model. Phys Lett (1999) 263(4-6):341–6. doi:10.1016/s0375-9601(99)00757-4
33. Barrat A, Weigt M. On the properties of small-world network models. Eur Phys J B (2000) 13(3):547–60. doi:10.1007/s100510050067
34. Ravasz E, Barabási A-L. Hierarchical organization in complex networks. Phys Rev (2003) 67(2). doi:10.1103/physreve.67.026112
35. Li X, Chen G. A local-world evolving network model. Phys Stat Mech Appl (2003) 328(1-2):274–86. doi:10.1016/s0378-4371(03)00604-6
36. Huang W-Q, Zhuang X-T, Yao S. A network analysis of the Chinese stock market. Phys Stat Mech Appl (2009) 388(14):2956–64. doi:10.1016/j.physa.2009.03.028
37. Lux T, Marchesi M. Scaling and criticality in a stochastic multi-agent model of a financial market. Nature (1999) 397(6719):498–500. doi:10.1038/17290
38. Tang Y, Xiong JJ, Luo Y, Zhang Y-C. How do the global stock markets influence one another? evidence from finance big data and granger causality directed network. Int J Electron Commer (2019) 23(1):85–109. doi:10.1080/10864415.2018.1512283
39. Bahrami M, Chinichian N, Hosseiny A, Jafari G, Ausloos M. Optimization of the post-crisis recovery plans in scale-free networks. Phys Stat Mech Appl (2020) 540:123203. doi:10.1016/j.physa.2019.123203
40. Glasserman P, Young HP. Contagion in financial networks. J Econ Lit (2016) 54(3):779–831. doi:10.1257/jel.20151228
41. Bardoscia M, Battiston S, Caccioli F, Caldarelli G. Pathways towards instability in financial networks. Nat Commun (2017) 8(1):14416. doi:10.1038/ncomms14416
42. Lenzu S, Tedeschi G. Systemic risk on different interbank network topologies. Phys Stat Mech Appl (2012) 391(18):4331–41. doi:10.1016/j.physa.2012.03.035
43. Potters M, Bouchaud J-P. Financial applications of random matrix theory: a short review (2009). Available at: https://arxiv.org/abs/0910.1205.
44. Jiang XF, Chen TT, Zheng B. Structure of local interactions in complex financial dynamics. Sci Rep (2014) 4(1):5321. doi:10.1038/srep05321
45. Namaki A, Shirazi A, Raei R, Jafari G. Network analysis of a financial market based on genuine correlation and threshold method. Phys Stat Mech Appl (2011) 390(21-22):3835–41. doi:10.1016/j.physa.2011.06.033
46. MacMahon M, Garlaschelli D. Community detection for correlation matrices. Phys Rev X (2015) 5(2):021006. doi:10.1103/physrevx.5.021006
47. Sandoval L, Franca IDP. Correlation of financial markets in times of crisis. Phys Stat Mech Appl (2012) 391(1-2):187–208. doi:10.1016/j.physa.2011.07.023
48. Shirazi AH, Jafari GR, Davoudi J, Peinke J, Tabar MRR, Sahimi M. Mapping stochastic processes onto complex networks. J Stat Mech Theor Exp (2009) 2009(07):P07046. doi:10.1088/1742-5468/2009/07/p07046
49. Jurczyk J, Rehberg T, Eckrot A, Morgenstern I. Measuring critical transitions in financial markets. Sci Rep (2017) 7(1):11564. doi:10.1038/s41598-017-11854-1
50. Kwapień J, Drożdż S. Physical approach to complex systems. Phys Rep (2012) 515(3-4):115–226. doi:10.1016/j.physrep.2012.01.007
51. Namaki A, Jafari G, Raei R. Comparing the structure of an emerging market with a mature one under global perturbation. Phys Stat Mech Appl (2011) 390(17):3020–5. doi:10.1016/j.physa.2011.04.004
52. Nie C-X, Song F-T. Analyzing the stock market based on the structure of kNN network. Chaos Solitons Fractals (2018) 113:148–59. doi:10.1016/j.chaos.2018.05.018
53. Jalan S, Solymosi N, Vattay G, Li B. Random matrix analysis of localization properties of gene coexpression network. Phys Rev (2010) 81(4):046118. doi:10.1103/physreve.81.046118
54. Jagannath A, Trogdon T. Random matrices and the New York city subway system. Phys Rev (2017) 96(3):030303. doi:10.1103/physreve.96.030101
56. Mehta ML. Preface to the third edition. In: Random matrices. Amsterdam, Netherlands: Elsevier (2004). p. xiii–xiv.
57. Plerou V, Gopikrishnan P, Rosenow B, Amaral LAN, Guhr T, Stanley HE. Random matrix approach to cross correlations in financial data. Phys Rev (2002) 65(6). doi:10.1103/physreve.65.066126
58. Laloux L, Cizeau P, Potters M, Bouchaud J-P. Random matrix theory and financial correlations. Int J Theor Appl Finance (2000) 03(03):391–7. doi:10.1142/s0219024900000255
59. Namaki A, Raei R, Jafari GR. Comparing Tehran stock exchange as an emerging market with a mature market by random matrix approach. Int J Mod Phys C (2011) 22(04):371–83. doi:10.1142/s0129183111016300
60. Reyes JA, Minoiu C. A network analysis of global banking:1978-2009. IMF Working Papers (2011) 11(74):1. doi:10.5089/9781455227051.001
61. Park C-Y, Shin K. Contagion through national and regional exposures to foreign banks during the global financial crisis. J Financ Stabil (2020) 46:100721. doi:10.1016/j.jfs.2019.100721
62. Gong X-L, Liu X-H, Xiong X, Zhang W. Financial systemic risk measurement based on causal network connectedness analysis. Int Rev Econ Finance (2019) 64:290–307. doi:10.1016/j.iref.2019.07.004
63. Yamamoto S. Banking network multiplier effects on cross-border bank inflows. Int Rev Econ Finance (2020) 70:493–507. doi:10.1016/j.iref.2020.06.003
64. Choi S, Furceri D. Uncertainty and cross-border banking flows. J Int Money Finance (2019) 93:260–74. doi:10.1016/j.jimonfin.2019.01.012
65. Minoiu C, Reyes JA. A network analysis of global banking: 1978–2010. J Financ Stabil (2013) 9(2):168–84. doi:10.1016/j.jfs.2013.03.001
66. Minoiu C, Kang C, Subrahmanian V, Berea A. Does financial connectedness predict crises? Quant Finance (2014) 15(4):607–24. doi:10.1080/14697688.2014.968358
67. Hale G, Kapan T, Minoiu C. Shock transmission through cross-border bank lending: credit and real effects. Rev Financ Stud (2019) 33(10):4839–82. doi:10.1093/rfs/hhz147
68. Hale G, Kapan T, Minoiu C. Crisis transmission through the global banking network. San Francisco, CA: Federal Reserve Bank of San Francisco (2016).
69. Cerutti E, Hale G, Minoiu C. Financial crises and the composition of cross-border lending. J Int Money Finance (2015) 52:60–81. doi:10.1016/j.jimonfin.2014.11.013
70.BIS. Bank for international settlements (bis) (1930). Available at: https://stats.bis.org/.
71. Livan G, Novaes M, Vivo P. Introduction to random matrices. Cham, Switzerland: Springer International Publishing (2018).
72. Pan RK, Sinha S. Collective behavior of stock price movements in an emerging market. Phys Rev (2007) 76(4):046116. doi:10.1103/physreve.76.046116
73. Wang G-J, Xie C, Chen S, Yang J-J, Yang M-Y. Random matrix theory analysis of cross-correlations in the US stock market: evidence from pearson’s correlation coefficient and detrended cross-correlation coefficient. Phys Stat Mech Appl (2013) 392(17):3715–30. doi:10.1016/j.physa.2013.04.027
74. Lim G, Kim S, Kim J, Kim P, Kang Y, Park S, et al. Structure of a financial cross-correlation matrix under attack. Phys Stat Mech Appl (2009) 388(18):3851–8. doi:10.1016/j.physa.2009.05.018
75. Saeedian M, Jamali T, Kamali M, Bayani H, Yasseri T, Jafari G. Emergence of world-stock-market network. Phys Stat Mech Appl (2019) 526:120792. doi:10.1016/j.physa.2019.04.028
Keywords: global banking network, complex systems, random matrix theory, financial contagion, collective behavior
Citation: Namaki A, Raei R, Ardalankia J, Hedayatifar L, Hosseiny A, Haven E and Jafari GR (2021) Analysis of the Global Banking Network by Random Matrix Theory. Front. Phys. 8:586561. doi: 10.3389/fphy.2020.586561
Received: 23 July 2020; Accepted: 26 November 2020;
Published: 18 January 2021.
Edited by:
Anirban Chakraborti, Jawaharlal Nehru University, IndiaReviewed by:
Sunil Kumar, University of Delhi, IndiaCopyright © 2021 Namaki, Raei, Ardalankia, Hedayatifar, Hosseiny, Haven and Jafari. This is an open-access article distributed under the terms of the Creative Commons Attribution License (CC BY). The use, distribution or reproduction in other forums is permitted, provided the original author(s) and the copyright owner(s) are credited and that the original publication in this journal is cited, in accordance with accepted academic practice. No use, distribution or reproduction is permitted which does not comply with these terms.
*Correspondence: Ali Namaki, YWxpbmFtYWtpQHV0LmFjLmly; G. Reza Jafari, Z19qYWZhcmlAc2J1LmFjLmly
Disclaimer: All claims expressed in this article are solely those of the authors and do not necessarily represent those of their affiliated organizations, or those of the publisher, the editors and the reviewers. Any product that may be evaluated in this article or claim that may be made by its manufacturer is not guaranteed or endorsed by the publisher.
Research integrity at Frontiers
Learn more about the work of our research integrity team to safeguard the quality of each article we publish.