
94% of researchers rate our articles as excellent or good
Learn more about the work of our research integrity team to safeguard the quality of each article we publish.
Find out more
ORIGINAL RESEARCH article
Front. Phys., 30 October 2020
Sec. Space Physics
Volume 8 - 2020 | https://doi.org/10.3389/fphy.2020.584063
This article is part of the Research TopicThe Role of Turbulence in the Solar Wind, Magnetosphere, Ionosphere DynamicsView all 22 articles
Turbulent density fluctuations are investigated in the solar wind at sub-ion scales using calibrated spacecraft potential. The measurement technique using the spacecraft potential allows for a much higher time resolution and sensitivity when compared to direct measurements using plasma instruments. Using this novel method, density fluctuations can be measured with unprecedentedly high time resolutions for in situ measurements of solar wind plasma at 1 a.u. By investigating 1 h of high-time resolution data, the scale dependant kurtosis is calculated by varying the time lag τ to calculate increments between observations. The scale-dependent kurtosis is found to increase towards ion scales but then plateaus and remains fairly constant through the sub-ion range in a similar fashion to magnetic field measurements. The sub-ion range is also found to exhibit self-similar monofractal behavior contrasting sharply with the multi-fractal behavior at large scales. The scale-dependent kurtosis is also calculated using increments between two different spacecraft. When the time lags are converted using the ion bulk velocity to a comparable spatial lag, a discrepancy is observed between the two measurement techniques. Several different possibilities are discussed including a breakdown of Taylor’s hypothesis, high-frequency plasma waves, or intrinsic differences between sampling directions.
The solar wind is an excellent example of turbulent plasma where disordered fluctuations are observed in velocity, temperature, and density as well as in electromagnetic fields [1–5]. At large scales, a fluid description of the plasma is valid and fluctuations transverse to the mean magnetic field direction dominate. This region is often termed the inertial range, where magnetic fields and density are often observed with a power spectral density that has a −5/3 spectral index [6–8]. However, the presence of several different species (protons, electrons, and heavy ions), each with their characteristic scales, causes several different distinct ranges to be present in the plasma [9–11]. When fluctuations approach proton scales, kinetic effects become important, the magnetic spectra steepen [7], and fluctuations become more compressive [12]. In this range, usually called sub-ion range, the Kolmogorov-like phenomenology can be adapted using Hall-MHD and kinetic models. These predict different spectral scaling exponents, typically near the observed values
Turbulent flows tend to develop vortices or eddies, which are intermittently distributed in the flow [30, 31] and are often termed coherent structures. Due to the presence of a strong ambient magnetic field in a plasma, coherent structures become elongated along the magnetic field direction [20, 32, 33]. Furthermore, the plasma allows other types of structures to form such as current sheets, flux ropes, or magnetic vortices [34–38]. These structures are associated with large gradients1 in the measured variables (such as electron density), which are often investigated by calculating differences of time-lagged or spatially lagged variables and evaluating their scale-dependent statistics. A time-lagged increment is defined as:
where
Similarly, a spatial lag between two measurement points at position vectors
To quantify how intermittent a given time interval is, higher-order statistics of increments such as the kurtosis are calculated. Kurtosis is defined as;
and measures the deviation of a probability distribution function from being Gaussian, specifically how heavy the tails of the distribution are. For a Gaussian process, the kurtosis is equal to three. An intermittent signal would be expected to have a scale dependence in the kurtosis [e.g., 39–42] and a departure from self-similar or monofractal scaling2 [43–46].
Previous studies in the solar wind have shown that the kurtosis of magnetic and velocity fluctuations do exhibit a scale dependence in the inertial range [47, 48], suggesting that the inertial range is strongly intermittent. Furthermore, magnetic field measurements also indicate that this range is characterized by multifractal behavior, a standard framework to model intermittency [12, 44]. Different components of the magnetic field have also been shown to have different intermittency properties. The component of the magnetic field along the mean-field direction (also termed the compressive component) has also been shown to be more intermittent at large scales [49] when compared to the transverse components. This was interpreted as a combination of the transverse fluctuations phases being randomized by large scale Alfvénic fluctuations, in effect reducing the kurtosis3. Meanwhile, in the large scale compressive component, Alfvénic fluctuations have very little effect as they are incompressible. Additionally, compressible coherent structures are more prevalent causing the kurtosis to be larger. At smaller scales below proton characteristic scales, there are conflicting observations. In the study of Alexandrova et al. [13] the kurtosis was found to increase rapidly in the sub-ion range. This is similar to the result of Chhiber et al. [42] in the magnetosheath i.e., a rapid increase in the kurtosis of the fluctuations in the sub-ion range. Meanwhile, observations of Kiyani et al. [44] show that the sub-ion range in the solar wind is monofractal, juxtaposing strongly with the multifractal inertial range. Other studies in the solar wind have observed the fluctuations in density Chen et al. [45] and magnetic field Chhiber et al. [42] which do not have a strong increase of the scale-dependent kurtosis in the sub-ion range. A recent analysis based on empirical mode decomposition concluded that the sub-ion scale turbulence of density fluctuations is not intermittent [50]. However, in the study of Sorriso-Valvo et al. [46] different methods applied to density measurements of the same intervals yielded different results. The various different results point to the fact that higher order statistics obtained in plasma turbulence are not universal, but may depend on the specific interval.
The majority of the studies mentioned have used single spacecraft measurements and have used a time lag (Eq. 1) to obtain the fluctuation. This is limited to investigating a single direction (i.e., along the bulk velocity vector), and also requires an assumption that the plasma does not evolve over the timescale it requires to be measured, so that the spacecraft see a one-dimensional spatial cut through the plasma. This assumption is termed Taylor’s frozen in flow hypothesis [51]. To avoid assuming this, multi-point missions such as Cluster and the Magnetospheric MultiScale mission were developed which allow increments to be calculated using two different spacecraft, overcoming the inherent Spatio-temporal ambiguity associated with single spacecraft observations.
Calculating spatially separated increments defined in Eq. 2 has the advantage that multiple directions can be sampled, but are limited to a single scale for a tetrahedral constellation of four points i.e., six baselines in different direction of size of order
The goal of this paper is to use density fluctuations in the solar wind estimated from the spacecraft potential on the Magnetospheric MultiScale mission to obtain an extremely high time resolution measurement of the electron density [52]. Although there are limitations to this technique, it also has several advantages, most notably the higher time resolution, fewer data gaps, and the absence of large errors due to low particle counts. Using this novel method, density fluctuations can be measured with unprecedented time resolutions. Such time resolutions are not possible using plasma measurements, and exceed what has been done in the current literature with spacecraft potential. This method applied to the MMS spacecraft allows density fluctuations to be measured deep into the sub ion range up to 40 Hz. This range of scales has only previously been accessible to magnetic field measurements in the solar wind [e.g., 12]. Previous studies of density with spacecraft potential [e.g., 53, 54] have been limited to
Data is used from the Magnetospheric MultiScale mission [56] (MMS) when an hour-long interval of burst mode data in the slow solar wind was available. The MMS mission consists of four identical spacecraft in a tetrahedral configuration optimized for studying magnetic reconnection in the Earth’s Magnetosphere. However, there are also intervals of solar wind plasma which have been sampled by MMS. The close spacings of MMS of the order of a few km to tens of km make it an excellent mission to study sub-ion scale turbulence. A 1-h long burst mode interval is analyzed here which was previously studied in [42, 57]. The spacecraft are located at
The Spacecraft potential can be used to estimate the electron density (see e.g., [3, 21–29, 52]). A detailed description of the calibration process and of the spin removal is presented in [52]. It is important to note that the spacecraft have a characteristic charging timescale, and respond to the ambient electron density after that timescale. Assuming constant photoelectron emission this time scale is very large of the order of kiloHertz [32]. This is far outside of our range of interest. Even if we relax the assumption that the photoelectron emission is constant such as when large amplitude electric fields are present the charging timescale is still much larger than the largest scale we survey [61]. Therefore in the solar wind we do not expect any finite charging effects in the solar wind at these scales. The spin is removed by constructing an empirical model of the spacecraft charging by binning the potential based on the spacecraft phase angle. A model is fitted to the median in each bin and then subtracted. For this interval, spin effects were present also in the FPI electron data. These have been removed using the same approach. The spacecraft potential is calculated from measurements performed with the Spin Plane Double Probe instruments [62] and has a sampling rate of 8.192 kHz. The spacecraft potential is measured from the four spin plane probes. The four measured probe to spacecraft potentials are averaged to give the spacecraft potential. If one probe is unavailable i.e. for MMS4 due to one probe becoming unbiased due to a dust strike then the average of two opposing probes is used rather than all four probes [61, 63, 64]. This results in a difference in the quality of the measurement when comparing spacecraft 1 through 3 with 4. The electron density data from FPI the has an upper limit of 3 Hz for electrons due to Poission noise from finite counting statistics. For the spacecraft potential we used the upper limit of 40 Hz to avoid noise from the preamplifier. The limit of 40 Hz was chosen so that the signal from the spacecraft potential is three times larger than a quiet interval when the spacecraft potential is regulated by the Active Spacecraft POtential Control (ASPOC) instrument [65] is operating [52].
An overview of the event is given in Figure 1. Both measurement techniques show good agreement for the electron density. An important caveat of the spacecraft potential is that it can be severely affected by dust strikes or similar inverted signatures discussed by [e.g., 66–68]. These events are characterized by an abrupt jump or drop in the density estimation which can affect the calculation of higher-order statistics [69, 70]. In our sample, there is a sharp decrease in the potential at one point which is likely due to a dust strike, or an inverted signature as discussed by [67]. Such strikes, present in the spacecraft potential data set, are removed here by linear interpolation as they are not density perturbations intrinsic to the solar wind. Rather the perturbation in density is the result of the dust vaporizing on contact with the spacecraft and cause a density perturbation due to the dust/spacecraft interaction. This can be seen in the bottom panel of Figure 1. The interval has a low ion bulk speed of 377 km s−1, a mean electron density from FPI of 8.8 cm−3 and ion and electron plasma beta (dimensionless ratio of plasma pressure to magnetic pressure) of
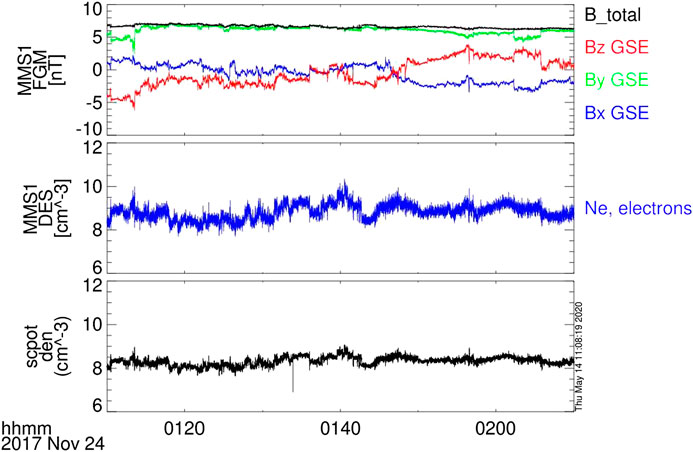
FIGURE 1. Measured data from MMS1 during the interval studied. Top panel shows the three magnetic field components and the magnitude. Middle panel shows the electron density measured from the FPI-DES instrument. Bottom panel shows the electron density measured from the spacecraft potential calibration method.
This interval is a typical example of the slow solar wind. The spacecraft separations are in the range
The power spectral densities of the spacecraft potential-derived electron density, the trace magnetic field and the magnetic field magnitude are shown in Figure 2. The frequencies corresponding to the different spatial scales the ion and electron inertial lengths (
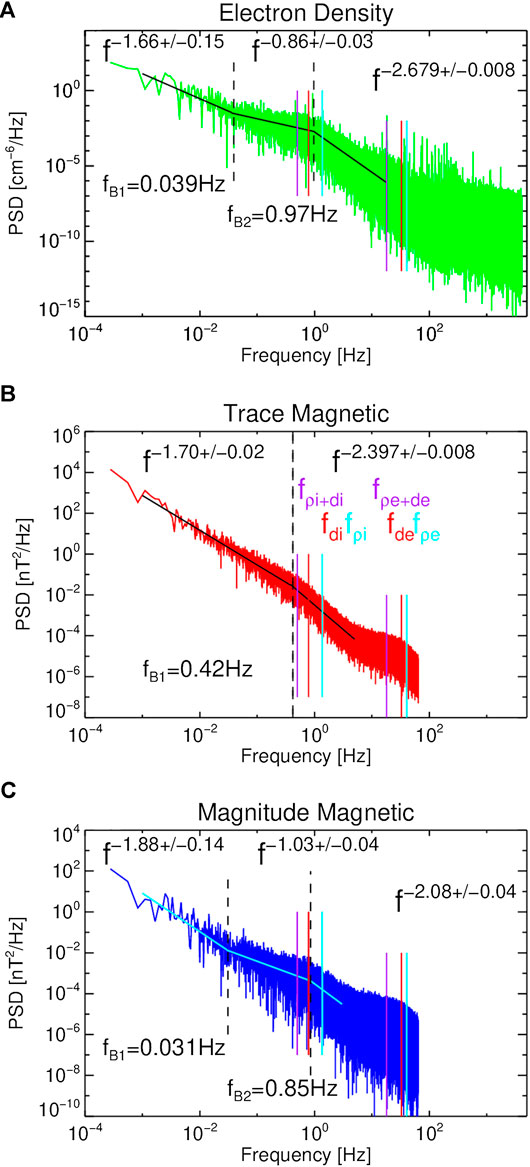
FIGURE 2. Power spectral densities from MMS1. (A) shows the electron density from the spacecraft potential, (B) shows the trace magnetic field from the fluxgate magnetometer (C) shows the magnetic field magnitude from FGM. The colored lines denote several of the characteristic scales, while the black dashed lines denote the spectral breaks. The power-law fits and the break frequencies are indicated on the plots.
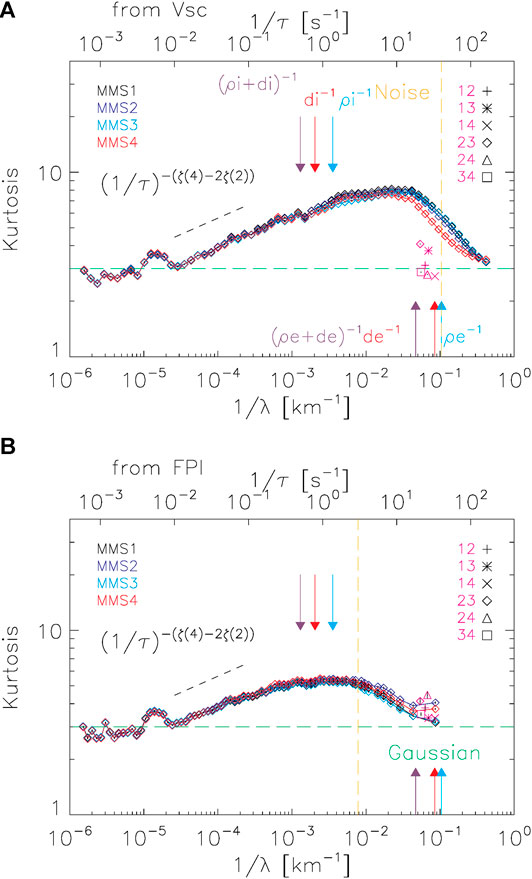
FIGURE 3. Scale-dependent kurtosis for electron density fluctuations obtained from the spacecraft potential (A) and FPI (B). The orange vertical line denotes the region where instrumental noise becomes significant for the two different measurements. The green horizontal line denotes a kurtosis of 3, characteristic of a Gaussian process. The arrows denote the same characteristic scales as previously in Figure 2. The lines denote the time-lagged values from different spacecraft, and the pink data points denote the kurtosis calculated from two spacecraft measurements. Black-dashed lines indicate power-laws expected from the scaling of the structure functions, and are displayed for reference. Error bars are indicated based on 100 bootstrap resamplings but they are smaller than the plotting symbols.
Figure 3 shows the scale-dependent kurtosis of the density fluctuations calculated from both the direct measurement from FPI and from the spacecraft potential. Both time lags (lines) and spatial lags (points) are used for this calculation. An unfortunate consequence of sampling heavily tailed distributions such as turbulent fluctuations is that some large fluctuations might significantly alter higher-order statistics. To ensure better statistical consistency we follow the scheme presented in Kiyani et al. [70]. This involves removing the largest fluctuation in the probability distribution function, recalculating the kurtosis, and repeating until the kurtosis converges. This has the advantage that outliers from either side of the heavy tails will be removed, and do not need any a priori information e.g., the standard deviation [75, 76]. Practically, this does not remove many data points. In our scheme of convergence we set a maximum limit of at most
At the largest scales, the kurtosis
Figure 4 shows the scale-dependent kurtosis for the magnetic field measurements
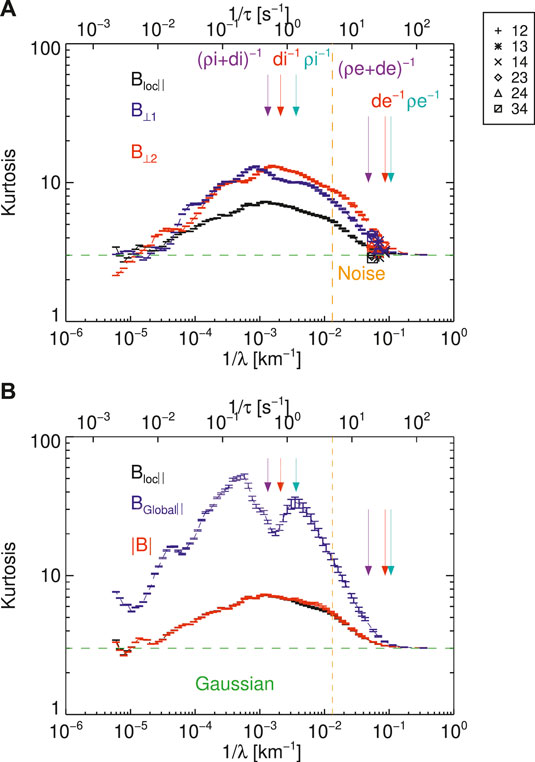
FIGURE 4. (A) The scale-dependent kurtosis for the magnetic field components in a local mean-field co-ordinate system. The connected lines denote the time-lagged increments and the points denote the spatially lagged values. (B) Three different measures of the compressible magnetic field component. Blue denotes the global mean field over the entire interval, red denotes the magnitude of the magnetic field and black denotes the same local mean-field as in (A). The green horizontal line denotes a kurtosis of 3 which corresponds to a Gaussian distribution. The orange vertical line denotes 5 Hz where instrumental noise becomes significant in the fluxgate magnetometer data. The colored arrows denote the characteristic ion scales the cyclotron scale, the inertial length and the Larmor radius.
We also compare our results to other measures of the compressive magnetic field in Figure 4B. Here the kurtosis of the global magnetic field (which is defined as the mean direction of the field over the entire interval) and of the magnitude of the magnetic field are plotted along with that of the local magnetic field. The local magnetic field and the magnitude agree very well with one another, which is expected for the solar wind as the fluctuations in the magnitude are small
Figure 5 shows the probability distribution functions (PDF) for the electron density fluctuations from FPI and the spacecraft potential. These PDFs show the spatial lags (b, d) and the time lags (a, c) where τ corresponds to the spatial lag sizes assuming Taylot's hypothesis. The fluctuations here have been normalized to the standard deviation for each scale. Both spatial lags show approximately Gaussian distributions with low kurtosis values. The pairs which include MMS4 for the spacecraft potential are noticeably different which is again likely to the probe failure on MMS4. The time lags based on the FPI data also show a similar distribution. However, the time lags from the spacecraft potential are leptokurtic and show prominent heavy tails.
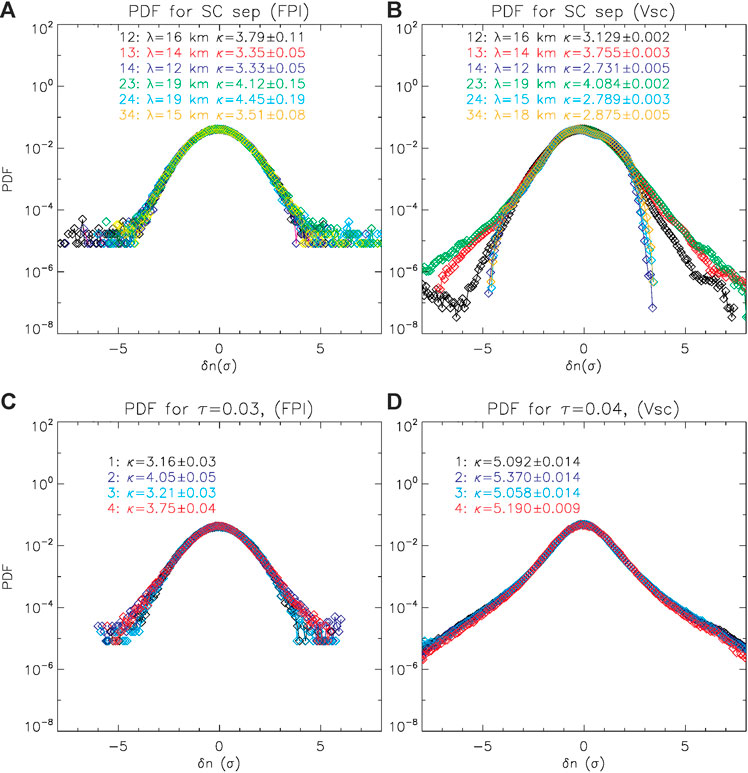
FIGURE 5. Probability distribution functions for standardized density fluctuations based on spatially lagged measurements from FPI-DES (A) from spacecraft potential (B) and for time lags at a comparable scale to the spatial lags for FPI (C) and for the spacecraft potential (D).
Figure 6 shows the m-th order structure functions from m = 1 to m = 6. These are defined as:
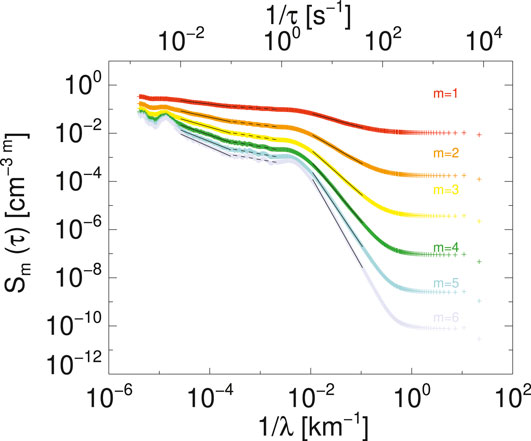
FIGURE 6. The m-th order structure functions for m = 1 to m = 6. The straight lines denote fits over three different time lag ranges the inertial scales
For an intermittent signal at higher orders of m (
The maximum order that can be estimated accurately is dependent on the intermittency in the signal, and the length of the time interval used. A rough estimate for the largest order that can be estimated is
The structure functions show two distinct ranges with power-law behaviour
The variation with the order m of the scaling exponents
For a monofractal scale-invariant process the scaling index expected to vary linearly as
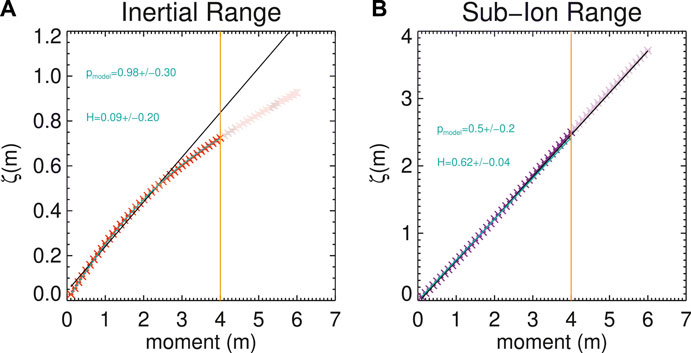
FIGURE 7. Scaling exponents ζ as a function of the moment m for the inertial (A) transition (B) and sub-ion ranges. The exponents here correspond to the black lines in Figure 6. The cyan lines denote p-model fits, and the black line denotes a linear fit to orders below 3.
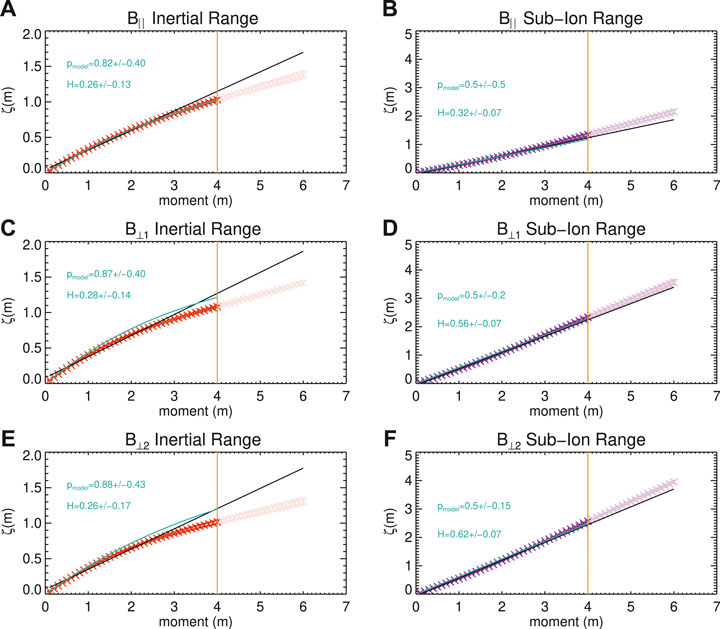
FIGURE 8. Scaling exponents ζ as a function of the moment m for the magnetic field. (A, B) denote the compressive component for the two ranges mentioned previously. (C, E) denote the scaling index for the inertial range for the two transverse components (D, F) denote the scaling exponent for the sub-ion range transverse components.
In order to obtain a more quantitative estimate of the level of intermittency, each scaling exponent curve can be fitted to a standard p-model of intermittent turbulence [81]. In such phenomenological framework, intermittency is modeled as the result of a multifractal multiplicative cascade for the fraction of volume in which the energy is transferred across scales. It predicts a simple relation for the scaling exponents:
The scaling exponents presented in the various panels of Figures 7, 8 have been fitted to a p-model, and the quality of the fit is excellent in all cases. Note that the p-model fit was performed only using exponents up to the fourth order, to ensure statistical convergence. However, we point out that the fitting parameters remain basically unchanged when all six orders are included. We therefore include the higher orders (with lighter colour plotting symbols) in the figures, with the caveat that they might be poorly statistically described. The solid cyan lines in the Figures 7, 8 represent those fits, and the resulting intermittency parameters
In the sub-ion range, the p-model fitting parameter
The evolution of the scale-dependent kurtosis is shown to increase throughout the inertial range until it reaches the proton characteristic scales whereafter it decreases in the magnetic field or plateaus as in the density. This behavior is different from that in the magnetosheath, where the scale-dependent kurtosis continues to increase down to the smallest scales [42]. This may be due to the magnetosheath turbulence being strongly driven by the shock while the solar wind turbulence is decaying and the kurtosis decreases with radial distance [e.g., 83, 84]. This is to say that turbulence in the solar wind at large heliocentric distances is far from the drivers, e.g., velocity shears between streams, shocks, etc. Another possibility is that high-frequency wave activity in the solar wind may act in the sub-ion range to reduce the kurtosis [48]. These waves would need to have the property of having strong wavevector anisotropy
One of the more puzzling results here is that there is a difference between the time and the spatial lags of the electron density from spacecraft potential. For the magnetic field data and the density from FPI, there is an agreement between the time and the spatial lags. However, this is somewhat misleading as the time lags are heavily affected by instrumental noise. As instrumental noise is uncorrelated between spacecraft the spatial lags are more robust to the effects of noise. In the spacecraft potential data, the time lag corresponding to the spatial separation occurs before instrumental noise becomes significant and show a leptokurtic distribution. The spatial lags show approximately Gaussian distributions. This could be due to several reasons. Firstly, there may be a physical difference between the different directions i.e., that there are more structures in the direction of the bulk flow (time lags) as opposed to other directions (spatial lags). This may be a naturally occurring difference or there could be a sampling effect related to the bulk flow direction [88]. Another possibility is that Taylor’s hypothesis breaks down in this region. In the numerical study of [89] they concluded that the Taylor’s hypothesis is likely to be violated at small scales for intervals where the Alfvén speed is comparable to the bulk speed [e.g., in the magnetosheath 90]. The geometry of the magnetic field with respect to the bulk velocity direction also plays a role with more radial configurations of the magnetic field being more likely to violate the hypothesis. In this interval
The scale-dependent kurtosis of the magnetic field gives complementary information to the density. In Figure 4 we see that the compressive component is smaller than the transverse components. This is different from observations of larger scales where the opposite is true [49], this may reflect a difference in the nature of coherent structures. At large scales coherent structures are likely strongly compressive, magnetic holes or boundaries between streams, while in the ion ranges the structures may be predominantly incompressible or very weakly compressible such as Alfvénic vortices and current sheets [34, 37]. There is a large difference between the scale-dependent kurtosis using a global mean as opposed to a local mean or the magnitude of the magnetic field. Using a global field may result in a larger kurtosis as it is potentially polluted by some of the transverse coherent structures. However, when using a local field gradients may not be able to be identified. In this case the local magnetic field agrees well with the values of the kurtosis of magnetic field magnitude and the density. The good agreement between the local magnetic field and the magnitude is likley because the fluctuations are small. However as the fluctuations are larger in the magnetosheath the magnitude may not be reliable, and one should use a local definition. However, it should be stressed that both approaches to calculating a local field have advantages and limitations, and the choice has implications for the interpretation of the results as shown here.
When comparing the spatial lags of the magnetic field and the density we see agreement between all of the different methods, that they all have small kurtoses. This complements previous measurements of the power of compressive and transverse fluctuations i.e. that they have similar powers in the sub-ion range [12, 20]. One potential explanation for this is that the fluctuations are kinetic Alfvén wave-like. As the KAW develops a larger wavenumber in the perpendicular direction it becomes strongly compressive. In the sub-ion range, this could account for equal power in the compressive and two transverse components [e.g., 12, 96].
Structure-function anaysis presented in Figures 7,8 also suggests that the sub-ion range for magnetic and density fluctuations are monofractal. For the density measurements, the scaling exponents are somewhat smaller than what is expected based on the Fourier spectrum in Figure 2. This may be due to the flattening in the spectrum at ion scales, meaning that there is a shorter range of scales available for fitting compared to the magnetic field data. The flattening of the spectra at ion scales could be due to the competition of large scale slow waves and small scale kinetic Alfvén waves, Hall effects, or an increase in the compressible coherent structures at this range. In this range, the scaling indices are anomalous4 suggesting a larger degree of multifractality in the density fluctuations. However, the scale-dependent kurtosis reaches a plateau and is not very different in Figure 3 when the scales close to the transition range are compared to the sub-ion range. Here we reach a similar conclusion to [46], that different measures of intermittency capture different properties of intermittency. The scaling indices in the sub-ion range of magnetic and density fluctuations suggest monofractal scaling, in agreement with the spatially lagged kurtoses which show predominantly Gaussian statistics. However, the time-lagged measurements show leptokurtic distributions.
To summarize; we have investigated compressive and incompressive intermittency in the solar wind. Using the exceptionally high resolution data provided from MMS allows a view deep into the sub-ion scale with unprecedented time resolution for an in situ measurement of electron density fluctuations. Further more the multiple measurement points allow an investigation of different directions in the plasma. Previous studies of the electron density have been limited to single point measurements and are only able to sample along the bulk flow direction. The results are found to be similar to those found with the magnetic field in [12, 44] and in ion density fluctuations at larger scales than are studied here [45]. In these studies, the scale-dependent kurtosis was not found to evolve significantly and the evolution of scaling index with the order suggested monofractal scaling or only very weak multifractality when juxtaposed with the inertial and transition ranges.
A discrepancy was observed between temporal and spatial lags and we have put forward several possible explanations for this. This could be due to a breakdown in Taylor’s hypothesis. This could be investigated using two spacecraft data where the baseline is aligned with the bulk flow. This would give a direct measurement of whether Taylor’s hypothesis is valid. However, for this interval none of the spacecraft pairs are aligned closely enough to the bulk velocity direction to make such a comparison. Other possibilities include directional differences. To investigate this possibility detailed comparisons with numerical simulations may be needed, and more sampling points than the four points that MMS or Cluster offer. One strong possibility is high-frequency waves which may affect these scales of randomizing the phases of the signal, reducing the kurtosis. Waves such as those described tend to have strong wavevector anisotropies (
The differences in the different measurement techniques support the statement in [46] that to investigate intermittency a variety of different techniques should be employed. We also remark that four-point measurements have revolutionized in situ plasma turbulence study. However, four points are inherently limited to providing either homogeneous coverage of the plasma at a single scale or multi-scale coverage at the cost of losing directional information. The natural next step in investigating space plasma turbulence is to go beyond four points to obtain multi-direction multi-scale measurements [99–101].
The Magnetospheric MultiScale mission data are available from https://lasp.colorado.edu/mms/sdc/public/. The processed spacecraft potential can be accessed at https://www.iwf.oeaw.ac.at/en/research/researchnbspgroups/space-plasma-physics/sc-plasma-interaction/mmsaspoc-data-analysis/.
OR, JT and LS, performed the analysis of the data. The initial manuscript was drafted by OR. OR and RN developed of the density dataset. JT, LS, ZV, and RN contributed to the interpretation of the data and several improvements in the manuscript.
The calibration of the spacecraft potential data at IWF is supported by Austrian FFG projects ASAP15/873685. JT was funded by a Fulbright Austria-Marshall Plan grant. RN was supported by Austrian FWF projects I2016-N20. ZV was supported by the Austrian FWF projects P28764-N27.
The authors declare that the research was conducted in the absence of any commercial or financial relationships that could be construed as a potential conflict of interest.
The authors acknowledge the MMS instrument teams for FPI, FGM, and SDP for providing excellent data which made this study possible.
1. Bale, SD, Kellogg, PJ, Mozer, FS, Horbury, TS, and Reme, H. Measurement of the electric fluctuation spectrum of magnetohydrodynamic turbulence. Phys Rev Lett (2005). 94:215002. doi:10.1103/PhysRevLett.94.215002
2. Podesta, JJ, Roberts, DA, and Goldstein, ML. Power spectrum of small-scale turbulent velocity fluctuations in the solar wind. J Geophys Res (2006). 111:A10109. doi:10.1029/2006JA011834
3. Roberts, OW, Narita, Y, Li, X, Escoubet, CP, and Laakso, H. Multipoint analysis of compressive fluctuations in the fast and slow solar wind. J Geophys Res Space Phys (2017). 122:6940–63. doi:10.1002/2016JA023552
4. Šafránková, J, Nemecek, Z, Nemec, F, Prech, L, Chen, CHK, and Zastenker, GN. Power spectral density of fluctuations of bulk and thermal speeds in the solar wind. Astrophys J (2016). 825:121. doi:10.3847/0004-637X/825/2/121
5. Roberts, OW, Narita, Y, Nakamura, R, Vörös, Z, and Gershman, D. Anisotropy of the spectral index in ion scale compressible turbulence: MMS observations in the magnetosheath. Front Phys (2019). 7: 1–16. doi:10.3389/fphy.2019.00184
6. Tu, CY, and Marsch, E. MHD structures, waves and turbulence in the solar wind: observations and theories. Space Sci Rev (1995). 73:1–210. doi:10.1007/BF00748891
7. Smith, CW, Vasquez, BJ, and Hamilton, K. Interplanetary magnetic fluctuation anisotropy in the inertial range. J Geophys Res (2006). 111:A09111. doi:10.1029/2006JA011651
8. Bruno, R, and Carbone, V. The solar wind as a turbulence laboratory. Living Rev Sol Phys (2013). 10, 2. http://www.livingreviews.org/lrsp-2013-2. doi:10.12942/lrsp-2013-2
9. Kiyani, KH, Osman, KT, and Chapman, SC. Dissipation and heating in solar wind turbulence: from the macro to the micro and back again. Phil Trans Math Phys Eng Sci (2015). 373:20140155. doi:10.1098/rsta.2014.0155
10. Verscharen, D, Klein, KG, and Maruca, BA. The multi-scale nature of the solar wind. Living Rev Sol Phys (2019). 16:5. doi:10.1007/s41116-019-0021-0
11. Sahraoui, F, Hadid, L, and Huang, S. Magnetohydrodynamic and kinetic scale turbulence in the near-Earth space plasmas: a (short) biased review. Rev Mod Plasma Phys (2020). 4:4. doi:10.1007/s41614-020-0040-2
12. Kiyani, K, Chapman, S, Sahraoui, F, Hnat, B, Fauvarque, O, and Khotyaintsev, YV. Enhanced magnetic compressibility and isotropic scale invariance at sub-ion larmor scales in solar wind turbulence. Astrophys J (2013). 763:10. doi:10.1088/0004-637X/763/1/10
13. Alexandrova, O, Lacombe, C, and Mangeney, A. Spectra and anisotropy of magnetic fluctuations in the Earth’s magnetosheath: cluster observations. Ann Geophys (2008). 26:3585–96. doi:10.5194/angeo-26-3585-2008
14. Ferrand, R, Galtier, S, Sahraoui, F, Meyrand, R, Andrés, N, and Banerjee, S. On exact laws in incompressible hall magnetohydrodynamic turbulence. Astrophys J (2019). 881:50. doi:10.3847/1538-4357/ab2be9
15. Bandyopadhyay, R, Sorriso-Valvo, L, Chasapis, A, Hellinger, P, Matthaeus, WH, Verdini, A, et al. In situ observation of hall magnetohydrodynamic cascade in space plasma. Phys Rev Lett (2020). 124:225101. doi:10.1103/PhysRevLett.124.225101
16. Chen, CH, Klein, KG, and Howes, GG. Evidence for electron Landau damping in space plasma turbulence. Nat Commun (2019). 10:740. doi:10.1038/s41467-019-08435-3
17. Alexandrova, O, Saur, J, Lacombe, C, Mangeney, A, Mitchell, J, Schwartz, S, et al. Universality of solar-wind turbulent spectrum from MHD to electron scales. Phys Rev Lett (2009). 103:165003. doi:10.1103/PhysRevLett.103.165003
18. Alexandrova, O, Lacombe, C, Mangeney, A, Grappin, R, and Maksimovic, M. Solar wind turbulent spectrum at plasma kinetic scales. Astrophys J (2012). 760:121. doi:10.1088/0004-637X/760/2/121
19. Sahraoui, F, Huang, SY, Belmont, G, Goldstein, ML, Rétino, A, Robert, P, et al. Scaling OF the electron dissipation range OF solar wind turbulence. Astrophys J (2013). 777:15. doi:10.1088/0004-637X/777/1/15
20. Roberts, OW, Narita, Y, and Escoubet, CP. Direct measurement of anisotropic and asymmetric wave vector spectrum in ion-scale solar wind turbulence. Astrophys J (2017). 851:L11. doi:10.3847/2041-8213/aa9bf3
21. Pedersen, A. Solar wind and magnetosphere plasma diagnostics by spacecraft electrostatic potential measurements. Ann Geophys (1995). 13:118–29. doi:10.1007/s00585-995-0118-8
22. Escoubet, CP, Pedersen, A, Schmidt, R, and Lindqvist, PA. Density in the magnetosphere inferred from ISEE 1 spacecraft potential. J Geophys Res Space Phys (1997). 102:17595–609. doi:10.1029/97JA00290
23. Pedersen, A, Décréau, P, Escoubet, CP, Gustafsson, G, Laakso, H, Lindqvist, PA, et al. Four-point high time resolution information on electron densities by the electric field experiments (EFW) on cluster. Ann Geophys (2001). 19:1483–9. doi:10.5194/angeo-19-1483-2001
24. Pedersen, A, Lybekk, B, André, M, Eriksson, A, Masson, A, Mozer, FS, et al. Electron density estimations derived from spacecraft potential measurements on cluster in tenuous plasma regions. J Geophys Res Space Phys (2008). 113:A07S33. doi:10.1029/2007JA012636
25. Lybekk, B, Pedersen, A, Haaland, S, Svenes, K, Fazakerley, AN, Masson, A, et al. Solar cycle variations of the cluster spacecraft potential and its use for electron density estimations. J Geophys Res Space Phys (2012). 117:A01217. doi:10.1029/2011JA016969
26. Yao, S, He, JS, Marsch, E, Tu, CY, Pedersen, A, Rème, H, et al. Multi-scale anti-correlation between electron density and magnetic field strength in the solar wind. Astrophys J (2011). 728:146. doi:10.1088/0004-637X/728/2/146.
27. Andriopoulou, M, Nakamura, R, Torkar, K, Baumjohann, W, and Hoelzl, B. Deriving plasma densities in tenuous plasma regions, with the spacecraft potential under active control. J Geophys Res Space Phys (2015). 120:9594–616. doi:10.1002/2015JA021472
28. Andriopoulou, M, Nakamura, R, Wellenzohn, S, Torkar, K, Baumjohann, W, Torbert, RB, et al. Plasma density estimates from spacecraft potential using MMS observations in the dayside magnetosphere. J Geophys Res Space Phys (2018). 123:2620–9. doi:10.1002/2017JA025086
29. Torkar, K, Nakamura, R, Wellenzohn, S, Jeszenszky, H, Torbert, RB, Lindqvist, PA, et al. Improved determination of plasma density based on spacecraft potential of the magnetospheric multiscale mission under active potential control. IEEE Trans Plasma Sci (2019). 47:3636–47. doi:10.1109/TPS.2019.2911425
30. Kolmogorov, AN. A refinement of previous hypotheses concerning the local structure of turbulence. J Fluid Mech (1962). 13:83–5. doi:10.1017/s0022112062000518
31. Frisch, U. Turbulence: The Legacy of A. N. Kolmogorov. Cambridge, England: Cambridge University Press (1995).
32. Chen, C, Mallet, A, Schekochihin, A, Horbury, T, Wicks, RT, and Bale, S. Three-dimensional structure of solar wind turbulence. Astrophys J (2012). 758:2. doi:10.1088/0004-637X/758/2/120
33. Roberts, OW, Toledo-Redondo, S, Perrone, D, Zhao, J, Narita, Y, Gershman, D, et al. Ion-scale kinetic Alfvén turbulence: MMS measurements of the Alfvén ratio in the magnetosheath. Geophys Res Lett (2018). 45:7974–84. doi:10.1029/2018GL078498
34. Perrone, D, Alexandrova, O, Mangeney, A, Maksimovic, M, Lacombe, C, Rakoto, V, et al. Compressive coherent structures at ION scales IN the slow solar wind. Astrophys J (2016). 826:196. doi:10.3847/0004-637X/826/2/196
35. Roberts, OW, Li, X, Alexandrova, O, and Li, B. Observation of an MHD Alfvén vortex in the slow solar wind. J Geophys Res Space Phys (2016). 121:3870–81. doi:10.1002/2015JA022248
36. Vörös, Z, Yordanova, E, Echim, MM, Consolini, G, and Narita, Y. Turbulence-generated proton-scale structures in the terrestrial magnetosheath. Astrophys J Lett (2016). 819:L15 1–6. doi:10.3847/2041-8205/819/1/L15
37. Perrone, D, Alexandrova, O, Roberts, OW, Lion, S, Lacombe, C, Walsh, A, et al. Coherent structures at ion scales in fast solar wind: cluster observations. Astrophys J (2017). 849:49. doi:10.3847/1538-4357/aa9022.
38. Wang, X, Tu, CY, He, JS, and Wang, LH. Ion-scale spectral break in the normal plasma beta range in the solar wind turbulence. J Geophys Res Space Phys (2018). 123:68–75. doi:10.1002/2017JA024813.
39. Wu, P, Perri, S, Osman, K, Wan, M, Matthaeus, W, Shay, M, et al. Intermittent heating IN solar wind and kinetic simulations. Astrophys J Lett (2013). 763:L30. doi:10.1088/2041-8205/763/2/L30.
40. Chen, CHK, Leung, L, Boldyrev, S, Maruca, BA, and Bale, S. Ion-scale spectral break of solar wind turbulence at high and low beta. Geophys Res Lett (2014). 41:8081–88. doi:10.1002/2014GL062009.
41. Chasapis, A, Matthaeus, WH, Parashar, TN, Fuselier, SA, Maruca, BA, Phan, TD, et al. High-resolution statistics of solar wind turbulence at kinetic scales using the magnetospheric multiscale mission. Astrophys J (2017). 844:L9. doi:10.3847/2041-8213/aa7ddd.
42. Chhiber, R, Chasapis, A, Bandyopadhyay, R, Parashar, TN, Matthaeus, WH, Maruca, BA, et al. Higher-order turbulence statistics in the Earth’s magnetosheath and the solar wind using magnetospheric multiscale observations. J Geophys Res Space Phys (2018). 123:9941–54. doi:10.1029/2018JA025768.
43. Macek, WM. Multifractality and intermittency in the solar wind. Nonlinear Process Geophys (2007). 14:695–700. doi:10.5194/npg-14-695-2007
44. Kiyani, KH, Chapman, SC, Khotyaintsev, YV, Dunlop, MW, and Sahraoui, F. Global scale-invariant dissipation in collisionless plasma turbulence. Phys Rev Lett (2009). 103:075006. doi:10.1103/PhysRevLett.103.075006
45. Chen, CHK, Sorriso-Valvo, L, Šafránková, J, and Němeček, Z. Intermittency OF solar wind density fluctuations from ION to electron scales. Astrophys J (2014). 789:L8. doi:10.1088/2041-8205/789/1/L8
46. Sorriso-Valvo, L, Carbone, F, Leonardis, E, Chen, CH, Šafránková, J, and Němeček, Z. Multifractal analysis of high resolution solar wind proton density measurements. Adv Space Res (2017). 59:1642–51. doi:10.1016/j.asr.2016.12.024
47. Sorriso-Valvo, L, Carbone, V, Veltri, P, Consolini, G, and Bruno, R. Intermittency in the solar wind turbulence through probability distribution functions of fluctuations. Geophys Res Lett (1999). 26:1801–4. doi:10.1029/1999GL900270
48. Wan, M, Osman, KT, Matthaeus, WH, and Oughton, S. Investigation of intermittency in magnetohydrodynamics and solar wind turbulence: scale-dependent kurtosis. Astrophys J (2012). 744:171. doi:10.1088/0004-637X/744/2/171
49. Bruno, R, Carbone, V, Sorriso-Valvo, L, and Bavassano, B. Radial evolution of solar wind intermittency in the inner heliosphere. J Geophys Res Space Phys (2003). 108:1130. doi:10.1029/2002JA009615
50. Carbone, F, Sorriso-Valvo, L, Alberti, T, Lepreti, F, Chen, CHK, Němeček, Z, et al. Arbitrary-order hilbert spectral analysis and intermittency in solar wind density fluctuations. Astrophys J (2018). 859:27. doi:10.3847/1538-4357/aabcc2
51. Taylor, GI. The spectrum of turbulence. Proc Math Phys Eng Sci (1938). 164:476–90. doi:10.1098/rspa.1938.0032
52. Roberts, OW, Nakamura, R, Torkar, K, Narita, Y, Holmes, JC, Voros, Z, et al. Sub-ion scale Compressive turbulence in the solar wind: MMS spacecraft potential observations. The Astrophys J Suppl S (2020). 250:35. doi:10.3847/1538-4365/abb45d
53. Chen, C, Howes, GG, Bonnell, JW, Mozer, FS, Klein, KG, and Bale, S. Kinetic scale density fluctuations in the solar wind. In: Solar wind 13: proceeding of the thirteenth international solar wind conference solar wind, 1539; Pasadena, CA; (2013). p. 143–6. doi:10.1063/1.4811008
54. Chen, C, Boldyrev, S, Xia, Q, and Perez, JC. Nature of subproton scale turbulence in the solar wind. Phys Rev Lett (2013). 110:225002. doi:10.1103/PhysRevLett.110.225002
55. Safrankova, J, Nemecek, Z, Prech, L, and Zastenker, G. Ion kinetic scale in the solar wind observed. Phys Rev Lett (2013). 110:025004. doi:10.1103/PhysRevLett.110.025004
56. Burch, JL, Moore, TE, Torbert, RB, and Giles, BL. Magnetospheric multiscale overview and science objectives. Space Sci Rev (2016). 199:5–21. doi:10.1007/s11214-015-0164-9
57. Bandyopadhyay, R, Chasapis, A, Chhiber, R, Parashar, TN, Maruca, BA, Matthaeus, WH, et al. Solar wind turbulence studies using MMS fast plasma investigation data. Astrophys J (2018). 866:81. doi:10.3847/1538-4357/aade93
58. Jeřáb, M, Něměek, Z, Šafránková, J, Jelínek, K, and Měrka, J. Improved bow shock model with dependence on the IMF strength. Planet Space Sci (2005). 53:85–93. doi:10.1016/j.pss.2004.09.032
59. Russell, CT, Anderson, BJ, Baumjohann, W, Bromund, KR, Dearborn, D, Fischer, D, et al. The magnetospheric multiscale magnetometers. Space Sci Rev (2016). 199:189–256. doi:10.1007/s11214-014-0057-3
60. Pollock, C, Moore, T, Jacques, A, Burch, J, Gliese, U, Saito, Y, et al. Fast plasma investigation for magnetospheric multiscale. Space Sci Rev (2016). 199:331–406. doi:10.1007/s11214-016-0245-4
61. Roberts, OW, Nakamura, R, Torkar, K, Graham, DB, Gershman, DJ, Holmes, J, et al. Estimation of the electron density from spacecraft potential during high frequency electric field fluctuations. J Geophys Res Space Phys (2020). 125:e2020JA027854. doi:10.1029/2020JA027854
62. Lindqvist, PA, Olsson, G, Torbert, RB, King, B, Granoff, M, Rau, D, et al. The spin-plane Double probe electric field instrument for MMS. Space Sci Rev (2016). 199:137–65. doi:10.1007/s11214-014-0116-9
63. Khotyaintsev, YV, Lindqvist, PA, and Nilsson, T. Spin-plane Double Probe instrument/ Axial Double Probe instrument (SDP/ADP) data products guide (2017). Technical Report.
64. Graham, DB, Vaivads, A, Khotyaintsev, YV, Eriksson, AI, André, M, Malaspina, DM, et al. Enhanced escape of spacecraft photoelectrons caused by Langmuir and upper hybrid waves. J Geophys Res Space Phys (2018). 123:7534–53. doi:10.1029/2018JA025874
65. Torkar, K, Nakamura, R, Tajmar, M, Scharlemann, C, Jeszenszky, H, Laky, G, et al. Active spacecraft potential control investigation. Space Sci Rev (2016). 199:515–44. doi:10.1007/s11214-014-0049-3
66. Ye, S, Vaverka, J, Nouzak, L, Sternovsky, Z, Zaslavsky, A, Pavlu, J, et al. Understanding cassini RPWS antenna signals triggered by dust impacts. Geophys Res Lett (2019). 46:10941–50. doi:10.1029/2019GL084150
67. Vaverka, J, Pavlů, J, Nouzák, L, Šafránková, J, Němeček, Z, Mann, I, et al. One-year analysis of dust impact-like events onto the MMS spacecraft. J Geophys Res Space Phy 124 (2019). 8179–90. doi:10.1029/2019JA027035
68. Escoubet, CP, Hwang, KJ, Toledo-Redondo, S, Turc, L, Haaland, SE, Aunai, N, et al. Cluster and MMS simultaneous observations of magnetosheath high speed jets and their impact on the magnetopause. Front Astron Space Sci (2020). 6:78. doi:10.3389/fspas.2019.00078
69. Dudok de Wit, T. Can high-order moments be meaningfully estimated from experimental turbulence measurements? Phys Rev (2004). 70:055302. doi:10.1103/PhysRevE.70.055302
70. Kiyani, K, Chapman, SC, and Hnat, B. Extracting the scaling exponents of a self-affine, non-Gaussian process from a finite-length time series. Phys Rev (2006). 74:051122. doi:10.1103/PhysRevE.74.051122
71. Bandyopadhyay, R, Matthaeus, WH, Chasapis, A, Russell, CT, Strangeway, RJ, Torbert, RB, et al. Direct measurement of the solar-wind taylor microscale using MMS turbulence campaign data. APJ (2020). 899:63. doi:10.3847/1538-4357/ab9ebe
72. King, JH, and Papitashvili, N. Solar wind spatial scales in and comparisons of hourly Wind and ACE plasma and magnetic field data. J Geophys Res (2005). 110:A02104. doi:10.1029/2004JA010649
73. Bruno, R, and Trenchi, L. Radial dependence OF the frequency break between fluid and kinetic scales IN the solar wind fluctuations. Astrophys J Lett (2014). 787 24. doi:10.1088/2041-8205/787/2/L24
74. Chandran, BDG, Quataert, E, Howes, GG, Xia, Q, and Pongkitiwanichakul, P. Constraining low-frequency alfvenic turbulence in the solar wind using density-fluctuation measurements. Astrophys J (2009). 707:1668–75. doi:10.1088/0004-637X/707/2/1668
75. Veltri, P. MHD turbulence in the solar wind: self-similarity, intermittency and coherent structures. Plasma Phys Control Fusion (1999). 41:A787–95. doi:10.1088/0741-3335/41/3A/071
76. Chapman, SC, Hnat, B, Rowlands, G, and Watkins, NW. Scalling collapse and structure functions: identifying self-affinity in finite length time series. Nonlinear Process Geophys (2005). 12:767–74. doi:10.5194/npg-12-767-2005
77. Oughton, S, and Matthaeus, WH. Critical balance and the physics of magnetohydrodynamic turbulence. Astrophys J (2020). 897:37. doi:10.3847/1538-4357/ab8f2a
78. Tennekes, H, and Wyngaard, JC. The intermittent small-scale structure of turbulence: data-processing hazards. J Fluid Mech (1972). 55:93–103. doi:10.1017/S0022112072001661
79. Roberts, OW, Li, X, and Jeska, L. A statistical study OF the solar wind turbulence at ION kinetic scales using the K -filtering technique and cluster data. Astrophys J (2015). 802:1–13. doi:10.1088/0004-637X/802/1/2
80. Alexandrova, O, Chen, CHK, Sorriso-Valvo, L, Horbury, TS, and Bale, SD. Solar wind turbulence and the role of ion instabilities. Space Sci Rev (2013). 178:101–39. doi:10.1007/s11214-013-0004-8
81. Meneveau, C, and Sreenivasan, KR. Simple multifractal cascade model for fully developed turbulence. Phys Rev Lett (1987). 59:1424–1427. doi:10.1103/PhysRevLett.59.1424
82. Schekochihin, AA, Cowley, SC, Dorland, W, Hammett, GW, Howes, GG, Quataert, E, et al. Astrophysical gyrokinetics: kinetic and fluid turbulent cascades in magnetized weakly collisional plasmas. Astrophys J Suppl (2009). 182:310–77. doi:10.1088/0067-0049/182/1/310
83. Wawrzaszek, A, Echim, M, Macek, WM, and Bruno, R. Evolution of intermittency in the slow and fast solar wind beyond the ecliptic plane. Astrophys J Lett (2015). 814: L19. doi:10.1088/2041-8205/814/2/L19
84. Parashar, TN, Cuesta, M, and Matthaeus, WH. Reynolds number and intermittency in the expanding solar wind: predictions based on voyager observations. Astrophys J 884 (2019). L57. doi:10.3847/2041-8213/ab4a82
85. Narita, Y, Plaschke, F, Nakamura, R, Baumjohann, W, Magnes, W, Fischer, D, et al. Wave telescope technique for MMS magnetometer. Geophys Res Lett (2016). 43:4774–80. doi:10.1002/2016GL069035.Received
86. Krasnoselskikh, V, Balikhin, M, Walker, SN, Schwartz, S, Sundkvist, D, Lobzin, V, et al. The dynamic quasiperpendicular shock: Cluster discoveries. Space Science Reviews (2013). 178:535–598. doi:10.1007/s11214-013-9972-y
87. Gary, S. Theory of space plasma microinstabilities. Cambridge, England: Cambridge University Press (1993).
88. Turner, AJ, Gogoberidze, G, Chapman, S, Hnat, B, and Müller, WC. Nonaxisymmetric anisotropy of solar wind turbulence. Phys Rev Lett (2011). 107:095002. doi:10.1103/PhysRevLett.107.095002
89. Perri, S, Valentini, F, Sorriso-Valvo, L, Reda, A, and Malara, F. On the estimation of the current density in space plasmas: multi- versus single-point techniques. Planet Space Sci (2017). 140:6–10. doi:10.1016/j.pss.2017.03.008
90. Stawarz, JE, Eriksson, S, Wilder, FD, Ergun, RE, Schwartz, SJ, Pouquet, A, et al. Observations of turbulence in a kelvin-helmholtz event on 8 september 2015 by the magnetospheric multiscale mission. J Geophys Res Space Phy (2016). 121:11021–11034. doi:10.1002/2016JA023458
91. Chen, C, Bale, S, Salem, C, and Maruca, B. Residual energy spectrum of solar wind turbulence. Astrophys J (2013). 770:125. doi:10.1088/0004-637X/770/2/125
92. Lacombe, C, Alexandrova, O, Matteini, L, Santolík, O, Cornilleau-Wehrlin, N, Mangeney, A, et al. Whistler mode waves and the electron heat flux in the solar wind: cluster observations. Astrophys J (2014). 796:5. doi:10.1088/0004-637X/796/1/5
93. Roberts, OW, Alexandrova, O, Kajdič, P, Turc, L, Perrone, D, Escoubet, CP, et al. Variability of the magnetic field power spectrum in the solar wind at electron scales. Astrophys J (2017). 850:120. doi:10.3847/1538-4357/aa93e5
95. Greco, A, Perri, S, Servidio, S, Yordanova, E, and Veltri, P. The complex structure of magnetic field discontinuities in the turbulent solar wind. Astrophys J (2016). 823:L39. doi:10.3847/2041-8205/823/2/L39
96. Narita, Y. Non-elliptic wavevector anisotropy for magnetohydrodynamic turbulence. Ann Geophys (2015). 33:1413–9. doi:10.5194/angeo-33-1413-2015
97. Roberts, OW, Li, X, and Li, B. Kinetic plasma turbulence in the fast solar wind measured by cluster. Astrophys J (2013). 769:58. doi:10.1088/0004-637X/769/1/58
98. Roberts, OW, and Li, X. Evidence of the ion cyclotron resonance at proton kinetic scales in the solar wind. Astrophys J (2015). 802:1–11. doi:10.1088/0004-637X/802/1/1
99. Klein, KG, Alexandrova, O, Bookbinder, J, Caprioli, D, Case, AW, Chandran, BDG, et al. [Plasma 2020 decadal] Multipoint measurements of the solar wind: a proposed advance for studying magnetized turbulence. Arxiv [Preprint]. 1903.05740. (2019).
100. TenBarge, JM, Alexandrova, O, Boldyrev, S, Califano, F, Cerri, SS, Chen, CHK, et al. [Plasma 2020 decadal] Disentangling the spatiotemporal structure of turbulence using multi-spacecraft data. Arxiv [Preprint]. 1903.05710. (2019).
Keywords: plasma turbulence, intermittancy, solar wind, coherent structure, plasma
Citation: Roberts OW, Thwaites J, Sorriso-Valvo L, Nakamura R and Vörös Z (2020) Higher-Order Statistics in Compressive Solar Wind Plasma Turbulence: High-Resolution Density Observations From the Magnetospheric MultiScale Mission. Front. Phys. 8:584063. doi: 10.3389/fphy.2020.584063
Received: 16 July 2020; Accepted: 17 September 2020;
Published: 30 October 2020.
Edited by:
Marian Lazar, Ruhr-Universität Bochum, GermanyReviewed by:
Vincenzo Carbone, Università della Calabria, ItalyCopyright © 2020 Roberts, Thwaites, Sorriso-Valvo, Nakamura and Voros. This is an open-access article distributed under the terms of the Creative Commons Attribution License (CC BY). The use, distribution or reproduction in other forums is permitted, provided the original author(s) and the copyright owner(s) are credited and that the original publication in this journal is cited, in accordance with accepted academic practice. No use, distribution or reproduction is permitted which does not comply with these terms.
*Correspondence: Owen Wyn Roberts, b3dlbi5yb2JlcnRzQG9lYXcuYWMuYXQ=
Disclaimer: All claims expressed in this article are solely those of the authors and do not necessarily represent those of their affiliated organizations, or those of the publisher, the editors and the reviewers. Any product that may be evaluated in this article or claim that may be made by its manufacturer is not guaranteed or endorsed by the publisher.
Research integrity at Frontiers

Learn more about the work of our research integrity team to safeguard the quality of each article we publish.