- 1Department of Physics, University of Trento, Trento, Italy
- 2Department of Physics, TIFPA-INFN, Trento, Italy
- 3Department of Computer Science, University of Verona, Verona, Italy
- 4INFN Sezione di Roma Tre, Roma, Italy
Different qualities of radiation are known to cause different biological effects at the same absorbed dose. Enhancements of the biological effectiveness are a direct consequence of the energy deposition clustering at the scales of DNA molecule and cell nucleus whilst absorbed dose is a macroscopic averaged quantity which does not take into account heterogeneities at the nanometer and micrometer scales. Microdosimetry aims to measure radiation quality at cellular or sub-cellular levels trying to increase the understanding of radiation damage mechanisms and effects. Existing microdosimeters rely on the well-established gas-based detectors or the more recent solid-state devices. They provide specific energy z spectra and other derived quantities as lineal energy (y) spectra assessed at the micrometer level. The interpretation of the radio-biological experimental data in the framework of different models has raised interest and various investigations have been performed to link in vitro and in vivo radiobiological outcomes with the observed microdosimetric data. A review of the major models based on experimental microdosimetry, with a particular focus on ion beam therapy applications and an emphasis on the microdosimetric kinetic model (MKM), will be presented in this work, enlightening the advantages of each one in terms of accuracy, initial assumptions, and agreement with experimental data. The MKM has been used to predict different kinds of radiobiological quantities such as the relative biological effects for cell inactivation or the oxygen enhancement ratio. Recent developments of the MKM will be also presented, including new non-Poissonian correction approaches for high linear energy transfer radiation, the inclusion of partial repair effects for fractionation studies, and the extension of the model to account for non-targeted effects. We will also explore developments for improving the models by including track structure and the spatial damage correlation information, by using the full fluence spectrum and by better accounting for the energy-deposition fluctuations at the intra- and inter-cellular level.
1 Introduction
Ion beam therapy is becoming a well-established clinical option for tumor treatment, particularly advantageous for the highly localized dose deposition and for the radiobiological properties [1]. While the first feature is obvious, for the macroscopic energy deposition profile, characterized by the Bragg peak in depth, and also often by a sharper lateral penumbra, due to the small multiple Coulomb scattering of fast and heavy particles, the second one is related to microscopic features of the ionization pattern induced by particle radiation, for different charge and energy, down to the molecular scale of the biological target (DNA). The accurate prediction of relative biological effectiveness (RBE) in different positions of an irradiating field is a fundamental requirement, in order to correctly estimate treatment responses [2]. Moreover, RBE depends on several factors, of different nature, biological, patient, and treatment-specific, because of the complexity of the mechanisms of action underlying tumor and normal tissue responses in radiation therapy. A numbers of models have been presented, historically, to predict RBE, attempting to account for such effects. Among these models, the following four main categories can be identified:
(1) Purely phenomenological models: NIRS1 mixed beam approach [3–6], mainly used for carbon ion beams.
(2) Dose-averaged LET (LETD)-based models that exploit a linear relationship between the RBE and the LETD [7–10], used exclusively for proton beams.
(3) Local effect model (LEM)-based models [11–17], mainly used for heavier ions, such as carbon ions;
(4) More general models based on microdosimetry concepts:
a. Models based on the microdosimetric kinetic model (MKM), proposed initially by Hawkins in 1994 [18] and then explored and extended till nowadays [19–23];
b. Other models, such as the repair–misrepair–fixation RMF model [24–26] and phenomenological models based on RBE-weighting functions [27–33].
All the different models present different advantages and limitations. While RBE is not measurable with physical methods, the fourth category allows a strong link with physics measurements through different types of microdosimeters. The present paper is focused on reviewing the modeling of biological effect of protons and other ions used in ion beam therapy based on the microdosimetry concepts with particular emphasis to the MKM, a widely used model to predict the cell survival and the RBE by using microdosimetric data. This topical review is organized as follows: the fundamental microdosimetric quantities [34, 35], required for addressing the problem, are defined in Section 2 together with a focus on relevant experimental quantities. Then, the original formulation of MKM is presented in Section 3 with its theoretical bases (Section 3.1) and followed by the main extensions such as non-Poisson and saturation corrections [19, 20] (Section 3.5), the incorporation of a track model [21], a variable β parameter deriving from the effects of the lesion yield fluctuations in the cell nucleus and domains, [22, 23] in Section 3.8, and the generalization of the model in case of a time structured irradiation introduced in Section 3.7. The available experimental in vitro and in vivo validations are also reported for each extensions. Figure 1 represents a conceptual scheme of the main MKM formulations and extensions presented in this paper. Further, an example of treatment planning systems (TPS) implementation of the MKM [36] will be given in Section 3.6. Other applications of the MKM, such as the oxygen enhancement ratio (OER) modeling [37, 38] and the incorporation of non-targeted effects [39] will be described in Section 3.9. Finally, other models based on microdosimetry as well, i.e., the distribution function by Loncol et al. [40] and the RMF model [24, 25], will be presented in Section 4.
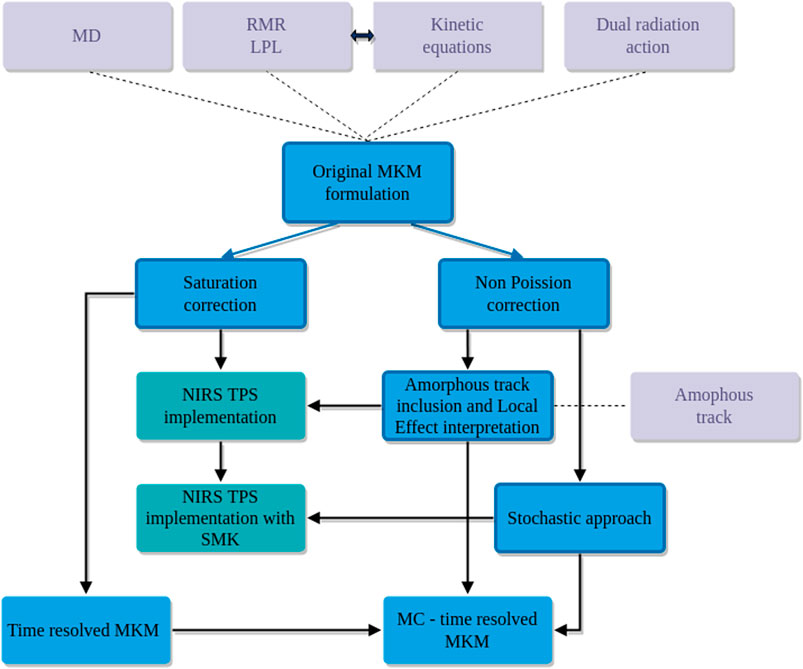
FIGURE 1. Conceptual map of the evolution of some of the microdosimetric kinetic models (blue) considered in this review. Some of these models are currently used for RBE and RBE-weighted dose evaluations in TPS applications (dark cyan). Solid lines refer to the consequentialism of the corrections and extensions while the dotted lines mark the theoretical bases of the considered formulation (light gray color).
2 Microdosimetric Distributions and Their Moments
The main microdosimetric quantities of interest are the specific energy z and lineal energy y [34, 41–43]. The specific energy z is the ratio between energy imparted by ionizing radiation ε and the mass m of the matter that has received the radiation, that is,
The energy imparted ε may be due to one or more energy deposition events, i.e., due to one or more statistically independent particle tracks. The lineal energy y is the ratio between energy imparted to the matter in a volume of interest by a single energy-deposition event,
The stochastic nature of ε and
When dealing with specific energy spectra, it is important to distinguish between the single-event distribution and the multi-event distribution. It is worth stressing that, although experimental microdosimetry determines single event quantities such as the
The single-event distribution, denoted by
The n-event distribution
see [42] for details.
Using the n-event distributions defined above, we can define the general multi-event distribution as
with
The multi–event distribution
Typically, since events are statistically independent,
Denoting by
it follows that the following relation holds true,
being
see [42], Chapter II. In microdosimetry,
Above argument, with particular reference to Eq. (8), yields the form for the average value
see [34, 42]. Again, in the following, if not differently specified, we will consider
Further computations, see [34, 42], shows that regarding the second moment it holds
with
Notation and computations performed in the current section will be extensively used through the work to formally derive analytical solution for some relevant biological endpoints, typically the cell–survival probability, starting from a mathematical model for DNA damage.
In the following, we assume that a cell nucleus is divided into
In order to make computations less heavy as possible, whenever we will say that we average a function
where
where
2.1 Experimental Quantities
In order to account for the different densities and sizes of the sites of radiobiological interests. (e.g., the cell nucleus and the domain), the specific energy z used in the models as described in the following sections can be obtained experimentally through the lineal energy y defined in Eq. (2).
The lineal energy can be measured through a microdosimeter detector, where the most frequently used are the tissue-equivalent proportional counters (TEPC) [44–47]; analogous information can be achieved also by solid-state detectors [48, 49] and gas electron multiplier (GEM) detectors [50, 51], recently investigated for their use in microdosimetric measurements [52, 53]. The relationship between
where ρ and
The theoretical single-event imparted energy,
where
where
In the case of a spherical volume with density ρt = 1 g/cm3, the specific energy
where the constant factor is due to the Gy-keV conversion (1 Gy= 1.6 × 10⁻¹⁶ keV) and to the consideration that the mean chord length in the case of a sphere is
3 Microdosimetric Kinetic Model
The microdosimetric kinetic (KM) model has been developed by Roland B. Hawkins [18] by taking inspiration from the theory of dual radiation action (TDRA) [57, 58], the repair-misrepair model [59, 60], and the lethal-potentially lethal (LPL) model [61, 62]. In the following sections, after a brief description of the historical bases of the model and the details of its original formulation, we compare and contrast the more recent developments of the model.
3.1 Historical Bases
This section presents a brief explanation of the theoretical formulations on which the considered models are based on. In the theory of dual radiation action (TDRA), the concept of dual radiation action is introduced as a process in which cellular lesions are produced as a result of the interaction of pairs of sublesions that are molecular alterations produced by ionizing radiation that in turn results in an observable cellular effect such as a chromosome aberration or cell reproductive death. The TDRA in its original formulation developed for neutron irradiation and then further generalized [57] assumes that, after the cell irradiation, the number of lethal lesions
By evaluating the expectation value of
The interpretation of Eq. (22) is that the number of sublesions is proportional to D and the mean energy concentration around the individual sublesions is proportional to
from which one obtains the dose dependence:
An important additional assumption that drives the dual action process is that sublesions can be produced throughout the nucleus of the cell but can combine with appreciable probability only over distances smaller than the dimension of the nucleus. This effect of sublesion proximity on the formation of lethal lesions was incorporated in the TDRA by the concept of the sites within which such sublesions can combine. In a generalization of the TDRA [58], the interaction probability of sublesions has been also further refined using an explicit function of their separation.
MKM inherits the concept of damage time evolution for the repair or conversion into a lethal irreparable lesion (chromosome aberration) [18, 63, 64] of the primary potentially lethal radiation induced lesions in DNA from the repair–misrepair (RMR) model, developed by Tobias et al. to interpret radiobiological experiments with heavy ions [59, 60]. The RMR model considers that the amount of DSBs in the DNA,
These assumptions yield the following kinetic equations:
where δ is the number of DSBs induced per Gy of radiation, λ is the rate at which DSBs are repaired, κ is the rate constant for second-order DSB interaction, and ϕ is the fraction of simple repairs that are successful. The fraction of misrepairs that result in a lethal lesion is σ.
Like the RMR model, the lethal-potentially lethal (LPL) model [61, 62] accounts that the damages caused by ionizing radiation at the molecular level and contributing to cell death can be separated into two broad classes (i) that which has the potential of being lethal,
where η is the amount of radiation induced DSBs that are reparable, while all the other parameters correspond in meaning to the ones in Eq. (25).
The solutions of the RMR and the LPL models are similar. However, in contrast to the RMR, the LPL predicts that the probability of the interaction between potentially lethal lesions is strongly dependent to the dose-rate and becomes negligible for low dose-rates, where only the channel of the direct creation of lethal events through δ dominate.
3.2 Original Formulation and General Considerations
The MKM computes the cell survival in a way that emphasizes subcellular microdosimetry while abstracting the specific description and modeling of the radiation-induced damage to the cell by using the general categories of lethal and potentially lethal lesions as defined in [61]. More specifically, the MKM is based on the following assumptions [18, 67, 68]:
(1) The cell nucleus is the sensitive target and it is divided into
(2) Radiation can create two different types of DNA damages, called of type I and II.
(3) Type I lesions represent damage that cannot be repaired, for this reason will be also called lethal lesion. On the contrary, type II lesions, also called sub-lethal or potentially-lethal lesions, can be repaired or converted into a lethal lesion either by spontaneous conversion or by binary combination with another sub-lethal lesion.
(4) Type I and II lesions are confined to the domain in which they are created. This assumption defines a sub-nuclear correlation length among lesions in a way that the interaction of two lesions can happen only if they are in close spatial proximity. Specifically, a pair of type II lesions can combine to form a type I lesion only if they are created in the same domain; a remark on this assumption is needed. The idea behind the division of a cell into subvolumes arises because couples of type II lesions are all likely to happen in a short time period, even for lesions that are far away in the cell-nucleus. In order to overcome such a problem, a possible approach is to divide the nucleus into smaller subdomains so that interactions might happen solely inside a single volume, as it is assumed in the MKM. It is important to stress the key role that the choice of such domains plays. In fact, if too big domains imply that far away lesions can interact, on the contrary, too small domains yield that the overall number of lesions inside a single domain is so small that couple interactions are less likely to happen. Therefore, the choice of the best possible division of the cell nucleus into smaller domain is a key aspect of the model and different choices of domains can in principle lead to different results. A possible solution to reduce the sensitivity of the model from the arbitrary choice of the domains is to assume that interactions are possible also within different domains, allowing therefore lesions to move from one domain to another or pairs of lesions to interact if in adjacent domains.
(5) The initial number of type I and II lesions in a single domain d is proportional to the specific energy z in the domain.
If above assumptions hold, then the following further assumption is made regarding the reproductive survival of the cell:
(6) If at least one domain contains a lethal lesion, then the whole cell is “dead.”
It has to be noted that, while the MKM assumptions reported in this section are general, in many studies [69, 70], the lethal lesions are intended to represent a specific complex DNA damage (e.g., lethal chromosome aberrations) that cannot be repaired, whereas the creation of sub-lethal lesions are explicitly associated to the induction of double-strand breaks (DSB) that can be repaired.
Following the MKM notation, we denote by
Type II lesions are assumed that can be repaired with a constant repairing rate r or can be converted to irreparable lesions through a first order process with constant rate a, or at the second order, representing pairwise combinations, with constant rate b. The average number of type I and II lesions at time 0 is proportional to the amount of specific energy
subject to the initial average number of lesions
In the case of ion radiation, typically the rate of pairwise combination between type II lesions is negligible with respect to the first order evaluation of
so that the time-evolution of the average number of type II lesion can be rewritten as
The solution to Eq. (30) can be seen to be
Substituting Eq. (31) into the kinetic Eq. (27) and integrating
An example of the temporal evolution of lesions in a cell is depicted in Figure 2.
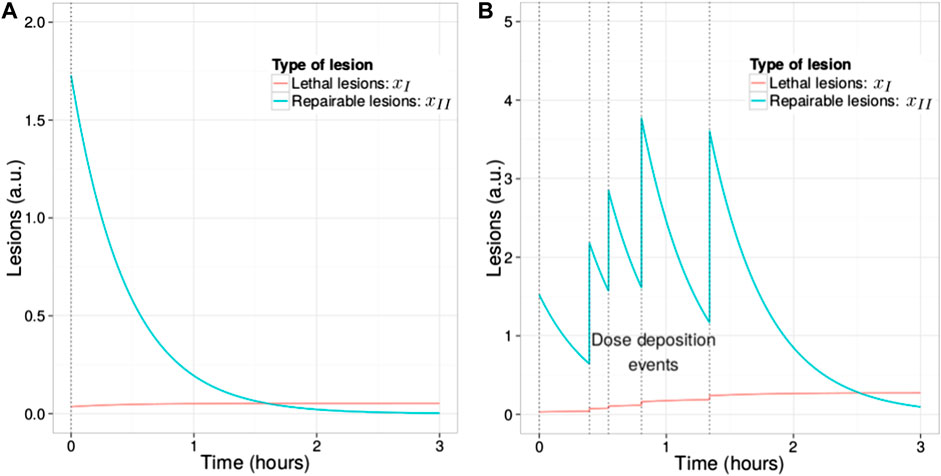
FIGURE 2. Time evolution of
It is important to remark that the exponential decay in Eq. (32) derives from the assumption of first order repair kinetics and that it could likely represents an approximation of more complex repair kinetics present in the real cell [72–75]. Postulating that the total number of lesions
In order to connect the above explicit solution of Eqs (31) and (32), i.e., the average number of type I and II lesions given a certain energy deposition
(7)The lethal lesion distribution given a specific energy z follows a Poisson distribution.
Under the Poisson distribution assumptions stated above, the probability that the domain d does not contain a lethal lesion at time
Using Eq. (32), it can be seen that the average number of lethal lesion given
so that the log-survival for the domain d is given by
with A and B defined as
We remark that these constants are independent of the domain d and specific energy
Indicating with
where
Using Eqs (11) and (12) derived in Section 2, the log survival in Eq. (37) can be written as
with
Notice that in Eq. (37), we have used the notation
we have preferred to specify the dependence upon the multi-event distribution average.
In order to obtain the cell survival
where similar to above, we have denoted by
We remark that Eq. (41) is fundamentally different from Eq. (37) since it considers the average of the argument of the logarithm, whereas in Eq. (37), the average of the logarithm has been taken. This basically indicates that, due to the stochastic nature of
with
with
where the subscript P indicates that the relationships hold when the assumption of Poisson distribution of lethal lesions among the irradiated cell population is reasonable, i.e., for low-LET irradiation, as it is discussed in the following section.
A further refinement of the MKM kinetic equations involves a fourth type of possible interaction that happens at time
(8)After a time
The mathematical formulation of the main kinetic equations remain the same as in Eqs (27)–(32) in the time interval
The solution for the average number of type I lesions can be now explicitly found for
so that we obtain
Proceeding as above, taking therefore the average over all cell domains and cell population, we obtain the generalization of Eq. (44) to be
with
3.3 Link to the Radiobiological Observables
From Eqs (44) and (45), it is possible to obtain the direct link of the model to the phenomenological LQ formulation of the cell survival. The α coefficient is therefore explicitly dependent on the radiation quality through a single term, the dose-averaged specific energy per event
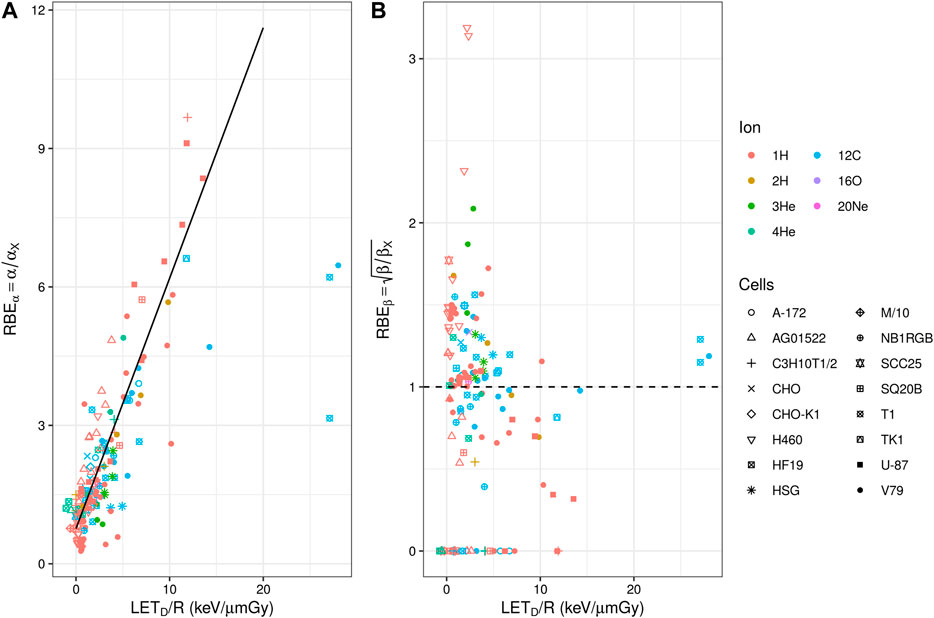
FIGURE 3. (A) Experimental in vitro RBEα (panel a) and
From the knowledge of the LQ parameters, it is possible to derive the dose (D) and radiation quality (
where
Since the parameters
In the case of LET low enough that lethal lesions are Poisson distributed, it is possible to write
where the ratio R can be derived from a nonlinear regression analysis of measured cell survival data for a low-LET reference radiation. Equation (52) can be generalized as
where
3.4 Non-Poisson Correction
In the approximation introduced in Eq. (43), it is assumed that the variance of the specific energy
However, in general, the specific energy observed in the cell is a stochastic quantity that varies from cell to cell, bringing also a deviation from the Poisson distribution when considering the whole population of irradiated cells. We remark that this deviation is present even if the radiation is perfectly mono-energetic. In this case, the variance of the specific energy
The effect of the non-Poisson distribution of lethal lesions is considered by explicitly evaluating the fraction of hit and non-hit cell nuclei. Considering a high-LET irradiation in the limit of very low dose,
A further approximation is assumed in order to match the request of still having a Poisson distribution in the population of hit cells: only a single well defined value of
We denote with
It is possible to explicitly write the global surviving fraction of cells (including both hit and non-hit nuclei) as
This corresponds to consider a probability density function
Equation (55) can be rewritten as
Notice that, in the last passage, we exploited Eq. (43) in order to evaluate the average
The explicit non-Poisson α coefficient is then derived from Eq. (58) and can be formulated as a correction to
where following also the original formulation of Hawkins [19], in the last passage, the quadratic terms
No correction is considered for the β coefficient and it is still assumed to be independent on the energy and particle type.
The non-Poisson correction to the RBE in the limit of zero dose (
with
The correction causes the
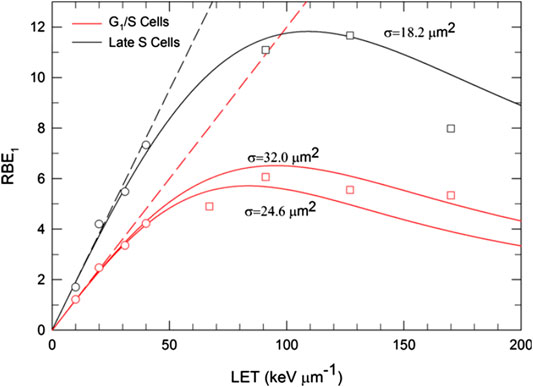
FIGURE 4. Comparison of MKM estimates of particle
We remark that, while the non-Poisson correction factor associated to the linear parameter α is derived in the limit
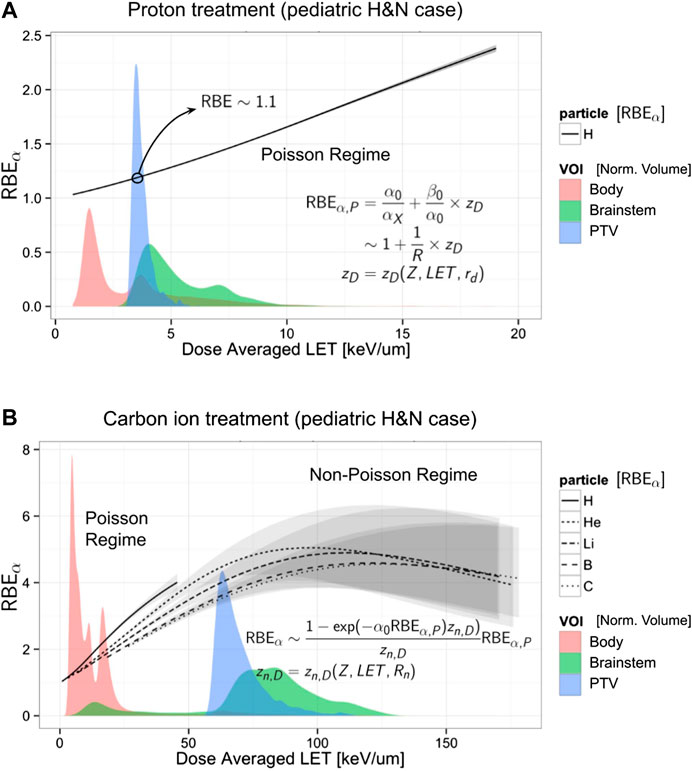
FIGURE 5. Evaluation of the RBEα vs. LETD evaluated via Eq. (61) in combination with an amorphous track model (see Section 3.6) for proton (A) and for carbon and other ions (B). Using the same x axis of the plot is reported for comparison of the LETD volumetric distribution (filled areas) found in a patient (a pediatric brain tumor case) irradiated with a primary beam of protons (A) and carbon ions (B). The LETD distribution is normalized and evaluated in 3 volumes: total body (red), brainstem (green), and the planning target volume, PTV (blue). Annotated in the plot are the low-LET range for the Poisson regime, applicable mainly for the proton treatment, and the Non-Poisson regime, in the case of high-LET carbon ion treatment (for both the primary carbon ions and the fragments). The gray bands represent the 95% confidence band obtained with a bootstrap procedure to the fit of the input parameters
3.5 The Saturation Correction
Kase et al. [20] introduced a correction factor in the MKM to account for the decrease in RBE due to the overkill effect observed in high-LET radiations (see, for example, Figure 6). The correction factor was applied to the dose-averaged specific energy per event,
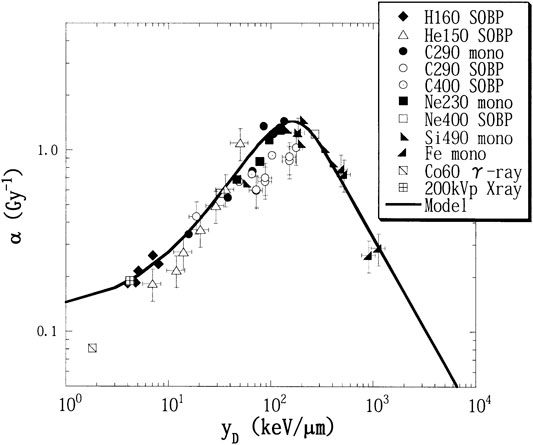
FIGURE 6. Experimental α values, fitted by the linear-quadratic model from the survival curves of HSG cells value with
In terms of lineal energy, the corrected value of
The saturation parameter indicates the lineal energy above which the correction due to the overkill effects became important.
The correction to cell survival is then obtained by evaluating the saturation-corrected dose-averaged specific energy per event
where ρ,
Considering the linear term in the macroscopic dose D, the corrected
No correction is considered for the β coefficient and it is still assumed to be independent on the energy spectrum.
An example of the prediction by MKM modified with the saturation correction compared with experimental data is reported in Figure 6, where the α vs.
A typical used value of the saturation parameter was
Other quantities that one needs to determine for the RBE evaluations are the lineal energy spectra, obtainable with a microdosimeter detector such as TEPC [43] and the values of
where
The saturation-corrected formulation of the MKM is one of the most widely used approaches to estimate the RBE from microdosimetric measurements. Many studies have been published where the computed RBE is compared with the RBE measured along single Bragg peaks or more complex mixed field irradiations [49, 90–92]. In Figure 7, the RBE vs. depth for a proton spread-out Bragg peak is reported as an example of these assessments [92].
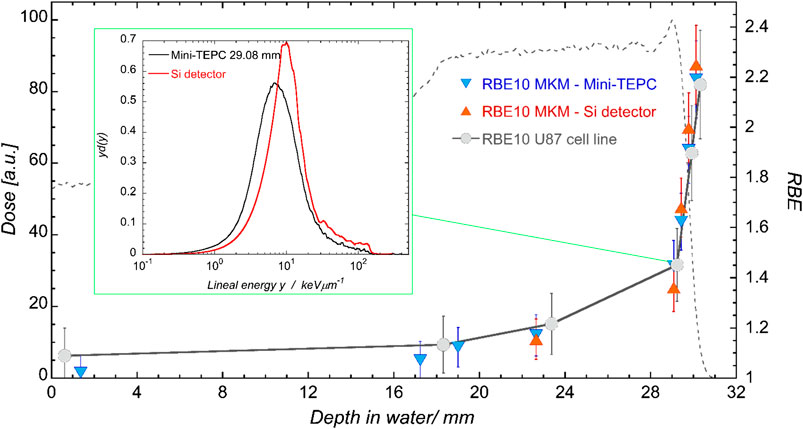
FIGURE 7. Clinical SOBP of CATANA. Dose profile measured with the Markus chamber in black, total LET-dose from Geant4 MC simulation in blue. Crosses indicate positions at which both detectors are measured. The box reports the normalized spectra obtained with the mini-TEPC (black) and the silicon telescope (red) at a depth of 29.08 mm. Plots taken from [92].
3.6 Track Structure Model Incorporation
In 2008, Kase et al. [21] introduced the usage of amorphous track structure models as an alternative numerical approach to evaluate theoretically the dose-averaged per event in the nucleus
The amorphous track model adopted for the MKM calculation is based on a combination of the Kiefer model for the penumbra region [93] and the Chatterjee model for the core radius [94], introduced for explaining the responses of the diamond detector to heavy-ion beams [95]. Here, the core radius
where
where
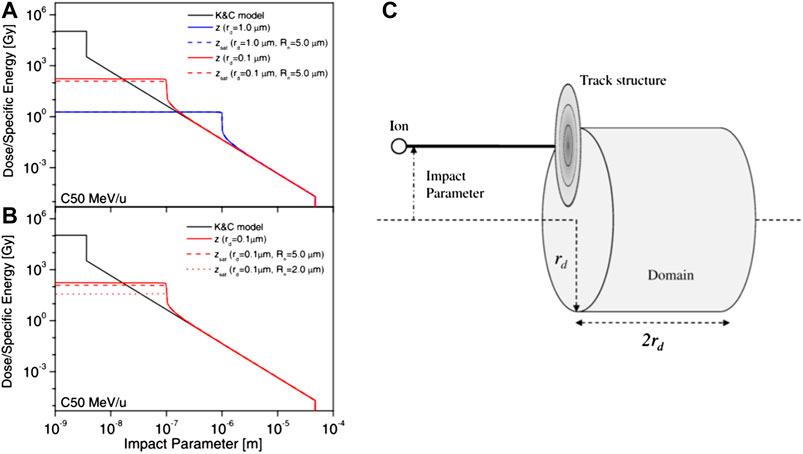
FIGURE 8. (A) and (B) track structures for a carbon-ion beam with a specific kinetic energy of 50 MeV/u calculated with the Kiefer–Chatterjee model and the corresponding dose-averaged specific energy z and saturation-corrected dose-averaged specific energy
As seen in Section 3.4, in the case of high LET irradiation, the
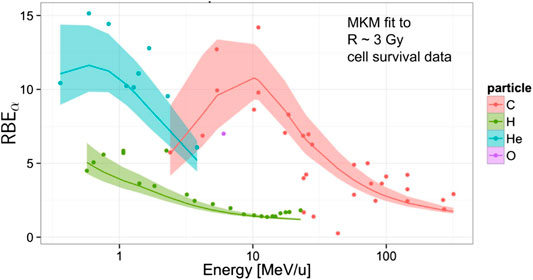
FIGURE 9. Global fitting of the MKM to experimental
Interestingly, the explicit usage of a track model shows how some aspects of the MKM are conceptually similar to that of the LEM [11–17]. In both MKM and LEM, the principal target is the cell nucleus for any radiation quality, the nucleus is divided into small independent sub-volumes (infinitesimal volumes in the case of LEM and domains in the case of MKM), and a cell survival curve for X-rays is adopted as the local dose-effect curve of each sub-volume. Finally, the summation of the local effect in all sub-volumes over the whole nucleus determines the cell survival probability.
The inclusion of the amorphous track model allows to evaluate directly
At present, the MKM is implemented in the proton and carbon ion TPS used clinically at the National Institute of Radiological Sciences (NIRS) in Japan to evaluate the RBE and the RBE-weighted dose optimized for the individual patients. The computation method, developed by Inaniwa et al. [36, 96], takes advantage of the incorporation of the amorphous track model in combination with the saturation-corrected dose-averaged approach developed by Kase et al. [20] described in Section 3.5, for evaluations in case of mixed field irradiation. In the TPS implementation, a set of pre-calculated look-up tables of the saturation corrected specific energies for mono-energetic beams are created using a generalization of Eqs (72), (73) where the saturation effect is explicitly included for the dose-averaged specific energy for the domain
and equivalently for the nucleus, where
with saturation coefficient
where
is the saturation-corrected dose-averaged specific energy of the domain of cells at position i delivered by the j-th beam, obtained through the sum of mono-energetic evaluations,
To obtain the energy imparted
3.7 The Dependence of the Biological Effect on the Dose-Rate Time Structure
One of the interesting features of the MKM, in contrast to other radiobiological models used in ion beam radiotherapy such as the LEM, is the possibility to account inherently for arbitrary time dependent dose-rates, such as protracted irradiations and fractionations. This feature derives from the explicit description of the time depending response of the cell to the irradiation through the kinetic equations (Eq. 32).
Different approaches to investigate and to model the dose-rate time effects have been carried out using the MKM as a theoretical base. Some examples of these approaches can be found in [23, 39, 67, 101–104]. In these studies, the kinetic Eq. (27) is slightly generalized to account for an arbitrary time dependent specific energy deposition rate
where in the second equation, as described in Section 3.2, the second order process describing the pairwise combination between type II lesions has been removed since it is considered negligible if compared to the first-order process.
In [101, 104], the effects of dose-delivery time structure on the RBE in a mixed radiation field of therapeutic carbon ion beams are investigated using the modified microdosimetric kinetic model introduced by Kase et al. [20, 21, 36]. These studies evaluate the biological effect of the irradiation in two different dose-rate conditions: a split-dose irradiation and a protracted continuous irradiation.
In the case of a split-dose irradiation, a population of cells is considered exposed to a macroscopic dose
where
The values of
In the case of a continuous protracted irradiation, a population of cells receive a constant macroscopic dose-rate of
where
The notation used in Eqs (83) and (84) highlights the importance of the quadratic term β, which modulates the impact of the dose-rate time structure, according to the LQ interpretation of the biological effects [105–108].
It is worth remarking that these MKM-based temporal formulations of the cell survival derived from the kinetic Eq. (78) do not account for re-population and cell cycle redistribution. Figure 10 reports the evaluation via Eq. (80) of the survival fraction of HSG cell line for various time intervals compared to experimental data. An initial rise in cell survival due to repair is visible until time interval
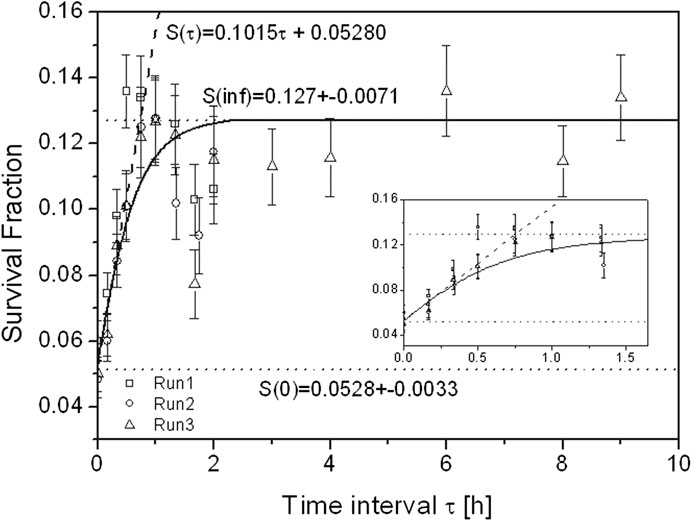
FIGURE 10. Survival fraction of HSG tumor cells after exposure to two equal doses of carbon-ion beams with
3.8 Stochastic Approaches and Variable β
As discussed in the previous sections, the MKM accounts for the stochastic aspects of the induction of damage in the cell by exploiting probability theory to develop simple formulas for the LQ coefficients of the cell survival (Eqs 44, 45, 58, 64, and 83). These formulations of the model are obtained introducing approximations [19] or ad-hoc corrections [20] that shows some discrepancies with experiments for high-LET irradiation, in particular in the determination of the β coefficient, since the measured β tends to decrease at very high LET [82, 109–111], while the β derived from the MKM is considered constant.
The disagreements in the β coefficient are ultimately acknowledged to be induced by the partial accounting of the stochastic nature of the specific energies in the MKM calculations that play an important role for high-LET irradiation [22]. Following these considerations, attempts to improve the model, introducing more refined approaches to account a variable β, have been made [22, 23, 70, 112]. In the rest of this section, some of these developments, based on improved stochastic modelings of the specific energy depositions, are described in detail.
3.8.1 Monte Carlo-Based Evaluations
A method to account in a natural and straightforward way the inherent stochastic nature of the irradiation is to implement a Monte Carlo algorithm in the MKM, as recently shown by Manganaro et al. [23, 113] in their formulation of the model named MCt-MKM (Monte Carlo temporal microdosimetric kinetic model). The implemented model accounts also for the stochastic temporal correlations characteristic of the irradiation process and the cellular repair kinetics by solving explicitly in the MC evaluations the kinetic Eq. (78) where the time dependent specific energy rate
In the MC approach, the irradiation of a complete population of
depending on the particle spectra and track impact positions with respect to the cell. A depiction of the temporal evolution of the lesions (
where
In principle, the tracks can be directly sampled from the full measured microdosimetric spectra (i.e., not only the first and second moment) from which the experimental
Once the time sequence of specific energies in the domains (85) are obtained, the kinetic Eq. (78) can be formally solved for
where
The survival fraction S is obtained by averaging over the entire cell population the survival probability evaluated for each single cell
Notice that the Monte Carlo approach does not compute directly the LQ coefficients α and β, in contrast to the analytical approaches described in the previous sections. However, it is possible to derive the LQ coefficients by simulating a complete survival curve, i.e., by evaluating (89) using different macroscopic doses
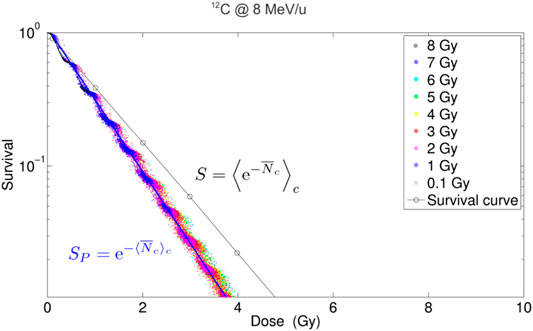
FIGURE 11. Simulated survival curves obtained for acute irradiation,
One of the benefits of the MCt-MKM approach is that both α and β coefficients, obtained through the survival fitting, show the expected saturation behavior for high-LET irradiation without adding any corrective factors, like the non-Poisson (Section 3.4) or (Section 3.5) saturation. The disadvantage of the approach, other than the inherent approximations specific to the used MC transport code and the adoption of an amorphous track model, is that it can be particularly computing intensive, although this is mitigated by exploiting the multi-core parallelism of modern CPUs [113].
The MCt-MKM has been validated on in-vitro experiments considering acute and split-dose irradiation on HSG, T1, and V79 cell lines in aerobic conditions of H, He, C, and Ne ion beams [23]. An example of the behavior of the LQ α and β coefficients is reported in Figure 12, where also a comparison with the prediction of other models, a non-stochastic MKM evaluation, the LEM, and the repair–misrepair–fixation (RMF) model (see Section 4.2), is shown. The main difference with respect to the original MKM is that the MCt-MKM predicts a non-constant and vanishing β with high LET values. This behavior is ultimately due to the non-Poisson statistics inherently implemented in the model. However, we remark that, although, as previously noted, there is a general consensus for a vanishing β for high LET irradiation, there are still contradictory experimental results and significant uncertainties for β vs. LET behavior (see, for example, also [118]). In particular, in Figure 12, the data show a beta significantly larger than zero for a large number of experimental points for He and C ions also for relatively high LET.
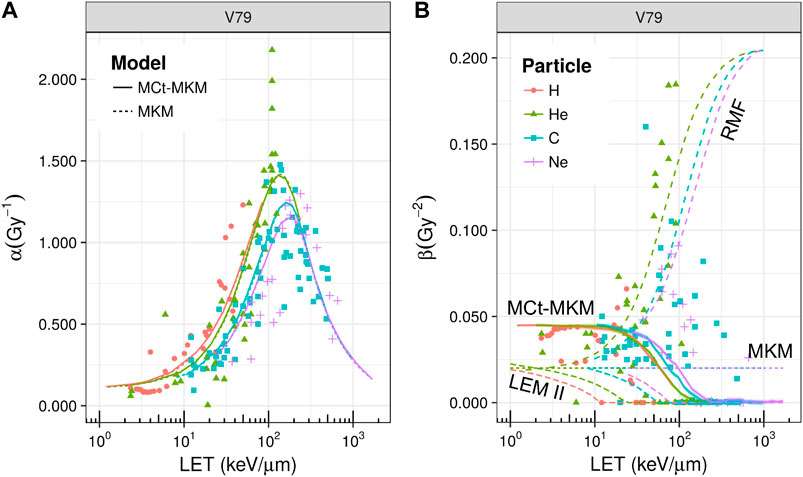
FIGURE 12. Linear quadratic α(panel A) and β(panel B) parameters as a function of LET for the irradiation of V79 cells with different ions. Points represent experimental data taken from PIDE [82], different colors/gray levels and shapes refer to H, He, C, and Ne ions, respectively (the color/gray level and shape legend refers both to panels A and B). In panel A, solid and dashed lines represent, respectively, the extrapolation with the MCt-MKM and the original MKM, while in panel B, a comparison between different models is reported (namely, MKM, MCt-MKM, LEM-II, and RMF). In the case of the MCt-MKM, overlapped to the α and β curves, the MC statistical confidence bands (68%) are reported. These bands are small due to the high statistics and they blend with the curves’ thickness. A saturation effect is observed for both α and β parameters. Plot taken from [23].
The model was also implemented in a TPS [88] to evaluate the effect of the temporal protraction of treatments with different ion beams. The effect of the protraction, described microscopically by Eq. (88), was shown to be compatible with a macroscopic first order effect with temporal constant τ [23]. We remark that, in the framework of the LQ formalism, in the studies of high dose irradiation and the dose-rate effect, such as those reported in [23, 101–104], the specific way β is modeled which plays a fundamental role [119, 120]. In particular, the behavior of a vanishing β for high LET is compatible with the experimental observation of a reduction of the sensitivity to the dose-rate (including the fractionation) in healthy tissues for treatments with high-LET ions and, hence, the potential advantage of hypofractionated treatments with these particles.
3.8.2 The Stochastic Microdosimetic Kinetic Model
The analytical computation method proposed by Sato and Furusawa [22] introduces a correction to the original formulation of MKM, taking into account the stochastic nature of specific energy in both the domain z and the cell nucleus
Based on radiobiological evidences that state that DNA damage saturates at high-LET regions [121, 122], the original assumption of the MKM, that the initial numbers of lethal and sub-lethal lesions produced in a domain to be proportional to the specific energy in the site, is changed in the DSMKM, assuming that the initial numbers of lethal and sub-lethal lesions produced in a domain are proportional to the saturation-corrected specific energy,
where
By applying this new parameter, the natural logarithm of survival for a domain and the nucleus, Eqs (35) and (37), can be rewritten, respectively, as
with the natural log of the survival fraction of cell irradiated with dose D,
The evaluation of the multi-event probability density
The same approach is used to calculate the multi-event probability density of the cell nucleus specific energy, for an absorbed macroscopic dose D,
where
where C is a normalization constant and η is a units conversion coefficient. The parameter γ tunes the slope of the Fermi function or, equivalently, the magnitude of the fluctuation of
Once
To overcome the long computational time of the DSMK model in a TPS workflow, a further optimization is performed for the computation of the survival in (91) that bypasses the necessity to compute the n-fold convolution integral (Eq. 6). In this formulation of the model (SMK), it is assumed that a saturation effect triggered by multiple hits of radiations to a domain is negligibly small so that the magnitude of the effect for the n-event energy deposition can be derived from the estimate with the single event density probabilities (see also Eqs 9 and 12):
and
Following these approximations, the natural log of the survival fraction of a cell can be calculated by substituting Eqs (94) and (95) in Eq. (91), 0btaining
In order to reduce further the computational effort for TPS applications, assuming that in standard condition of ion beam radiotherapy the events inducing the saturation of complex DNA damages are rare, and hence
with
Both DSMK and SMK models can reproduce the measured survival fractions, even for high-LET and high-dose irradiations, whereas the simple saturation-based MKM [20] predicts lower values for these irradiations due to the intrinsic ignorance of the stochastic nature of the cell nucleus specific energies (see Figure 13). In particular, the DSMK model can account for the decrease in the β parameter observed in high-dose irradiations over 10 Gy due to the saturation effect triggered by multiple hits of radiations to a domain.
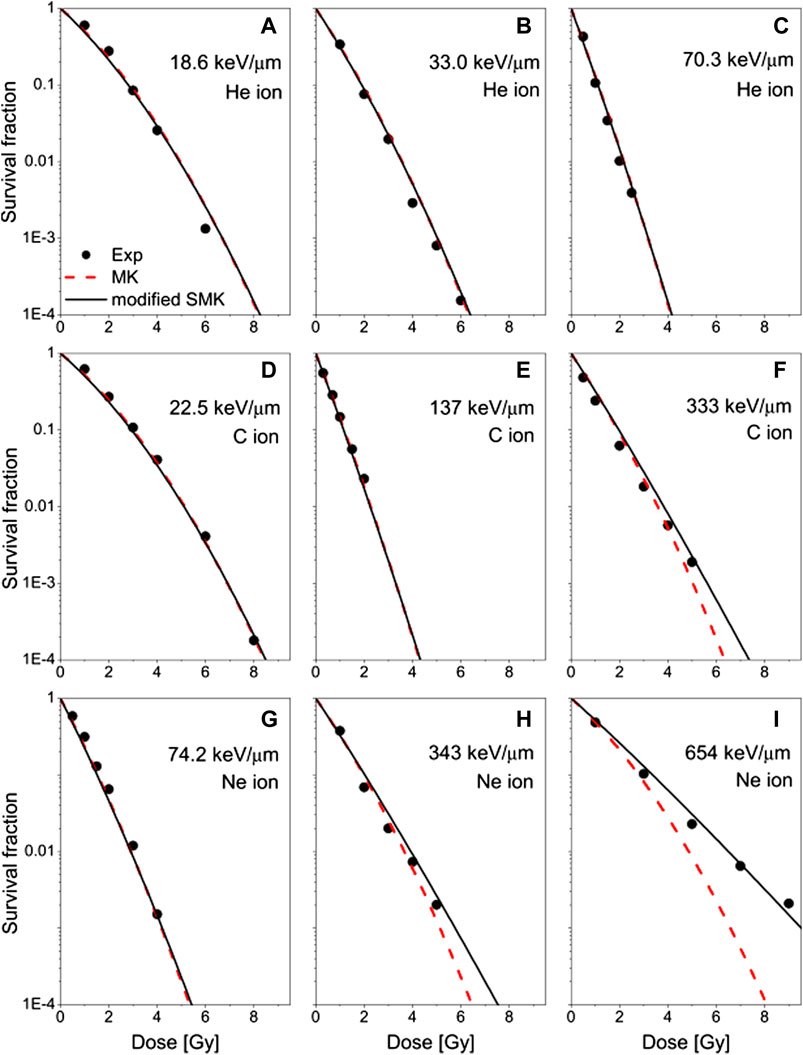
FIGURE 13. The measured survival fractions of the HSG cell exposed to 3He, (A)–(C); 12C, (D)–(F); and 20Ne-ion beams, (G)–(I) at different LETs reported by Furusawa et al. [109] (dots), compared with the estimations based on the modified SMK (solid curves) and the MKM (dashed curves). Experimental data taken from [109]. Plot taken from [112].
3.9 Extensions and Further Improvements
In recent years, a number of studies have been published reporting further refinements and extensions of the MKM. Among these are further improvement accounting of the non-Poissonian statistics [112, 126], the inclusion of an explicit DNA modeling [69, 70], the effect of a heterogeneous cell population including the cell-cycle variance [39, 114, 127], and the inclusion of non-target effects [128]. Extension of the model has been also proposed to compute quantities beyond the RBE, such as the oxygen enhancement ratio (OER) [37, 38]. In the following of this section, some details about a selection of these developments are described.
3.9.1 Oxygen Enhancement Ratio (OER) Modeling
Several experiments show that cellular oxygenation condition strongly affects their response to ionizing radiation. In particular, a significantly lower cell death rate is observed after exposure to ionizing radiation in the presence of a reduced concentration of oxygen in the cells, i.e., in hypoxic conditions. As clinically observed, solid tumors can contain oxygen-deficient regions, thus increasing their radioresistance and potentially leading to treatment failure [129, 130]. An understanding of why high-LET radiations are so effective at overcoming tumor hypoxia [131, 132] is also particularly relevant for the individualization and optimization of ion beam radiotherapy. For this purpose, attempts to extend the MKM to describe the dependence of the radiation effects on the oxygen concentration in cells and to model the oxygen enhancement ratio (OER) have been made [37, 38].
It is interesting to note that these MKM-based approaches, although different, do not focus on OER modeling, a relative value, but directly on the prediction of hypoxic cell survival data, being the OER a derived quantity.
In [37], the reduction of lethal (
In [38], the general approach proposed by Wenzl and Wilkens [134] has been adapted to the amorphous track approach to the MKM [21] (the latter described in Section 3.6). The inclusion of track model ultimately brings to the OER an explicit dependence on ion type while the Wenzl and Wilkens formalism brings an explicit dose and oxygen concentration dependence in the α and β parameters. These characteristics have been exploited, by integrating the model in a TPS, to evaluate the tumor control probability (TCP), to facilitate the identification of the optimal treatment conditions in terms of ion choice and dose fractionation in the presence of hypoxia.
The MKM-based OER models were verified against in vitro data from HSG, V79, and CHO cells in aerobic and hypoxic conditions, irradiated with different ion beams [109]. Examples of the model prediction vs. the experimental data are reported in Figure 14.
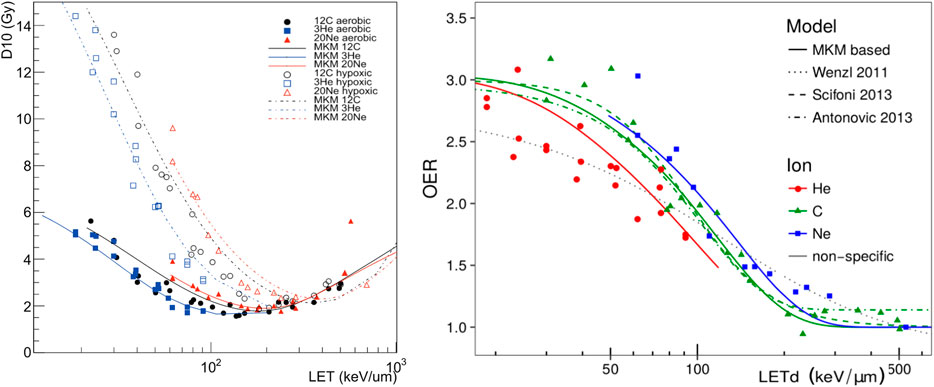
FIGURE 14. (Left)
3.9.2. Non-Targeted Effects
In the majority of cell survival modeling approaches, it is assumed that biological effects of radiation are exclusively due to direct DNA damage resulting from the ionization caused by the incident radiation. In recent years, this assumption has been extensively challenged by considering a variety of indirect processes, also referred to as bystander or non-targeted effects (NTE) that significantly impact on the cellular response to the radiation [137]. NTEs have been interpreted as a result of intercellular communication with cell-killing signals between hit and non-hit cells [138, 139], resulting in induced DNA damage in non-hit cells [140].
Attempts to derive kinetic equations to model the intercellular signaling which incorporates signal production and response kinetics have been made [141–143]. In recent studies, such as by Matsuya et al. [128], an integration of these signaling kinetic equations in the MKM has been proposed.
In this formulation, denoted integrated microdosimetric kinetic (IMK) model, the number of signaling activation events,
where
In non-hit cells, the NTE sub-lethal lesions
where
where δ is a function of the other parameters introduced in the former equations that characterize the intercellular signaling process.
In order to compute the cell survival probability S with the inclusion of both NTEs and targeted effects, an approximation is made in which it is assumed that the probability of interactions between sub-lethal lesions
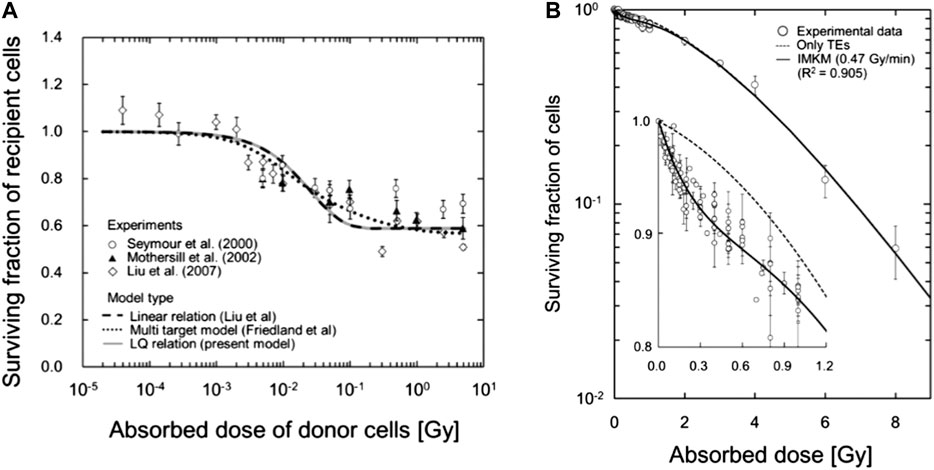
FIGURE 15. (A) Comparison between the IMK model (Eq. 103), continuous gray line in the plot, and experimental medium transfer bystander effect (MTBE) cell survival data. (B) Fitting of the IMK model to experimental cell survival data for V79-379A. Plot taken from [128] (http://creativecommons.org/licenses/by/4.0/).
4 Other Models
This section presents alternative models to determine RBE based on microdosimeric approaches.
4.1 RBE Weighting Functions
The microdosimetric RBE weighting function approach has been proposed initially by Menzel, Pihet, and Wambersie et al. [27, 33] to compare the beam quality of different neutron [27] and proton [144, 145] therapeutic installations using measured microdosimetric distributions of lineal energy. Based on previous studies on proton beams [146, 147], this approach uses measured microdosimetric distributions of lineal energy, y, combined with an experimentally derived biological weighting function, for specific cell line and endpoints,
Let
where r(y) is defined as the response function. Therefore, the model is rigorously valid under the assumption of a low dose approximation where the cellular response function is linear.
P(y) or directly r(y) is experimentally derived. A formulation for r(y) is given in the following [148, 149]:
where the
The set of relations that have to be fitted is hence
The solution of the system of Eq. (106) can be obtained with different methods, such as non-parametric multi-objective optimization methods [150] or iterative procedures [40] through which an initial guess function
4.2 The Repair–Misrepair–Fixation (RMF) Model
The repair–misrepair–fixation (RMF) model combines the RMR and LPL models, adding the consideration of intra- and inter-track2 binary misrepair to predict the biological effect of LET [24–26]. The RMF model considers the entire cell nucleus as the volume for pairwise DSB interactions. In the RMF model, a coupled system of nonlinear ordinary differential equations is used to model the time-dependent kinetics of DSB induction, rejoining, and pairwise DSB interaction to form lethal (and nonlethal) chromosome damage. The model treats initial DSB formation as a compound Poisson process and postulates a first-order repair term that gives rise to exponential rejoining kinetics for most DSB (
An LQ approximation of the solution of the RMF system of differential equations can be expressed as follows [24, 25]:
where
From Eq. (107), it follows that the radiation response of a cell exposed to a low- or high-LET radiation is uniquely determined by one microdosimetric parameter (
From a practical point of view,
In panel (b) of Figure 12, the RMF prediction of the
The RMF has been also implemented in a TPS to evaluate the 3D RBE distribution in irradiated patients [154]. It is interesting to note that one of the appealing aspects of the RMF for TPS studies is that the specific response of the tissue, both healthy and tumoral, is explicitly determined by a single parameter, R. This is a simplification, but allows to study the effect of the specificity of the tissue response in a direct way, also allowing for a distribution of R values and hence easily accounting for the variability and the uncertainty associated to this clinical parameter.
5 Summary
In clinical treatment planning, the RBE has to be calculated by radiobiological mathematical models, which, in spite of all validation efforts, still involve significant sources of uncertainty.
The aim of this review was to present the theoretical aspects of a selection of radiobiological models that emphasize the link of in vitro and in vivo radiobiological outcomes, such as the RBE, to microdosimetric experimental data. We approached these models through a conceptual sketch of their assumptions, highlighting the continuity and leaps of their mathematical formulations. For each model, we addressed the limit of applicability and eventual improvements and the link of their input parameters to experimental observables.
A particular emphasis to the microdosimetric kinetic (MKM)-based models has been given. Starting from its first seminal formulation by Hawkins [18], the MKM has represented an effective approach to link the microdosimetric quantities, which describe the quality of the radiation, to the radiobiological effects and, at present, it is one of the most widely used models to evaluate the RBE in both research and clinical applications. The MKM approach for RBE evaluations has gained a particular interest in recent years, with the appearance of different studies aimed to improve the accuracy of the model and to extend its range of applicability in different biological contexts, such as the OER prediction and non-target effects.
Although sharing similar theoretical bases, the MKM-based models make different assumptions and approximations in their implementation. Based on these differences, the models considered in this review (including also the RMF model) make, in particular, different predictions in the dependence of β on particle LET and the RBE for cell survival in the overkill regime, for particles with a
Two main aspects of the considered models, where recent efforts have brought interesting insight, and where further future studies could bring potential improvements, could be identified. One aspect is the ascertainment of a more accurate link of the theoretical descriptions to specific cellular mechanisms of DNA damage induction and its evolution, exploiting also information from nanodosimetric data. Another aspect is to improve the theoretical statistical description of the involved processes, be them either the stochastic nature of the energy deposition or the stochastic nature of the cell response to the irradiation.
Future comparisons of model predictions with experimental data are hence needed to fully discriminate among competing mechanisms to be incorporated for the improvement of these models to evaluate the RBE.
Author Contributions
VB and AA have provided a critical interpretation of the theoretical aspects of each model and its applications, deciding structure and principal contents of this review. They have cured the links with experimental data underlining limitations and strengths of each approach. The experience and accuracy of AA have leaded the entire work. FG has principally handled the mathematical aspects of the work, his help has been precious in revising notation and clarifying model formulation. ES has helped particularly in the general parts and introduction and has given also his valuable opinion on the structure and contents. MM and FT have given a contribution to experimental links, CT has supervised.
Funding
This work has been partially funded by MoVeIT, NEPTUNE INFN CSN5 projects, and Fondazione CARITRO Cassa di Risparmio di Trento e Rovereto.
Conflict of Interest
The authors declare that the research was conducted in the absence of any commercial or financial relationships that could be construed as a potential conflict of interest.
Footnotes
1National Institute of Radiological Sciences (NIRS, Chiba, Japan).
2Intratrack binary misrepair occurs when an energy deposition along the track forms two or more DSBs that interact in pairwise mode to form an exchange. Intertrack, instead, is a binary misrepair arising from the pairwise interaction of break ends associated with DSBs that were formed by two separate radiation tracks through a cell.
References
1. Durante M, Orecchia R, Loeffler JS. Charged-particle therapy in cancer: clinical uses and future perspectives. Nat Rev Clin Oncol (2017) 14:483. doi:10.1038/nrclinonc.2017.30
2. Durante M, Loeffler JS. Charged particles in radiation oncology. Nat Rev Clin Oncol (2010) 7:37. doi:10.1038/nrclinonc.2009.183
3. Kanai T, Furusawa Y, Fukutsu K, Itsukaichi H, Eguchi-Kasai K, Ohara H. Irradiation of mixed beam and design of spread-out Bragg peak for heavy-ion radiotherapy. Radiat Res (1997) 147:78–85.
4. Kanai T, Endo M, Minohara S, Miyahara N, Koyama-Ito H, Tomura H, et al. Biophysical characteristics of HIMAC clinical irradiation system for heavy-ion radiation therapy. Int J Radiat Oncol Biol Phys (1999) 44: 201–10.
5. KawachiMatsufuji H, Mizoe J, Kamada T, Baba M, Kato S, Kato H, et al. Overview of clinical experiences on carbon ion radiotherapy at NIRS. Radiother Oncol (2004) 73(Suppl 2) S41–9. doi:10.1016/s0167-8140(04)80012-4
6. MiyamotoTsuji J, Wambersie A, Octave-Prignot M, De Coster B, Grégoire V. Radiobiological characterisation of clinical beams: importance for the quality assurance (QA) programme in ion beam therapy. Int J Radiat Oncol Biol Phys (2006) 9:173–178. doi:10.1080/713844023
7. Carabe A, Moteabbed M, Depauw N, Schuemann J, Paganetti H. Range uncertainty in proton therapy due to variable biological effectiveness. Phys Med Biol (2012) 57:1159–72. doi:10.1088/0031-9155/57/5/1159
8. Wedenberg M, Toma-Dasu I. Disregarding RBE variation in treatment plan comparison may lead to bias in favor of proton plans. Med Phys (2014) 41:091706. doi:10.1118/1.4892930
9. Jones B. Towards achieving the full clinical potential of proton therapy by inclusion of LET and RBE models. Cancers (2015) 7:460–80. doi:10.3390/cancers7010460
10. McNamara AL, Schuemann J, Paganetti H. A phenomenological relative biological effectiveness (RBE) model for proton therapy based on all published in vitro cell survival data. Phys Med Biol (2015) 60:8399–416. doi:10.1088/0031-9155/60/21/8399
11. Scholz M, Kraft G. A parameter-free track structure model for heavy ion action cross sectionsBiophysical modelling of radiation effects. Radiat Res (1997) 147:78–85 (1992).
12. Scholz M, Kraft G. Track structure and the calculation of biological effects of heavy charged particles. Adv Space Res (1996) 18:5–14. doi:10.1016/0273-1177(95)00784-c
13. Scholz M, Kellerer AM, Kraft-Weyrather W, Kraft G. Computation of cell survival in heavy ion beams for therapy. The model and its approximation. Radiat Environ Biophys (1997) 36:59–66. doi:10.1007/s004110050055
14. Elsässer T, Scholz M. Cluster effects within the local effect model. Radiat Res (2007) 167:319–29. doi:10.1667/RR0467.1
15. Elsässer T, Krämer M, Scholz M. Accuracy of the local effect model for the prediction of biologic effects of carbon ion beams in vitro and in vivo. Int J Radiat Oncol Biol Phys (2008) 71:866–72. doi:10.1016/j.ijrobp.2008.02.037
16. Elsässer T, Weyrather WK, Friedrich T, Durante M, Iancu G, Krämer M, et al. Quantification of the relative biological effectiveness for ion beam radiotherapy: direct experimental comparison of proton and carbon ion beams and a novel approach for treatment planning. Int J Radiat Oncol Biol Phys (2010) 78:1177–83. doi:10.1016/j.ijrobp.2010.05.014
17. ScholzKragl T, Scholz U, Elsässer T, Durante M, Scholz M. Calculation of the biological effects of ion beams based on the microscopic spatial damage distribution pattern. Int J Radiat Biol (2012) 88:103–7. doi:10.3109/09553002.2011.611213
18. Hawkins RB. A statistical theory of cell killing by radiation of varying linear energy transfer. Radiat Res (1994) 140:366–74.
19. Hawkins RB. A microdosimetric-kinetic model for the effect of non-Poisson distribution of lethal lesions on the variation of RBE with LET. Radiat Res (2003) 160:61–9. doi:10.1667/rr3010
20. Kase Y, Kanai T, Matsumoto Y, Furusawa Y, Okamoto H, Asaba T, et al. Microdosimetric measurements and estimation of human cell survival for heavy-ion beams. Radiat Res 166 (2006) 629–38. doi:10.1667/RR0536.1
21. ShinodaSakama Y, Kanai T, Matsufuji N, Furusawa Y, Elsässer T, Scholz M. Biophysical calculation of cell survival probabilities using amorphous track structure models for heavy-ion irradiation. Phys Med Biol (2007) 53:37. doi:10.1088/0031-9155/53/1/003
22. Sato T, Furusawa Y. Cell survival fraction estimation based on the probability densities of domain and cell nucleus specific energies using improved microdosimetric kinetic models. Radiat Res (2012) 178:341–56. doi:10.1667/rr2842.1
23. Manganaro L, Russo G, Cirio R, Dalmasso F, Giordanengo S, Monaco V, et al. A Monte Carlo approach to the microdosimetric kinetic model to account for dose rate time structure effects in ion beam therapy with application in treatment planning simulations. Med Phys (2017) 44:1577–89. doi:10.1002/mp.12133
24. AttiliMuraro DJ, Stewart RD, Semenenko VA, Sandison GA. Combined use of Monte Carlo DNA damage simulations and deterministic repair models to examine putative mechanisms of cell killing. Radiat Res (2008) 169:447–59. doi:10.1667/RR1046.1
25. Frese MC, Yu VK, Stewart RD, Carlson DJ. A mechanism-based approach to predict the relative biological effectiveness of protons and carbon ions in radiation therapy. Int J Radiat Oncol Biol Phys (2012) 83:442–50. doi:10.1016/j.ijrobp.2011.06.1983
26. Stewart RD, Carlson DJ, Butkus MP, Hawkins R, Friedrich T, Scholz M. A comparison of mechanism-inspired models for particle relative biological effectiveness (RBE). Med Phys (2018) 45:e925–2. doi:10.1002/mp.13207
27. Pihet P, Menzel H, Schmidt R, Beauduin M, Wambersie A. Biological weighting function for RBE specification of neutron therapy beams. Intercomparison of 9 European centres. Radiat Protect Dosim (1990) 31:437–42.
28. Menzel HG, Pihet P, Wambersie A. Microdosimetric specification of radiation quality in neutron radiation therapy. Int J Radiat Biol (1990) 57:865–83. doi:10.1080/09553009014550991
29. Wambersie A, Pihet P, Menzel H. The role of microdosimetry in radiotherapy. Radiat Protect Dosim (1990) 31:421–32.
30. Wambersie A. Contribution of microdosimetry to the specification of neutron beam quality for the choice of the clinical RBE’in fast neutron therapy. Radiat Protect Dosim (1994) 52:453–60.
31. Gerlach R, Roos H, Kellerer AM. Heavy ion RBE and microdosimetric spectra. Radiat Protect Dosim (2002) 99:413–8. doi:10.1093/oxfordjournals.rpd.a006821A
32. Wambersie A, Hendry JH, Andreo P, DeLuca PM, Gahbauer R, Menzel H, et al. The RBE issues in ion-beam therapy: conclusions of a joint IAEA/ICRU working group regarding quantities and units. Radiat Protect Dosim 122 (2006) 463–70. doi:10.1093/rpd/ncl447
33. Whitmore A, Sato T, Matsuya Y, Kase Y, Magrin G, Verona C, et al. Development of a new microdosimetric biological weighting function for the RBE10 assessment in case of the V79 cell line exposed to ions from 1H to 238U. Phys Med Biol (2020) 27:87–123. doi:10.1088/1361-6560/abbf96
34. Booz J, Braby L, Coyne J, Kliauga P, Lindborg L, Menzel H, et al. Journal of the International Commission on radiation Units and measurements. NP–NP (1983). Report 36.
36. Inaniwa T, Furukawa T, Kase Y, Matsufuji N, Toshito T, Matsumoto Y, et al. Treatment planning for a scanned carbon beam with a modified microdosimetric kinetic model. Phys Med Biol (2010) 55:6721. doi:10.1088/0031-9155/55/22/008
37. NodaFurusawa C, Hirayama R, Inaniwa T, Kitagawa A, Matsufuji N, Noda K. Adaptation of the microdosimetric kinetic model to hypoxia. Phys Med Biol (2016) 61:7586. doi:10.1088/0031-9155/61/21/7586
38. Strigari L, Torriani F, Manganaro L, Inaniwa T, Dalmasso F, Cirio R, et al. Tumour control in ion beam radiotherapy with different ions in the presence of hypoxia: an oxygen enhancement ratio model based on the microdosimetric kinetic model. Phys Med Biol (2018) 63:065012. doi:10.1575/1912/bco-dmo.712761.1
39. Matsuya Y, McMahon SJ, Tsutsumi K, Sasaki K, Okuyama G, Yoshii Y, et al. Investigation of dose-rate effects and cell-cycle distribution under protracted exposure to ionizing radiation for various dose-rates. Sci Rep (2018a) 8:8287–14. doi:10.1038/s41598-018-26556-5
40. DateMori T, Cosgrove V, Denis J, Gueulette J, Mazal A, Menzel H, et al. Radiobiological effectiveness of radiation beams with broad LET spectra: microdosimetric analysis using biological weighting functions. Radiat Protect Dosim (1994) 52:347–52.
41. Rossi HH, Zaider M. Elements of microdosimetry. Med Phys (1991) 18:1085–92. doi:10.1118/1.596616
43. Lindborg L, Waker A. Microdosimetry: experimental methods and applications. Boca Raton: CRC Press (2017).
44. Wilson KS, Field SB. Measurement of LET spectra using a spherical tissue-equivalent proportional counter. Phys Med Biol (1970) 15:657.
45. Lindborg L, Kyllönen JE, Beck P, Bottollier-Depois JF, Gerdung S, Grillmaier RE, et al. The use of TEPC for reference dosimetry. Radiat Protect Dosim (1999) 86 285–8. doi:10.1093/oxfordjournals.rpd.a032959
46. Schrewe H, Khvostunov IK, Cucinotta FA. The response of tissue-equivalent proportional counters to heavy ions. Radiat Res (2002) 157:435–45. doi:10.1667/0033-7587(2002)157[0435:trotep]2.0.co;2
47. Conte V, Moro D, Grosswendt B, Colautti P. Lineal energy calibration of mini tissue-equivalent gas-proportional counters (TEPC). AIP Conf Proc Am Inst Phys (2013) 1530:171–8. doi:10.3403/30106322u
48. Bradley PD, Rosenfeld AB, Zaider M. Solid state microdosimetry. Nucl Instrum Methods Phys Res B (2001) 184:135–57. doi:10.3403/30106322
49. Rosenfeld AB. Novel detectors for silicon based microdosimetry, their concepts and applications. Nucl Instrum Methods Phys Res Sect A Accel Spectrom Detect Assoc Equip (2016) 809:156–70. doi:10.1016/j.nima.2015.08.059
50. Byun SH, Spirou GM, Hanu A, Prestwich WV, Waker AJ. Simulation and first test of a microdosimetric detector based on a thick gas electron multiplier. IEEE Trans Nucl Sci (2009) 56:1108–13. doi:10.1109/tns.2008.2009214
51. Orchard G, Chin K, Prestwich W, Waker A, Byun S. Development of a thick gas electron multiplier for microdosimetry. Nucl Instrum Methods Phys Res Sect A Accel Spectrom Detect Assoc Equip (2011) 638:122–6. doi:10.1016/j.nima.2011.01.179
52. Schuhmacher H, Dangendorf V. Experimental tools for track structure investigations: new approaches for dosimetry and microdosimetry. Radiat Protect Dosim (2002) 99:317–23. doi:10.1093/oxfordjournals.rpd.a006793
53. Braby L. Experimental microdosimetry: history, applications and recent technical advances. Radiat Protect Dosim (2015) 166:3–9. doi:10.1093/rpd/ncv137
54. Magrin G. A method to convert spectra from slab microdosimeters in therapeutic ion-beams to the spectra referring to microdosimeters of different shapes and material. Phys Med Biol (2018) 63:215021. doi:10.1088/1361-6560/aae655
55. Bolst D, Guatelli S, Tran LT, Chartier L, Lerch ML, Matsufuji N, et al. Correction factors to convert microdosimetry measurements in silicon to tissue in 12C ion therapy. Phys Med Biol (2017) 62:2055. doi:10.1088/1361-6560/aa5de5
57. Kellerer AM, Rossi HH. The theory of dual radiation action. Curr Top Radiat Res (1972) 8:85–158. doi:10.1667/RRAV17.1
58. Kellerer AM, Rossi HH. A generalized formulation of dual radiation action. Radiat Res (1978) 75:471–88.
60. Tobias CA. The repair-misrepair model in radiobiology: comparison to other models. Radiat Res Suppl (1985) 8:S77–95.
61. Curtis SB. Lethal and potentially lethal lesions induced by radiation--a unified repair model. Radiat Res (1986) 106:252–70.
62. Curtis SB. Quantitative mathematical models in radiation biology. The lethal and potentially lethal model—a review and recent development. Berlin: Springer. (1988). p. 137–46.
63. Schürmann R, Vogel S, Ebel K, Bald I. The physico-chemical basis of DNA radiosensitization: implications for cancer radiation therapy. Chem A Eur J (2018) 24:10271–9. doi:10.1002/chem.201884161
64. Van Houten B, Santa-Gonzalez GA, Camargo M. DNA repair after oxidative stress: current challenges. Curr Opin Toxicol (2018) 7:9–16. doi:10.1016/j.cotox.2017.10.009
65. Lea DE, Catcheside DG. The mechanism of the induction by radiation of chromosome aberrations in Tradescantia. J Genet (1942) 12:60–9. doi:10.1007/BF02982830
66. Kuang Y, Nagy JD, Eikenberry SE. Introduction to mathematical oncology. Boca Raton: CRC Press (2016).
67. Hawkins R. A microdosimetric-kinetic model of cell death from exposure to ionizing radiation of any LET, with experimental and clinical applications. Int J Radiat Biol (1996) 69:739–55. doi:10.1080/095530096145481
68. Hawkins RB. A microdosimetric-kinetic theory of the dependence of the RBE for cell death on LET. Med Phys (1998) 25:1157–70. doi:10.1118/1.598307
69. Matsuya Y, Ohtsubo Y, Tsutsumi K, Sasaki K, Yamazaki R, Date H. Quantitative estimation of DNA damage by photon irradiation based on the microdosimetric-kinetic model. J Radiat Res (2014) 55:484–93. doi:10.1093/jrr/rrt222
70. Chen Y, Li J, Li C, Qiu R, Wu Z. A modified microdosimetric kinetic model for relative biological effectiveness calculation. Phys Med Biol (2017) 63:015008. doi:10.1118/1.4958000
71. Manganaro L. Dose delivery time structure effects in particle therapy: development of a time-resolved microdosimetric-kinetic model and implementation of spatiotemporal treatment plan optimization. [Ph.D. thesis]. Italy: University of Turin (2018).
72. Dikomey E, Franzke J. DNA repair kinetics after exposure to X-irradiation and to internal beta-rays in CHO cells. Radiat Environ Biophys (1986) 25:189–94. doi:10.1007/BF01221225
73. Fowler JF. Is repair of DNA strand break damage from ionizing radiation second-order rather than first-order? A simpler explanation of apparently multiexponential repair. Radiat Res (1999) 152:124–36.
74. Dale RG, Fowler JF, Jones B. A new incomplete-repair model based on a ‘reciprocal-time' pattern of sublethal damage repair. Acta Oncol (1999) 38:919–29. doi:10.1080/028418699432608
75. Carabe-Fernandez A, Dale RG, Paganetti H. Repair kinetic considerations in particle beam radiotherapy. Br J Radiol (2011) 84:546–55. doi:10.1259/bjr/19934996
76. Schettino G, Ghita M, Richard DJ, Prise KM. Spatiotemporal investigations of DNA damage repair using microbeams. Radiat Protect Dosim (2011) 143:340–3. doi:10.1093/rpd/ncq485
77. Mariotti LG, Pirovano G, Savage KI, Ghita M, Ottolenghi A, Prise KM, et al. Use of the γ-H2AX assay to investigate DNA repair dynamics following multiple radiation exposures. PloS One 8 (2013) e79541–12. doi:10.1371/journal.pone.0079541
78. Schettino A, Uematsu N, Chatterjee A, Story MD, Burma S, Chen DJ. Repair of HZE-particle-induced DNA double-strand breaks in normal human fibroblasts. Radiat Res (2008) 169:437–46. doi:10.1667/rr1165.1
79. Asaithamby A, Hu B, Chen DJ. Unrepaired clustered DNA lesions induce chromosome breakage in human cells. Proc Natl Acad Sci USA (2011) 108:8293–8. doi:10.1073/pnas.1016045108
80. Prise KM. A review of DSB induction data for varying quality radiations. Int J Radiat Biol (1998) 74:173–84. doi:10.1080/095530098141564
81. StenerlöwAhnström JA, Harper JV, Cucinotta FA, O'Neill P. Participation of DNA-PKcs in DSB repair after exposure to high- and low-LET radiation. Radiat Res (2010) 174:195–205. doi:10.1667/RR2071.1
82. Friedrich T, Scholz U, Elsässer T, Durante M, Scholz M. Systematic analysis of RBE and related quantities using a database of cell survival experiments with ion beam irradiation. J Radiat Res (2013) 54:494–514. doi:10.1093/jrr/rrs114
83. Dale RG, Jones B. The assessment of RBE effects using the concept of biologically effective dose. Int J Radiat Oncol Biol Phys (1999) 43:639–45.
84. Carabe-Fernandez A, Dale RG, Jones B. The incorporation of the concept of minimum RBE (RbEmin) into the linear-quadratic model and the potential for improved radiobiological analysis of high-LET treatments. Int J Radiat Biol (2007) 83:27–39. doi:10.1080/09553000601087176
85. Weyrather WK, Debus J. Particle beams for cancer therapy. Clin Oncol (2003) 15:S23. doi:10.1053/clon.2002.0185
86. Bird RP. Cysteamine as a protective agent with high-LET radiations. Radiat Res (1980) 82:290. doi:10.2307/3575380
87. Bird RP, Zaider M, Rossi HH, Hall EJ, Marino SA, Rohrig N. The sequential irradiation of mammalian cells with X rays and charged particles of high LET. Radiat Res (1983) 93:444. doi:10.2307/3576024
88. Russo G, Attili A, Battistoni G, Bertrand D, Bourhaleb F, Cappucci F, et al. A novel algorithm for the calculation of physical and biological irradiation quantities in scanned ion beam therapy: the beamlet superposition approach. Phys Med Biol (2015) 61:183. doi:10.1088/0031-9155/61/1/183
89. MarchettoCiocca EL, Lyman JT, Tobias CA. Some effects of accelerated charged particles on bacterial spores. Int J Radiat Biol Relat Stud Phys Chem Med (1968) 14:313–30. doi:10.1080/09553006814551171
90. Kase Y, Kanai T, Sakama M, Tameshige Y, Himukai T, Nose H, et al. Microdosimetric approach to NIRS-defined biological dose measurement for carbon-ion treatment beam. J Radiat Res (2011) 52:59–68.doi:10.1269/jrr.10062
91. Matsufuji C, Fleta C, Rodríguez J, Lozano M, Gómez F. Preliminary microdosimetric measurements with ultra-thin 3D silicon detectors of a 62 MeV proton beam. J Instrum (2015) 10:P01008. doi:10.1088/1748-0221/10/01/p01008
92. Bianchi A, Selva A, Colautti P, Bortot D, Mazzucconi D, Pola A, et al. Microdosimetry with a sealed mini-TEPC and a silicon telescope at a clinical proton SOBP of CATANA. Radiat Phys Chem (2020) 171:108730. doi:10.1088/1742-6596/444/1/012058
93. Kiefer J, Straaten H. A model of ion track structure based on classical collision dynamics. Phys Med Biol (1986) 31:1201.
94. Chatterjee A, Schaefer HJ. Microdosimetric structure of heavy ion tracks in tissue. Radiat Environ Biophys (1976) 13:215–27. doi:10.1007/BF01330766
95. Sakama M, Kanai T, Kase Y, Komori M, Fukumura A, Kohno T. Responses of a diamond detector to high-LET charged particles. Phys Med Biol (2005) 50:2275. doi:10.1088/0031-9155/50/10/007
96. Inaniwa T, Kanematsu N, Matsufuji N, Kanai T, Shirai T, Noda K, et al. Reformulation of a clinical-dose system for carbon-ion radiotherapy treatment planning at the National Institute of Radiological Sciences, Japan. Phys Med Biol 60 (2015a) 3271–86. doi:10.1088/0031-9155/60/8/3271
97. TsujiiTsuji S, Allison J, Amako K, Apostolakis J, Araujo H, Arce P, et al. GEANT4 - a simulation toolkit. Nucl Instrum Methods Phys Res Sect A Accel Spectrom Detect Assoc Equip (2003) 444:63. doi:10.1016/S0168-9002(03)01368-8
98. Aso T, Kimura A, Kameoka S, Murakami K, Sasaki T, Yamashita T. GEANT4 based simulation framework for particle therapy system. IEEE Nucl Sci Symp Conf Rec (2007) 33:278–9. doi:10.1109/NSSMIC.2007.4436673
99. Zhu H, Chen Y, Sung W, McNamara AL, Tran LT, Burigo LN, et al. The microdosimetric extension in TOPAS : development and comparison with published data. Phys Med Biol (2019) 64:145004. doi:10.1088/1361-6560/ab23a3
100. Magro G, Dahle TJ, Molinelli S, Ciocca M, Fossati P, Ferrari A, et al. The FLUKA Monte Carlo code coupled with the NIRS approach for clinical dose calculations in carbon ion therapy. Phys Med Biol (2017) 62:3814. doi:10.1088/1361-6560/aa642b
101. MairaniInaniwa T, Suzuki M, Furukawa T, Kase Y, Kanematsu N, Shirai T, et al. Effects of dose-delivery time structure on biological effectiveness for therapeutic carbon-ion beams evaluated with microdosimetric kinetic model. Radiat Res 180 (2013) 44–59. doi:10.1667/RR3178.1
102. Hawkins RB, Inaniwa T. A microdosimetric-kinetic model for cell killing by protracted continuous irradiation including dependence on LET i: repair in cultured mammalian cells. Radiat Res (2013) 180:584–94. doi:10.1667/RR13257.1
103. Hawkins RB, Inaniwa T. A microdosimetric-kinetic model for cell killing by protracted continuous irradiation II: brachytherapy and biologic effective dose. Radiat Res (2014) 182:72–82. doi:10.1667/rr13558.1
104. Inaniwa T, Kanematsu N, Suzuki M, Hawkins RB. Effects of beam interruption time on tumor control probability in single-fractionated carbon-ion radiotherapy for non-small cell lung cancer. Phys Med Biol (2015b) 60:4105. doi:10.1088/0031-9155/60/10/4105
105. Deehan C, O'Donoghue JA. Biological equivalence between fractionated radiotherapy treatments using the linear-quadratic model. Br J Radiol (1988) 61:1187–8. doi:10.1259/0007-1285-61-732-1187
106. Fowler JF. The linear-quadratic formula and progress in fractionated radiotherapy. Br J Radiol (1989) 62:679–94. doi:10.1259/0007-1285-62-740-679
107. Yaes RJ, Patel P, Maruyama Y. On using the linear-quadratic model in daily clinical practice. Int J Radiat Oncol Biol Phys (1991) 20:1353–62. doi:10.1016/0360-3016(91)90249-4
108. McMahon SJ. The linear quadratic model: usage, interpretation and challenges. Phys Med Biol (2018) 64:01TR01. doi:10.1088/1361-6560/aaf26a
109. Furusawa Y, Fukutsu K, Aoki M, Itsukaichi H, Eguchi-Kasai K, Ohara H, et al. Inactivation of aerobic and hypoxic cells from three different cell lines by accelerated (3)He-, (12)C- and (20)Ne-ion beams. Radiat Res (2000) 154 485–96. doi:10.1667/0033-7587(2000)154[0485:ioaahc]2.0.co;2
110. AndoYatagai C, Suzuki M, Kanai T, Fujitaka K. LET and ion species dependence for cell killing in normal human skin fibroblasts. Radiat Res (2005) 163:494. doi:10.1667/rr3360
111. Czub J, Banaś D, Błaszczyk A, Braziewicz J, Buraczewska I, Choinski J, et al. Biological effectiveness of (12)C and (20)Ne ions with very high LET. Int J Radiat Biol, 84, 821 (2008). doi:10.1080/09553000802389652
112. WojcikGorak T, Kanematsu N. Adaptation of stochastic microdosimetric kinetic model for charged-particle therapy treatment planning. Phys Med Biol (2018) 63:095011. doi:10.1088/1361-6560/aabede
113. Manganaro L, Russo G, Bourhaleb F, Fausti F, Giordanengo S, Monaco V, et al. “Survival”: a simulation toolkit introducing a modular approach for radiobiological evaluations in ion beam therapy. Phys Med Biol (2018) 63:08NT01. doi:10.1088/1361-6560/ab6eba
114. Hawkins RB. Effect of heterogeneous radio sensitivity on the survival, alpha beta ratio and biologic effective dose calculation of irradiated mammalian cell populations. Clin Transl Radiat Oncol (2017) 4:32–8. doi:10.1016/j.ctro.2017.03.001
115. Incerti S, Kyriakou I, Bernal M, Bordage M, Francis Z, Guatelli S, et al. Geant4-DNA example applications for track structure simulations in liquid water: a report from the Geant4-DNA Project. Med Phys (2018) 45:e722–e739. doi:10.1007/s10898-020-00902-2
116. Ferrari AS, Fasso PR, Ranft A. FLUKA: a multi-particle transport code (Program version 2005). Berlin: Springer. (2005). doi:10.5170/cern-2005-010
117. Russo G. Development of a radiobiological database for carbon ion Treatment Planning Systems. [Ph.D. thesis]. Italy: University of Turin (2011).
118. Guan F, Bronk L, Titt U, Lin SH, Mirkovic D, Kerr MD, et al. Spatial mapping of the biologic effectiveness of scanned particle beams: towards biologically optimized particle therapy. Sci Rep (2015) 5:9850. doi:10.1038/srep09850
119. GrosshansZhu JF, Welsh JS, Howard SP. Loss of biological effect in prolonged fraction delivery. Int J Radiat Oncol Biol Phys (2004) 59:242–9. doi:10.1016/j.ijrobp.2004.01.004
120. Carabe-Fernandez A, Dale RG, Hopewell JW, Jones B, Paganetti H. Fractionation effects in particle radiotherapy: implications for hypo-fractionation regimes. Phys Med Biol (2010) 55:5685. doi:10.1088/0031-9155/55/19/005
121. Friedland W, Jacob P, Paretzke HG, Ottolenghi A, Ballarini F, Liotta M. Simulation of light ion induced DNA damage patterns. Radiat Protect Dosim (2006) 122:116–20. doi:10.1093/rpd/ncl451
122. Hada M, Georgakilas AG. Formation of clustered DNA damage after high-LET irradiation: a review. J Radiat Res (2008) 49:203. doi:10.1016/j.dnarep.2015.01.007
123. Iwamoto Y, Sato T, Hashimoto S, Ogawa T, Furuta T, Abe S, et al. Benchmark study of the recent version of the PHITS code. J Nucl Sci Technol (2017) 54:617–35. doi:10.1269/jrr.40.s60
124. Sato T, Iwamoto Y, Hashimoto S, Ogawa T, Furuta T, Abe S, et al. Features of particle and heavy ion transport code system (PHITS) version 3.02. J Nucl Sci Technol (2018) 55:684–90. doi:10.1007/s00411-006-0070-3
125. Olko P, Booz J. Energy deposition by protons and alpha particles in spherical sites of nanometer to micrometer diameter. Radiat Environ Biophys (1990) 29:1. doi:10.1007/BF01211231
126. Abolfath R, Peeler CR, Newpower M, Bronk L, Grosshans D, Mohan R. A model for relative biological effectiveness of therapeutic proton beams based on a global fit of cell survival data. Sci Rep (2017) 7:8340–12. doi:10.1038/s41598-017-08622-6
127. Hawkins RB. Survival of a mixture of cells of variable linear-quadratic sensitivity to radiation. Radiat Res (2000) 153:840–3. doi:10.1667/0033-7587(2000)153[084010.1667/0033-7587(2000)153[0840:soamoc]2.0.co;2
128. Matsuya Y, Sasaki K, Yoshii Y, Okuyama G, Date H. Integrated modelling of cell responses after irradiation for DNA-targeted effects and non-targeted effects. Sci Rep (2018b) 8:1–14. doi:10.1038/s41598-018-23202-y
129. Höckel M, Knoop C, Schlenger K, Vorndran B, Baussmann E, Mitze M, et al. Intratumoral pO2 predicts survival in advanced cancer of the uterine cervix. Radiother Oncol 26 (1993) 45–50. doi:10.1016/0167-8140(93)90025-4
130. VaupelKnapstein RH, Gray LH. The histological structure of some human lung cancers and the possible implications for radiotherapy. Br J Canc (1955) 9:539–49. doi:10.1038/bjc.1955.55
131. Ito A, Nakano H, Kusano Y, Hirayama R, Furusawa Y, Murayama C, et al. Contribution of indirect action to radiation-induced mammalian cell inactivation: dependence on photon energy and heavy-ion LET. Radiat Res (2006) 165, 703. doi:10.1667/rr3557.1
132. ShinoharaMori T, Suzuki Y, Ohno T, Kato S, Suzuki M, Morita S, et al. Carbon beam therapy overcomes the radiation resistance of uterine cervical cancer originating from hypoxia. Clin Canc Res (2006) 12:2185–90. doi:10.1158/1078-0432.CCR-05-1907
133. TsujiiSato T, Howard-Flanders P. Role of oxygen in modifying the radiosensitivity of E. coli B. Nature (1956) 178:978–9. doi:10.1038/178978a0
134. Wenzl T, Wilkens JJ. Modelling of the oxygen enhancement ratio for ion beam radiation therapy. Phys Med Biol (2011) 56:3251–68. doi:10.1088/0031-9155/56/11/006
135 Scifoni E, Tinganelli W, Weyrather WK, Durante M, Maier a, Krämer M. Including oxygen enhancement ratio in ion beam treatment planning: model implementation and experimental verification. Phys Med Biol (2013) 58:3871–95. doi:10.1088/0031-9155/58/11/3871
136. Antonovic L, Brahme A, Furusawa Y, Toma-Dasu I. Radiobiological description of the LET dependence of the cell survival of oxic and anoxic cells irradiated by carbon ions. J Radiat Res (2013) 54:18–26. doi:10.1093/jrr/rrs070
137. Mothersill C, Seymour C. Radiation-induced bystander effects: past history and future directions. Radiat Res (2001) 155:759. doi:10.1667/0033-7587(2001)155
138. Hamada N, Matsumoto H, Hara T, Kobayashi Y. Intercellular and intracellular signaling pathways mediating ionizing radiation-induced bystander effects. J Radiat Res (2007) 48:87. doi:10.1269/jrr.06084
139. Hamada N, Maeda M, Otsuka K, Tomita M. Signaling pathways underpinning the manifestations of ionizing radiation-induced bystander effects. Curr Mol Pharmacol (2012) 27:66. doi:10.2174/1874467211104020079
140. Hu B, Wu L, Han W, Zhang L, Chen S, Xu A, et al. The time and spatial effects of bystander response in mammalian cells induced by low dose radiation. Carcinogenesis (2006) 27:245. doi:10.1093/carcin/bgi224
141. YuHei SJ, Butterworth KT, Trainor C, McGarry CK, O'Sullivan JM, Schettino G, et al. A kinetic-based model of radiation-induced intercellular signalling. PloS One (2013) 8:e54526. doi:10.1371/journal.pone.0054526
142. PriseHounsell P, Friedland W. Mechanistic modelling of radiation-induced bystander effects. Radiat Protect Dosim (2015) 166:148–51. doi:10.1093/rpd/ncv170
143. Mcmahon SJ, Schuemann J, Paganetti H, Prise KM. Mechanistic modelling of DNA repair and cellular survival following radiation-induced DNA damage. Sci Rep (2016) 6:33290. doi:10.1038/srep33290
144. Robertson JB, Eaddy JM, Archambeau JO, Coutrakon GB, Miller DW, Moyers MF, et al. Relative biological effectiveness and microdosimetry of a mixed energy field of protons up to 200 MeV. Adv Space Res 14 (1994) 271–5. doi:10.1016/0273-1177(94)90477-4
145. DicelloSiebers G, Cortese J, Ghebremedhin A, Hubbard J, Johanning J, Koss P, et al. Microdosimetry spectra of the Loma Linda proton beam and relative biological effectiveness comparisons. Med Phys (1997) 24:1499–506. doi:10.1118/1.598038
146. ZuccarelliMaudsley PJ, Colvett RD, Lam YM, Rossi HH. The relative biological effectiveness of 160 MeV protons. I. Microdosimetry. Int J Radiat Oncol Biol Phys (1978) 4:1001–8.
147. Hall EJ, Kellerer AM, Rossi HH, Lam YM. The relative biological effectiveness of 160 MeV protons--II. Biological data and their interpretation in terms of microdosimetry. Int J Radiat Oncol Biol Phys (1978) 4:1009–13.
148. Morstin K, Bond VP, Baum JW. Probabilistic approach to obtain hit-size effectiveness functions which relate microdosimetry and radiobiology. Radiat Res (1989) 120:383–402.
149. Paganetti H, Olko P, Kobus H, Becker R, Schmitz T, Waligorski MP, et al. Calculation of relative biological effectiveness for proton beams using biological weighting functions. Int J Radiat Oncol Biol Phys (1997) 37:719–29.
150. Müller-GärtnerFilges P. Fluctuations of energy deposited in biological targets by ionising radiation. [Ph.D. thesis]. Jülich: Institute of Medicine KFA (1989).
151. Semenenko VA, Stewart RD. A fast Monte Carlo algorithm to simulate the spectrum of DNA damages formed by ionizing radiation. Radiat Res (2004) 161:451–7. doi:10.1667/rr3140
152. Wang CC, Hsiao Y, Lee CC, Chao TC, Wang CC, Tung CJ. Monte Carlo simulations of therapeutic proton beams for relative biological effectiveness of double-strand break. Int J Radiat Biol (2012) 88:158–63. doi:10.3109/09553002.2011.611214
153. Stewart RD, Yu VK, Georgakilas AG, Koumenis C, Park JH, Carlson DJ. Effects of radiation quality and oxygen on clustered DNA lesions and cell death. Radiat Res (2011) 176:587–602. doi:10.1667/rr2663.1
154. Kamp F, Cabal G, Mairani A, Parodi K, Wilkens JJ, Carlson DJ. Fast biological modeling for voxel-based heavy ion treatment planning using the mechanistic repair–misrepair–fixation model and nuclear fragment spectra. Int J Radiat Oncol Biol Phys (2015) 93:557–68. doi:10.1016/j.ijrobp.2015.07.2264
Keywords: microdosimetry, microdosimetric kinetic model, relative biological effectiveness, oxygen enhancement ratio, biophysical modeling, ion beam therapy
Citation: Bellinzona VE, Cordoni F, Missiaggia M, Tommasino F, Scifoni E, La Tessa C and Attili A (2021) Linking Microdosimetric Measurements to Biological Effectiveness in Ion Beam Therapy: A Review of Theoretical Aspects of MKM and Other Models. Front. Phys. 8:578492. doi: 10.3389/fphy.2020.578492
Received: 30 June 2020; Accepted: 30 November 2020;
Published: 10 February 2021.
Edited by:
Yolanda Prezado, INSERM U1021 Signalisation normale et pathologique de l'embryon aux thérapies innovantes des cancers, FranceReviewed by:
Dimitris Emfietzoglou, University of Ioannina, GreeceAnatoly Rosenfeld, University of Wollongong, Australia
Lucas Norberto Burigo, German Cancer Research Center (DKFZ), Germany
Copyright © 2021 Bellinzona, Cordoni, Missiaggia, Tommasino, Scifoni, La Tessa and Attili. This is an open-access article distributed under the terms of the Creative Commons Attribution License (CC BY) The use, distribution or reproduction in other forums is permitted, provided the original author(s) and the copyright owner(s) are credited and that the original publication in this journal is cited, in accordance with accepted academic practice. No use, distribution or reproduction is permitted which does not comply with these terms.
*Correspondence: A. Attili, YW5kcmVhLmF0dGlsaUByb21hMy5pbmZuLml0
 V. E. Bellinzona
 F. Cordoni
 M. Missiaggia
 F. Tommasino
 E. Scifoni
 C. La Tessa
 A. Attili