 Elisa Fiorina1,2
 Veronica Ferrero1*
 Guido Baroni2,3
 Giuseppe Battistoni4
 Nicola Belcari5,6Niccolo Camarlinghi5,6
 Piergiorgio Cerello1Mario Ciocca2Micol De Simoni7,8
 Marco Donetti2
 Yunsheng Dong4,9Alessia Embriaco10Marta Fischetti8,11Gaia Franciosini7,8Giuseppe Giraudo1
 Aafke Kraan5Francesco Laruina5,6Carmela Luongo5,12Davide Maestri2Marco Magi11Giuseppe Magro2Etesam Malekzadeh13Carlo Mancini Terracciano7,8
 Michela Marafini8,14
 Ilaria Mattei4Enrico Mazzoni5Paolo Mereu1
 Riccardo Mirabelli7,8,14Alfredo Mirandola2Matteo Morrocchi5,6
 Silvia Muraro4
 Alessandra Patera1
 Vincenzo Patera8,11,14
 Francesco Pennazio1
 Alessandra Retico5,6
 Angelo Rivetti1Manuel Dionisio Da Rocha Rolo1Valeria Rosso5,6
 Alessio Sarti8,11,14
 Angelo Schiavi8,11Adalberto Sciubba11,14,15
 Elena Solfaroli Camillocci7,8,16Giancarlo Sportelli5,6Sara Tampellini2Marco Toppi11,15
 Giacomo Traini8,14Serena Marta Valle4Francesca Valvo2
 Barbara Vischioni2Viviana Vitolo2Richard Wheadon1
 Maria Giuseppina Bisogni5,6
- 1Istituto Nazionale di Fisica Nucleare, Sezione di Torino, Torino, Italy
- 2Centro Nazionale di Adroterapia Oncologica, Pavia, Italy
- 3Politecnico di Milano, Milano, Italy
- 4Istituto Nazionale di Fisica Nucleare, Sezione di Milano, Milano, Italy
- 5Istituto Nazionale di Fisica Nucleare, Sezione di Pisa, Pisa, Italy
- 6Dipartimento di Fisica, Universitá di Pisa, Pisa, Italy
- 7Dipartimento di Fisica, Sapienza Universitá di Roma, Roma, Italy
- 8Istituto Nazionale di Fisica Nucleare, Sezione di Roma, Roma, Italy
- 9Dipartimento di Fisica, Universitá di Milano, Milano, Italy
- 10Istituto Nazionale di Fisica Nucleare, Sezione di Pavia, Pavia, Italy
- 11Dipartimento di Scienze di Base e Applicate per l’Ingegneria, Sapienza Universitá di Roma, Roma, Italy
- 12Dipartimento di Chimica, Universitá di Pisa, Pisa, Italy
- 13Medical Physics Department, Tarbiat Modares University, Tehran, Iran
- 14Museo Storico della Fisica e Centro Studi e Ricerche “E. Fermi”, Roma, Italy
- 15Istituto Nazionale di Fisica Nucleare, Sezione dei Laboratori di Frascati, Roma, Italy
- 16Scuola di Specializzazione in Fisica Medica, Sapienza Università di Roma, Roma, Italy
In particle therapy, the uncertainty of the delivered particle range during the patient irradiation limits the optimization of the treatment planning. Therefore, an in vivo treatment verification device is required, not only to improve the plan robustness, but also to detect significant interfractional morphological changes during the treatment itself. In this article, an effective and robust analysis to detect regions with a significant range discrepancy is proposed. This study relies on an in vivo treatment verification by means of in-beam Positron Emission Tomography (PET) and was carried out with the INSIDE system installed at the National Center of Oncological Hadrontherapy (CNAO) in Pavia, which is under clinical testing since July 2019. Patients affected by head-and-neck tumors treated with protons have been considered. First, in order to tune the analysis parameters, a Monte Carlo (MC) simulation was carried out to reproduce a patient who required a replanning because of significant morphological changes found during the treatment. Then, the developed approach was validated on the experimental measurements of three patients recruited for the INSIDE clinical trial (ClinicalTrials.gov ID: NCT03662373), showing the capability to estimate the treatment compliance with the prescription both when no morphological changes occurred and when a morphological change did occur, thus proving to be a promising tool for clinicians to detect variations in the patients treatments.
1 Introduction
In vivo treatment verification is currently an open issue in particle therapy, driven by the clinical need to increase the treatment planning optimization [1], through the reduction of range uncertainties that might give dose distributions significantly different from the clinical prescription, thus requiring a plan adaptation.
On the one hand, the proton energy deposition distribution allows releasing the prescribed dose to the tumor volume with a lower dose to the healthy tissues in comparison with the most advanced techniques of conventional radiotherapy [2]. On the other hand, particle therapy is more sensitive than photon radiotherapy to differences in the particle range inside the patient body [3]. During treatment planning, the range uncertainty is taken into account in order to design the most robust irradiation plan. In clinics, the safety margin included in the treatment planning and calculated on the basis of the range uncertainty contributions is of about
In addition, in some cases, the patient morphology changes during the treatment period and, even though this is recognized as a cause of suboptimal irradiation [5], these modifications are not so easy to model and quantify. They strongly depend on the type of tumor (e.g., early therapy response and fast growth of the tumor mass) and irradiation district (moving organs, presence of cavities, toxicity, and site inflammation). In [6], for example, a retrospective analysis was performed over 730 patients treated with proton therapy and affected by cranial and extracranial tumor. Patients underwent periodic CTs to estimate morphological or anatomic variations and in 5.5% of cases an adaptive replanning was required. Hence, in particle therapy, morphological and anatomic changes must be monitored to smoothly tailor the treatment plan to the Clinical Target Volume (CTV [7]) without any undesired increase of the dose in the surrounding healthy tissues. In literature, this issue is thoroughly explored for lung treatments because the problem is enhanced in case of moving organs and requires an intrafractional optimization [8].
In order to address this crucial treatment optimization, a system able to verify the compliance of the ongoing treatment with the prescribed therapy during the irradiation itself is fundamental.
Positron Emission Tomography (PET) is the most mature in vivo range monitoring technique used in clinics [9–13]. It relies on the production of positron emitters inside the patient due to the nuclear interactions between the primary particles and the tissues. In particular, about 1% of the primary protons undergo nuclear interaction in each cm of range in water [14], inducing a slight activation of the patient tissues that is spatially correlated with the Bragg Peak position of the primary beam [15]. Due to tissue composition, the produced positron emitters are mostly carbon and oxygen isotopes. In particular, 11C, 10C, and 15O, whose half-lives are about 20 min, 19 s, and 2 min, respectively, are the most abundant ones. The former is fundamental to PET scanners acquiring data only after the treatment (i.e., in-room and off-room systems), whereas the others become more important for PET scanners acquiring data during the treatment (in-beam PET). The latter technique, in particular, allows for treatment verification during the irradiation, without slowing down the clinical workflow. In clinics, PET monitoring has already been tested for treatment verification and this approach proved to be able to identify differences in the patient morphology which are significant from the clinical point of view [16, 17]. However, an established and clinically validated analysis, presently still missing, has to be implemented to evaluate whether the detected range differences are actually related to interfractional morphological changes and not to statistical fluctuations.
The INSIDE collaboration built an innovative bimodal device able to perform in vivo verification of both proton and carbon ion treatments during the irradiation [18, 19]. It relies on a planar PET system with two heads [20] and a tracker for secondary charged particles, named Dose Profiler, that exploits the secondary protons emitted during ion treatments (e.g., carbon ion treatments) [21, 22]. The in-beam PET was first tested in vivo in 2016, proving its capability to provide an evaluation of the treatment compliance between two consecutive fractions by acquiring data only during the treatment and thus obtain reliable PET images before the end of the fraction irradiation [18]. This is a key factor to minimize the signal loss due to isotope decay and also to minimize the biological washout. In July 2019, a clinical trial with the INSIDE system (ClinicalTrials.gov ID:NCT03662373) started at the National Center of Oncological Hadrontherapy (CNAO) in Pavia, Italy [23]. Specific head-and-neck and brain pathologies are included in the trial: those in which no morphological changes are expected and, therefore, can be exploited to assess the reproducibility of a range analysis and those in which morphological changes may occur and, therefore, could be helpful to test the sensitivity of the system in terms of variation detection.
In this work, a robust and reliable procedure for detecting interfractional morphological changes by means of in-beam PET detection is proposed. The final aim is to give the physicians a reliable tool representative of the particle range differences detected during in vivo monitoring, useful to evaluate the compliance of the delivered treatment with respect to the prescribed therapy and possibly define a patient-tailored control CTs scheduling.
2 Materials and Methods
2.1 Patient Data
In this study, we consider four patients treated with proton therapy at the CNAO facility to test the effectiveness and reliability of the proposed analysis in presence of different degrees of morphological changes during the treatment. First, the analysis was tuned by considering the Monte Carlo (MC) simulation of a patient with a head-and-neck tumor, who required a treatment replanning due to a nasal cavity emptying. This patient (here named MCP) was not part of the INSIDE trial but was chosen because of the severe morphological changes detected during the treatment with the control CT. The analysis was then validated on the experimental measurements of three patients monitored in the framework of the INSIDE clinical trial, which involves a longitudinal monitoring, i.e., a monitoring of the patient treatment sessions, acquiring data on average twice a week. In two of the patients (trial ID: 002P, 003P) no morphological changes occurred, whereas a moderate degree of variation was detected in the third one (trial ID: 006P).
2.1.1 Monte Carlo Simulation Case Study: Replanned Patient
The Monte Carlo simulated patient (MCP) was chosen because of a replanning due to a severe morphological variation in the CTV during the treatment, revealed with a control CT. The patient was a 70-year-old male, affected by Squamous Cell Carcinoma (SCC) of the left sinonasal cavity. The CTV was irradiated with Intensity Modulated Proton Therapy (IMPT) in 33 fractions with 2.0GyE/fraction, five fractions/week, to deliver 66GyE on the high risk CTV and 60GyE on the low risk CTV. Each daily treatment comprised three orthogonal treatment fields, corresponding to the patient position angles 0, 180, and 270° IEC (International Electrotechnical Commission). The treatment characteristics are summarized in Table 1.
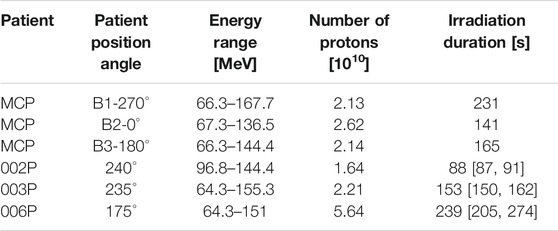
TABLE 1. Treatment field parameters and irradiation duration times for each of the considered cases.
Because of possible morphological changes due to the inclusion of the sinonasal cavities into the CTV and the close proximity of the right maxillary and frontal sinuses to the target, a control CT was performed after 22 fractions from the beginning of the treatment. Figure 1 shows the planning and control CTs, with the CTV margins overlaid, where it can be seen that a nasal cavity was almost completely emptied during the treatment course. By calculating with the Treatment Planning System (TPS) the effective dose distribution on the control CT, an overdosage in the surrounding healthy tissues and into the CTV was found; hence, the treatment was replanned.
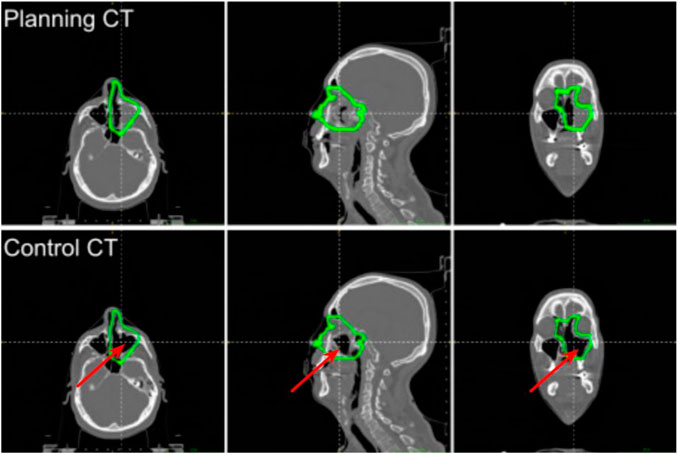
FIGURE 1. Slices of the planning and control CTs of the MCP patient at the isocenter (from left to right: axial, sagittal, and coronal). The isocenter is at the crossing point of the dashed lines. The CTV margins are drawn in green. The emptied region is pointed out with the red arrow.
2.1.2 Experimental Data: Patients Included in the INSIDE Clinical Trial
Three patients recruited in the INSIDE clinical trial (ID: 002P, 003P, 006P) were selected to test the reliability of the proposed analysis. The 002P patient was 80 years old, male, affected by an inoperable skull base meningioma. His IMPT irradiation comprised the delivery of 54GyE total dose divided in 30 fractions (1.8GyE/fraction). The treatment plan included two fields corresponding to the patient position angles of 240 and 165° IEC, but only the first field was monitored due to mechanical incompatibility of the INSIDE setup with the patient bed movements. The 003P patient was 25 years old, male, affected by recurrent meningioma of the right orbit region after previous surgery and Cyberknife. The CTV was irradiated with IMPT so as to deliver a total dose of 54GyE in 27 fractions. The treatment relied on two fields corresponding to the patient position angles of 235 and 180° IEC. Even if both treatment fields were acquired, only the first field was considered for this study. For these two patients, no control CTs were scheduled because patients affected by meningioma are not prone to morphological modifications related to the treatment or the tumor growing/shrinking.
The 006P patient was 39 years old, female, affected by Adenoid Cystic Carcinoma (ACC) of minor salivary glands arising by the rhinopharynx and involving the skull base, the right nasal cavity, and the homolateral maxillary sinus. The CTV was irradiated with IMPT in 35 fractions with conventional fractionation 2.0GyE/fraction, five fractions/week, to deliver 70GyE. Each daily treatment comprised two opposite beams, corresponding to 15 and 175° IEC angles. Due to mechanical incompatibility of the INSIDE system with the patient couch movements, only the field corresponding to 175° IEC was monitored. A control CT was scheduled after 20 fractions in order to check the correct dose coverage of the target and the prescribed sparing of organs at risk. The planning and control CTs of patient 006P are shown in Figure 2: a partial emptying of the cavities due to an early response of the tumor can be appreciated. The modification in the dose distribution due to the changed morphology produced an increase of the dose to the right chambers and the right lens. However, the dose distribution in these regions of interest still complied with the clinical prescription. Thanks to the robust field geometry with respect to interfractional morphological changes, the patient was allowed to continue the therapy with the same treatment plan without any additional treatment optimization.
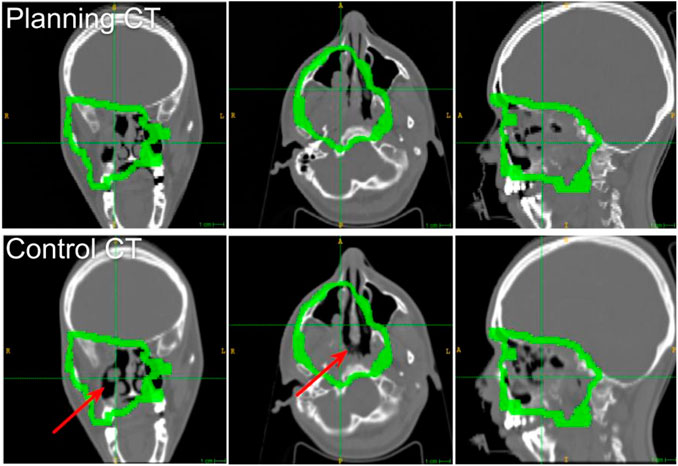
FIGURE 2. Slices of the planning and control CTs of the 006P patient at the isocenter (from left to right: axial, sagittal, and coronal). The isocenter is at the crossing point of the dashed lines. The CTV margins are drawn in green. The emptied region is pointed out with the red arrow.
The information about the considered treatment fields for all the in vivo monitored patients is summarized in Table 1. For the clinical measurements, the irradiation duration corresponds to the average treatment time of all the acquired fractions; additionally, the maximum and minimum irradiation times are also reported.
2.2 The INSIDE In-Beam PET
The INSIDE in-beam PET features two planar heads (10 × 25 cm2 active area) made of 2 × 5 array of detection modules based on Lutetium Fine Silicate (LFS) scintillating crystals (3.2 cm pixel pitch). The 511 keV coincidence photons are selected within a coincidence window of 2 ns; the detector energy and timing resolution are 13% dE/E and 450psσ, respectively.
Both simulated and experimental PET images are reconstructed by means of a Maximum Likelihood Expectation Maximization (MLEM) algorithm [24], featuring 140 × 70 × 165 voxels with a pixel size of 1.6 mm that is half of the pitch of the PET module (Field Of View (FOV) = 22.4 × 11.2 × 26.4 cm3).
2.3 Monte Carlo Simulation
The MC simulation is very useful to compare an experimental PET image with the expectation because the induced activity distribution is not straightforwardly correlated to the dose and depends on the acquisition time [25–28]. An extensive review of the use of MC simulation in particle range monitoring is discussed in [29] and [30].
The MC simulation was developed in FLUKA, including all the characteristics and calibration of the INSIDE in-beam PET detector and all the features of the CNAO beam line and pencil beam scanning temporal structure [31, 32]. The MC simulation was previously validated on phantoms with both monoenergetic beams [33] and treatment plans, for either protons [34, 35] or carbon ions [36]. Furthermore, it was validated with the clinical measurement of the first patient ever monitored with the INSIDE in-beam PET scanner, where its agreement with the experimental measurements was found to have an uncertainty compatible with the agreement found when comparing two consecutive days measurements [37].
The beam delivery was simulated taking into account the average clinical intensity on the CNAO synchrotron (
Using both the planning and control CTs, the MCP patient morphology has been modeled in FLUKA with the stoichiometric approach [38] adapted to the CNAO CT calibration curve [39]. The original treatment plan (i.e., calculated on the planning CT) was then irradiated using both CTs, exploiting the developed biased approach described in [37], so as to optimize the simulation run time while preserving the signal statistical significance.
2.4 PET Image Analysis and Compliance Map Definition
This study aims at developing a reliable analysis method for verifying the compliance of the ongoing and prescribed proton treatment and, eventually, at detecting interfractional morphological changes. Moreover, a graphical representation of the numerical results that can be easily overlaid with the patient CT and shared with the clinicians through the TPS is proposed. Such a graphical representation is designed to point out regions in which the treatment compliance with the prescription is poorly detected and it could boost the use of the in-beam PET feedback to adapt the patient schedule of control CT exams depending on the treatment progression.
To implement and test the proposed analysis, in-beam PET images comprising the data acquired during the treatment in the interspill pauses plus 10s of after treatment have been considered. This short acquisition time after the end of the irradiation does not slow down the clinical workflow, avoiding to add discomfort to the patient. At the same time, it also provides additional data that can be useful to increase the statistics of the last irradiated slices, which in the case of the CNAO synchrotron are the highest energies and therefore possibly the most significant in the detection of eventual range differences located at the distal part of the irradiated volume.
The proposed analysis comprises four steps: the image preprocessing, the extraction of a set of isoactivity surfaces, the calculation of the average activity range difference in the beam direction, and the construction of the final 3D compliance map. For the simulated patient, the analysis is carried out by comparing the two PET images obtained with the modelization of the patient anatomy with the planning and control CTs. For the clinical trial patients, where experimental data is available, the analysis is carried out by comparing the image corresponding to the first measured fraction with the subsequent acquisitions.
First, since the raw in-beam PET images suffer from hot spots due to poor statistics with respect to standard diagnostic PET images, the image contrast was modified by masking the highest and lowest intensity values. Additionally, a median filter with a radius of 5 mm was applied to reduce the salt-and-pepper noise in the images.
After that, a set of isoactivity surfaces was extracted with a multithreshold approach. We considered N = 13 activity threshold values t between 8 and 2% with respect to the maximum image intensity with a step of 0.5%, obtaining then 13 isoactivity surfaces At(x,y,z) for each PET image, where x and y are the coordinates in the transverse plane and z is the coordinate in the beam direction. The activity threshold values used in the isoactivity surface extraction have been chosen in order to take into account at most the contribution given by the last irradiated energies that poorly contribute to the final PET image but that are strongly important in the detection of possible range deviations. A previous study reports the use of erosion and dilation filters to obtain the isoactivity surfaces [18]. This additional filtering can be avoided in this work, because the PET images, here considered at the end of the treatment, are less noisy than the images reported in [18], where the activity distribution was analyzed as a function of the treatment time.
From the isoactivity surfaces At(x,y,z), we calculated the activity range distribution Rt(x,y) by considering only the activity depth differences along the beam direction z (Beam Eye’s View - BEV). The activity range distribution Rt(x,y) was defined as the maximum depth z belonging to the isoactivity surface At(x,y,z) for each point (x,y) in the transverse plane (i.e., the most distal z above the given threshold for each point in the transverse area covered by the impinging pencil beams):
A representation of the Rt(x,y) calculation is shown in Figure 3, taking into account the activity profile along the z axis.
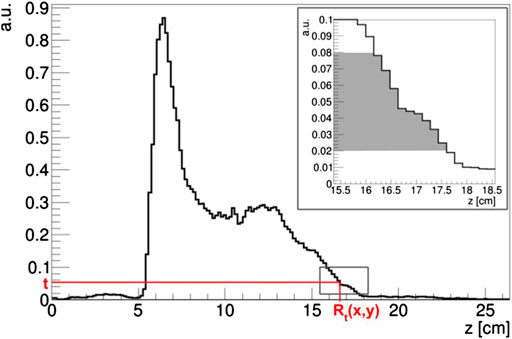
FIGURE 3. Example of Rt(x,y) calculation on an activity profile normalized at the maximum intensity in the PET image. In the box, the range of the t threshold used in the proposed analysis is highlighted in gray.
The set of threshold-dependent activity range distributions Rt(x,y) in the transverse plane was used to compare two PET images i and j. For each couple of images, the corresponding activity range distributions for a given threshold t were
In principle, thanks to the multithreshold approach, this analysis, which is based on the evaluation of the average activity range difference
To give useful feedback to clinicians, the average activity range difference
For each given voxel
The compliance map
To better point out to the clinicians the regions in which the detected activity range difference is more critical and could therefore produce significant deformation into the delivered dose map, a dedicated Color Look-Up Table (CLUT) for the compliance map
3 Results
The simulated activity images referring to the MCP patient are shown in Figure 4 for the three irradiation fields. For both planning and control CT, the coronal slice is shown at the isocenter. In this patient, the almost complete emptying of the left nasal cavity, which is included into the CTV, produced in the PET images a significant and clearly visible elongation of the activity region in the beam direction. This effect is shown in all treatment fields even if they quantitatively contribute with different weights to the total dose deposition in the morphologically changing volume.
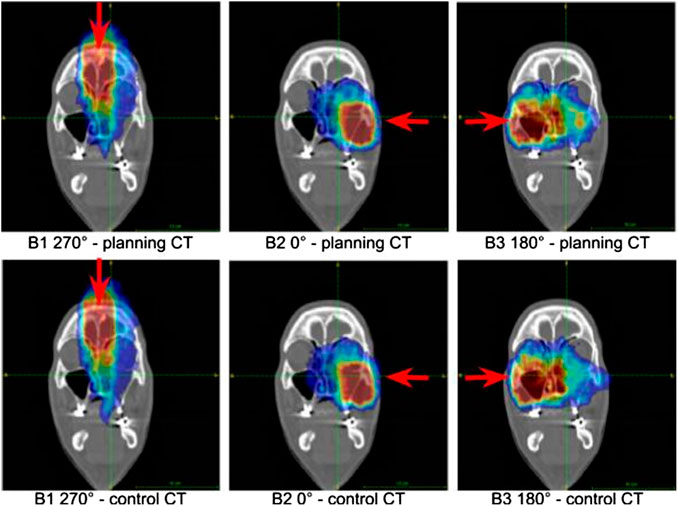
FIGURE 4. Coronal sections of the activity images of the simulated patient at the isocenter. Upper row: images obtained by considering the planning CT in the MC simulation. Bottom row: images referring to the MC simulation in which the control CT was taken into account. The beam fields (B1, B2, B3) of the treatment are reported. The beam direction is identified by the red arrow.
As for the MCP patient, a slight elongation of the activity distribution can be appreciated in correspondence to the partial emptying of the cavity of patient 006P, even though a replanning was not required in this case. The activity distributions referring to different acquired fractions are reported in Figure 5.
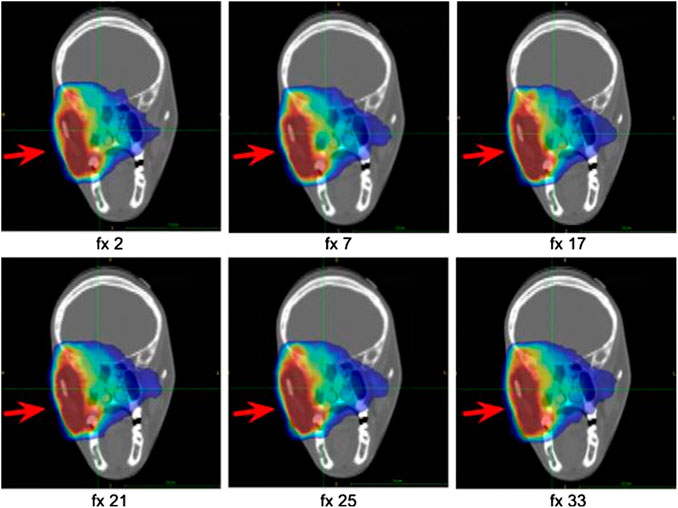
FIGURE 5. Coronal sections at the isocenter of the activity images of patient 006P corresponding to six different fractions along the treatment course. The activity distribution is shown superimposed to the planning CT. The beam direction is identified by the red arrow.
From a quantitative point of view, it is necessary to study the distributions of the average activity range difference
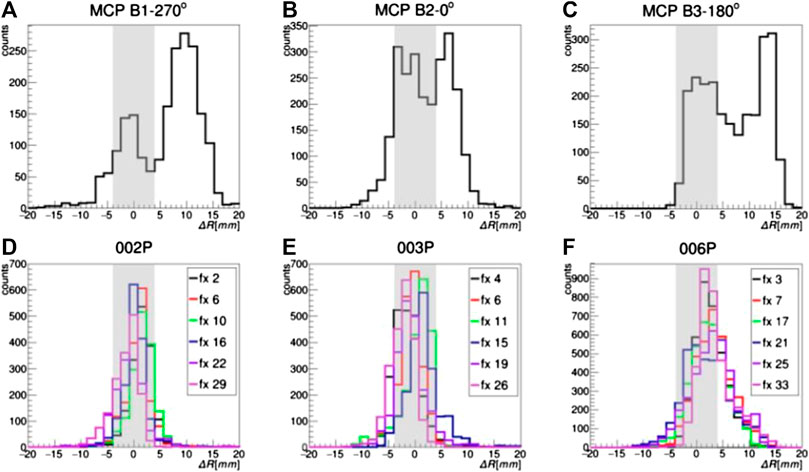
FIGURE 6. Distributions of
In the case of 002P and 003P, where no morphological changes are expected because of the pathology and the treatment region, the
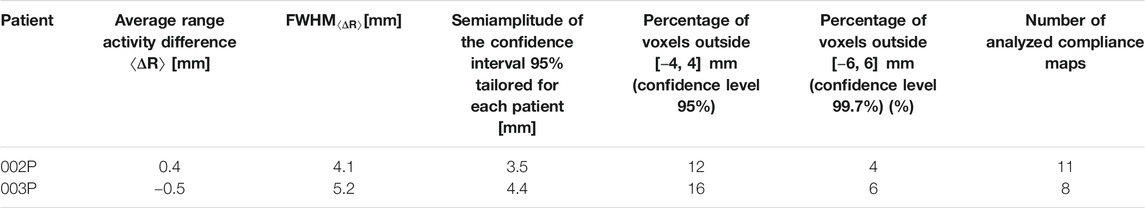
TABLE 2. Results of patients 002P and 003P and definition of the compliance interval at 95% confidence level, used for the design of the CLUT for the compliance map. The percentages of outlier voxels when considering a level of confidence of 95 (±4 mm) or 99.7% (±6 mm) and the total number of produced compliance maps, corresponding to the analyzed fractions, are also reported.
In the case of the P006 patient, in which a partial morphological variation was detected in the control CT, the
In Figure 6, the
The coronal sections of the compliance map referring to the simulated patient are reported in Figure 7. They clearly show that the pencil beams of each irradiation field that have to pass through the morphologically changed nasal cavity report a significant positive range difference (i.e., the particle beam penetrates more in the patient tissues).
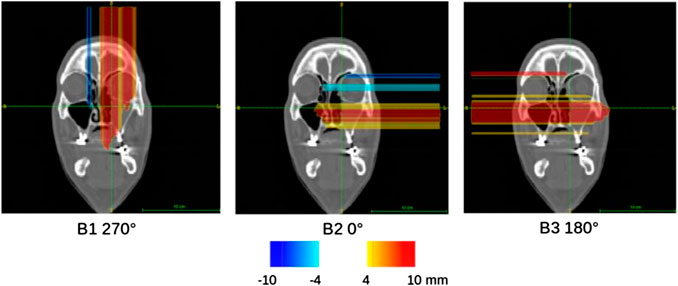
FIGURE 7. Compliance maps referring to the activity image analysis for each beam field (B1, B2, B3) of the MCP patient, overlaid on the planning CT with the proposed CLUT.
Some of the compliance maps
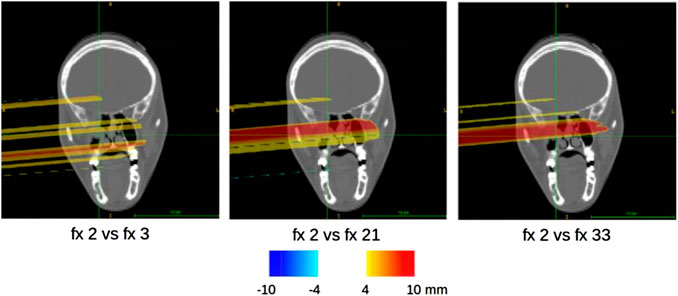
FIGURE 8. Sample of compliance maps referring to the activity image analysis of different fractions (fx) of the 006P patient, overlaid on the planning CT with the proposed CLUT.
4 Discussion
In particle therapy, several quantitative methods for PET image analysis and range difference evaluations have been developed (e.g., [40–43]). Those methods mainly rely on PET monitoring systems that acquire data after the end of the treatment. On the one hand, the reduced acquisition time of the in-beam PET technique allows to do treatment verification in a straightforward way that does not slow down the clinical workflow. On the other hand, the poor statistics of in-beam PET acquisitions has to be dealt with. This can be addressed developing a robust analysis for the identification of critical regions with respect to particle range deviations. Moreover, there is no general consensus on the best way to quantify the compliance of the ongoing treatment to the prescribed one. This study aimed at developing and validating an analysis that takes into account as preferential direction the beam axis (BEV) to obtain a reliable evaluation of possible detected particle range variations. A similar BEV approach has been applied both to prompt photons [44] and to PET [40]. Moreover, a 3D compliance map has been proposed to be used in vivo to give a feedback to the clinicians in order to tailor, for each patient, the schedule of eventual control CTs. In the compliance map, the average activity range difference calculated for each pencil beam is reported. It is important to remark that this quantity is not a direct measurement of the Bragg Peak shift in the beam direction. There is in fact a correlation between these two quantities, but the average activity range difference depends on other variables, such as acquisition duration, image elongation artifacts, and detector features, that have to be considered during the visual analysis on the patient CT. The proposed analysis was tested with simulated and real patients monitored with the INSIDE in-beam PET system, which is under clinical validation at the CNAO treatment center. Only interspill data were considered in the analysis because, even if the INSIDE system is able to acquire useful data during the spills, they have not yet been used for online range monitoring. In fact, inspill data are noisy and require filtering procedures to reduce the unwanted contribution of the prompt signals not correlated with the beam position. Some strategies to consider also inspill data acquired by the first two modules of the INSIDE in-beam PET were discussed in [45] and [46].
From the analysis of two measured patients in which no morphological changes were expected, it was possible to define a compliance interval within which a detected range difference is considered as a statistical fluctuation with a 95% confidence level. In other words, a range difference falling in the compliance interval has to be considered not critical with respect to a possible need for a patient morphology verification exam. We found a compliance interval of −4 mm; 4 mm. Based on these results, we have built a dedicated CLUT to show the compliance map overlaid with the patient CT. Only two patients were used to define the confidence interval used in the CLUT, because they were affected by pathologies showing no morphological changes. Nevertheless, the interval was calculated considering the whole volume, irradiated over the course of the monitored treatment fractions, yielding the comparison of 23 PET images.
For the simulated and monitored patients, in which morphological changes were certified by control CTs, the developed analysis identified some critical regions with respect to the particle range variation which were compatible with the morphological variations happened during the patients treatment. However, these patients did not have to be replanned. This means that the proposed analysis seems to be able to detect morphological changes before they become severe enough to require a plan adaptation to the new clinical scenario. Only patients treated with proton therapy were considered at this stage. However, patients treated with carbon ions were also included in the INSIDE trial. For these patients, the PET performances are lower due to the lower statistics. Moreover, the short acquisition time impacts the detected isotopes signal (i.e., in carbon ion therapy, mainly 11C is produced, but, having a half-life way longer than the treatment time, this signal is partially lost). Nevertheless, research strategies to analyze carbon ion PET data are being investigated in the framework of the INSIDE clinical trial.
5 Conclusion
A reliable approach for in vivo treatment verification by means of in-beam PET monitoring was developed and tested on simulated and measured patients. The selected patients, affected by head-and-neck tumors, were treated with proton therapy at the CNAO facility and represented different degrees of morphological modifications that can occur during the treatment course. The activity images acquired during irradiation were analyzed with a robust approach based on a multithreshold procedure in order to detect possible particle range deviations. The proposed compliance map was found to be an effective tool for clinical evaluation of the studied cases. The map can be overlaid on the patient CT to evaluate the spatial position of the critical region. Furthermore, the developed CLUT can help clinicians to foresee an eventual dose discrepancy in the treatment so as to better plan for a control CT and look for possible morphological changes with a patient-tailored schedule. The proposed analysis will be tested on the complete database of patients recruited during the ongoing INSIDE clinical trial in order to better assess its performance in a clinical environment, mainly in the case of patients affected by pathologies in which a morphological change may happen. These patients, in particular, will help clinicians to make an assessment about the patient schedule of control CT exams during the treatments.
Data Availability Statement
The raw data supporting the conclusions of this article will be made available by the authors, without undue reservation.
Ethics Statement
The studies involving human participants were reviewed and approved by Comitato etico Fondazione CNAO-San Matteo, Pavia. The patients/participants provided their written informed consent to participate in this study.
Author Contributions
EF and VF developed the proposed analysis and wrote the manuscript. MB, FP, ASa, GS, GT, EMal, and AK reviewed the manuscript. FV, BV, VV, ST, and DM recruited the analysed patients. FV, VV, ST, GBar, AM, and MC contributed in the clinical trial design. GBat, VF, EF, SV, GM, IM, SM, AK, and FP developed Monte Carlo simulations. PC, MS, YD, AE, VF, EF, MF, EMal, GT, ASa, ASci, FP, and MB acquired the data. GG, PM, AR, MR, RW, MM, FP, EF, VF, and MB constructed and commissioned the in-beam PET. VF, EF, MM, AP, and FP developed SW for the PET acquisition and analysis. FL, CL, EMaz, AR, and GS implemented the INSIDE database. NC developed the image reconstruction algorithm. MB, NB, and VR performed preliminary test with PET systems. MD, GF, MMag, CMT, MMar, RM, VP, ASch, EC, and MT participated in the development of the INSIDE bimodal system.
Funding
The INSIDE project (INnovative Solutions for In-beam Dosimetry in HadronthErapy) was funded by the Italian Ministry of Education under the national research program PRIN MIUR 2010P98A75 from 2013 to 2016, the Italian Institute of Nuclear Physics (INFN) (RDH and PETRA projects) from 2016, the Historical Museum of Physics and the Enrico Fermi Study and Research Center, the Tuscany Government (POR FSE 2014 -2020, through the PETRA-INFN-RT2 172800 Project) from 2018, and the CNAO Foundation from 2017.
Conflict of Interest
The authors declare that the research was conducted in the absence of any commercial or financial relationships that could be construed as a potential conflict of interest.
References
1. Parodi K, Polf JC In vivo range verification in particle therapy. Med Phys (2018) 45(11):e1036–50. doi:10.1002/mp.12960
2. Durante M, Orecchia R, Loeffler JS Charged-particle therapy in cancer: clinical uses and future perspectives. Nat Rev Clin Oncol (2017) 14(8):483–95. doi:10.1038/nrclinonc.2017.30
4. Paganetti H Range uncertainties in proton therapy and the role of Monte Carlo simulations. Phys Med Biol (2012) 57(11):R99–117. doi:10.1088/0031-9155/57/11/R99
5. Cubillos-Mesías M, Troost EGC, Lohaus F, Agolli L, Rehm M, Richter C, et al. Including anatomical variations in robust optimization for head and neck proton therapy can reduce the need of adaptation. Radiother Oncol (2019) 131:127–34. doi:10.1016/j.radonc.2018.12.008
6. Placidi L, Bolsi A, Antony J, Schneider RA, Malyapa R, Weber DC, et al. Effect of anatomic changes on pencil beam scanned proton dose distributions for cranial and extracranial tumors. Int J Radiat Oncol Biol Phys (2017) 97(3):616–23. doi:10.1016/j.ijrobp.2016.11.
7. Engelsman M, Schwarz M, Dong L Physics controversies in proton therapy. Semin Radiat Oncol (2013) 23:88–96. doi:10.1016/j.semradonc.2012.11.003
8. Hoffmann L, Alber M, Jensen MF, Holt MI, Møller DS Adaptation is mandatory for intensity modulated proton therapy of advanced lung cancer to ensure target coverage. Radiother Oncol (2017) 122(3):400–5. doi:10.1016/j.radonc.2016.12.018
9. Guerra AD, Belcari N, Bisogni M Positron emission tomography: its 65 years. Riv Nuovo Cimento (2016) 39(155):155–223. doi:10.1393/ncr/i2016-10122-6
10. Parodi K On- and off-line monitoring of ion beam treatment. Nucl Instrum Methods Phys Res Sect A Accel Spectrom Detect Assoc Equip (2016) 113–9. doi:10.1016/j.nima.2015.06.056
11. Brombal L, Barbosa D, Belcari N, Bisogni MG, Camarlinghi N, Cristoforetti L, et al. Proton therapy treatment monitoring with in-beam pet: investigating space and time activity distributions. Nucl Instrum Methods Phys Res Sect A Accel Spectrom Detect Assoc Equip (2017) 71–6. doi:10.1016/j.nima.2017.05.002
12. Pawelke J, Byars L, Enghardt W, Fromm WD, Geissel H, Hasch BG, et al. The investigation of different cameras for in-beam PET imaging. Phys Med Biol (1996) 41(2):279–96. doi:10.1088/0031-9155/41/2/006
13. Enghardt W, Crespo P, Fiedler F, Hinz R, Parodi K, Pawelke J, et al. Charged hadron tumour therapy monitoring by means of PET. Nucl Instrum Methods Phys Res Sect A Accel Spectrom Detect Assoc Equip (2004) 525(1):284–8. doi:10.1016/j.nima.2004.03.128
14. Tommasino F, Durante M Proton radiobiology. Cancers (2015) 7(1):353–81. doi:10.3390/cancers7010353-
15. Buitenhuis HJT, Diblen F, Brzezinski KW, Brandenburg S, Dendooven P Beam-on imaging of short-lived positron emitters during proton therapy. Phys Med Biol (2017) 62(12):4654–72. doi:10.1088/1361-6560/aa6b8c
16. E Combs S, Bauer J, Unholtz D, Kurz C, Welzel T, Habermehl D, et al. Monitoring of patients treated with particle therapy using positron-emission-tomography (PET): the miranda study. BMC Cancer (2012) 12(1):133. doi:10.1186/1471-2407-12-133
17. Nishio T, Miyatake A, Ogino T, Nakagawa K, Saijo N, Esumi H The development and clinical use of a beam on-line PET system mounted on a rotating gantry port in proton therapy. Int J Radiat Oncol Biol Phys (2010) 76(1):277–86. doi:10.1016/j.ijrobp.2009.05.065
18. Ferrero V, Fiorina E, Morrocchi M, Pennazio F, Baroni G, Battistoni G, et al. Online proton therapy monitoring: clinical test of a silicon-photodetector-based in-beam PET. Sci Rep (2018) 8(1):4100. doi:10.1038/s41598-018-22325-6
19. Fischetti M, Baroni G, Battistoni G, Bisogni MG, Cerello P, Ciocca M, et al. Interfractional monitoring of C ions treatments: results from a clinical trial at the cnao facility. Sci Rep (2020) 10(1):20735. doi:10.1038/s41598-020-77843-z
20. Bisogni MG, Attili A, Battistoni G, Nicola Belcari , Cerello P, Coli S, et al. Inside in-beam positron emission tomography system for particle range monitoring in hadrontherapy. J Med Imaging (2017) 4(1):011005. doi:10.1117/1.JMI.4.1.011005
21. Traini G, Battistoni G, Bollella A, Collamati F, De Lucia E, Faccini R, et al. Design of a new tracking device for on-line beam range monitor in carbon therapy. Phys Med (2017) 34:18–27. doi:10.1016/j.ejmp.2017.01.004
22. Mattei I, Battistoni G, De Simoni M, Dong Y, Embriaco A, Fischetti M, et al. Scintillating fiber devices for particle therapy applications. IEEE Trans Nucl Sci (2018). doi:10.1109/TNS.2018.2843179
24. Camarlinghi N, Sportelli G, Battistoni G, Belcari N, Cecchetti M, Cirrone GAP, et al. An in-beam pet system for monitoring ion-beam therapy: test on phantoms using clinical 62 mev protons. J Instrum (2014) 9(04):C04005. doi:10.1088/1748-0221/9/04/c04005
25. Kraan AC, Muraro S, Battistoni G, Belcari N, Bisogni MG, Camarlinghi N, et al. Analysis of time-profiles with in-beam PET monitoring in charged particle therapy. Med Phys (2018) arXiv preprint arXiv:1809.11055. doi:10.1088/1748-0221/14/02/C02001
26. Muraro S, Camarlinghi N, Belcari N, Bisogni MG, Guerra AD, Kraan A, et al. Low statistics positron activity reconstruction methods for proton therapy. Nucl Instrum Methods Phys Res Sect A Accel Spectrom Detect Assoc Equip (2018) 936:52–3. doi:10.1016/j.nima.2018.10.015
27. Li Z, Fan Y, Dong M, Tong L, Zhao L, Yin Y, et al. In-beam pet imaging in carbon therapy for dose verification. IEEE Trans Radiat Plasma Med Sci (2018) 2(1):61–7. doi:10.1109/trpms.2017.2769109
28. Bongrand A, Busato E, Force P, Martin F, Montarou G Use of short-lived positron emitters for in-beam and real-time β+ range monitoring in proton therapy. Phys Med (2020) 69:248–55. doi:10.1016/j.ejmp.2019.12.015
29. Kraan AC Range verification methods in particle therapy: underlying physics and Monte Carlo modeling. Front Oncol (2015) 5:150. doi:10.3389/fonc.2015.00150
31. Ferrari A, Sala PR, Fasso A, Ranft J Fluka: a multi-particle transport code (program version 2005) (2005). Geneva, Switzerland: CERN. Technical report. Report No.: CERN-2005-010, SLAC-R-773, INFN-TC-05-11, CERN-2005-10.
32. Battistoni G, Bauer J, Boehlen TT, Cerutti F, Santos Augusto RD, Ferrari A, et al. The fluka code: an accurate simulation tool for particle therapy. Front Oncol (2016) 6:116. doi:10.3389/fonc.2016.00116
33. Ma P, Belcari N, Bisogni MG, Camarlinghi N, Cerello P, Coli S, et al. First results of the inside in-beam PET scanner for the on-line monitoring of particle therapy treatments. J Instrum (2016) 11(12):C12011. doi:10.1088/1748-0221/11/12/C12011
34. Ferrero V The inside project: in-beam PET scanner system features and characterization. J Instrum (2017) 12(03):C03051. doi:10.1088/1748-0221/12/03/c03051
35. Ferrero V, Bisogni MG, Camarlinghi N, Fiorina E, Giraudo G, Morrocchi M, et al. Double-field hadrontherapy treatment monitoring with the inside in-beam PET scanner: proof of concept. IEEE Trans Radiat Plasma Med Sci (2018) 2(6):588–93. doi:10.1109/trpms.2018.2870478
36. Pennazio F, Battistoni G, Bisogni MG, Camarlinghi N, Ferrari A, Ferrero V, et al. Carbon ions beam therapy monitoring with the inside in-beam PET. Phys Med Biol (2018) 63(14):145018. doi:10.1088/1361-6560/aacab8
37. Fiorina E, Ferrero V, Pennazio F, Baroni G, Battistoni G, Belcari N, et al. Monte Carlo simulation tool for online treatment monitoring in hadrontherapy with in-beam PET: a patient study. Phys Med (2018) 51:71–80. doi:10.1016/j.ejmp.2018.05.002
38. Schneider W, Bortfeld T, Schlegel W Correlation between CT numbers and tissue parameters needed for Monte Carlo simulations of clinical dose distributions. Phys Med Biol (2000) 45(2):459–78. doi:10.1088/0031-9155/45/2/314
39. Lima TV, Dosanjh M, Ferrari A, Molineli S, Ciocca M, Mairani A Monte Carlo calculations supporting patient plan verification in proton therapy. Front Oncol (2016) 6:62. doi:10.3389/fonc.2016.00062
40. Nischwitz SP, Bauer J, Welzel T, Rief H, Oliver J, Haberer T, et al. Clinical implementation and range evaluation of in vivo PET dosimetry for particle irradiation in patients with primary glioma. Radiother Oncol (2015) 115(2):179–85. doi:10.1016/j.radonc.2015.03.022
41. Hee Min C, Zhu X, Winey BA, Grogg K, Testa M, El Fakhri G, et al. Clinical application of in-room positron emission tomography for in vivo treatment monitoring in proton radiation therapy. Int J Radiat Oncol Biol Phys (2013) 86(1):183–9. doi:10.1016/j.ijrobp.2012.12.010
42. Bauer J, Unholtz D, Sommerer F, Kurz C, Haberer T, Herfarth K, et al. Implementation and initial clinical experience of offline PET/CT-based verification of scanned carbon ion treatment. Radiother Oncol (2013) 107(2):218–26. doi:10.1016/j.radonc.2013.02.018
43. Frey K, Unholtz D, Bauer J, Debus J, Min CH, Bortfeld T, et al. Automation and uncertainty analysis of a method for in vivo range verification in particle therapy. Phys Med Biol (2014) 59(19):5903–19. doi:10.1088/0031-9155/59/19/5903
44. Xie Y, Hassane EB, Janssens G, Smeets J, Vander Stappen F, Hotoiu L, et al. Prompt gamma imaging for in vivo range verification of pencil beam scanning proton therapy. Int J Radiat Oncol Biol Phys (2017) 99(1):210–8. doi:10.1016/j.ijrobp.2017.04.027
45. Piliero MA, Pennazio F, Bisogni MG, Camarlinghi N, Cerello PG, Guerra AD, et al. Full-beam performances of a PET detector with synchrotron therapeutic proton beams. Phys Med Biol (2016) 61(23):N650–66. doi:10.1088/0031-9155/61/23/N650
Keywords: proton therapy, in vivo treatment verification, in-beam pet, range monitoring, Monte Carlo simulation, adaptive therapy, clinical trial
Citation: Fiorina E, Ferrero V, Baroni G, Battistoni G, Belcari N, Camarlinghi N, Cerello P, Ciocca M, De Simoni M, Donetti M, Dong Y, Embriaco A, Fischetti M, Franciosini G, Giraudo G, Kraan A, Laruina F, Luongo C, Maestri D, Magi M, Magro G, Malekzadeh E, Mancini Terracciano C, Marafini M, Mattei I, Mazzoni E, Mereu P, Mirabelli R, Mirandola A, Morrocchi M, Muraro S, Patera A, Patera V, Pennazio F, Retico A, Rivetti A, Da Rocha Rolo MD, Rosso V, Sarti A, Schiavi A, Sciubba A, Solfaroli Camillocci E, Sportelli G, Tampellini S, Toppi M, Traini G, Valle SM, Valvo F, Vischioni B, Vitolo V, Wheadon R and Bisogni MG (2021) Detection of Interfractional Morphological Changes in Proton Therapy: A Simulation and In Vivo Study With the INSIDE In-Beam PET. Front. Phys. 8:578388. doi: 10.3389/fphy.2020.578388
Received: 30 June 2020; Accepted: 22 December 2020;
Published: 27 January 2021.
Edited by:
Claudia Kuntner, Austrian Institute of Technology (AIT), AustriaReviewed by:
Gérard Montarou, UMR6533 Laboratoire de Physique de Clermont (LPC), FranceDenis Dauvergne, Centre National de la Recherche Scientifique (CNRS), France
Copyright © 2021 Fiorina, Ferrero, Baroni, Battistoni, Belcari, Camarlinghi, Cerello, Ciocca, De Simoni, Donetti, Dong, Embriaco, Fischetti, Franciosini, Giraudo, Kraan, Laruina, Luongo, Maestri, Magi, Magro, Malekzadeh, Mancini Terracciano, Marafini, Mattei, Mazzoni, Mereu, Mirabelli, Mirandola, Morrocchi, Muraro, Patera, Patera, Pennazio, Retico, Rivetti, Da Rocha Rolo, Rosso, Sarti, Schiavi, Sciubba, Solfaroli Camillocci, Sportelli, Tampellini, Toppi, Traini, Valle, Valvo, Vischioni, Vitolo, Wheadon and Bisogni. This is an open-access article distributed under the terms of the Creative Commons Attribution License (CC BY). The use, distribution or reproduction in other forums is permitted, provided the original author(s) and the copyright owner(s) are credited and that the original publication in this journal is cited, in accordance with accepted academic practice. No use, distribution or reproduction is permitted which does not comply with these terms.
*Correspondence: Veronica Ferrero, dmVyb25pY2EuZmVycmVyb0B0by5pbmZuLml0