 Toke Printz Ringbæk1,2
 Alina Santiago1,2,3
 Leszek Grzanka4
 Kilian Baumann1,5
 Veronika Flatten1,5Rita Engenhart-Cabillic1,3Niels Bassler6,7,8
 Klemens Zink3,5
 Uli Weber9*
- 1Department of Radiotherapy and Radiation Oncology, Philipps-University, Marburg, Germany
- 2Department of Radiotherapy, University Hospital Essen, Essen, Germany
- 3Department of Radiotherapy and Radiation Oncology, University Medical Center, Gießen and Marburg, Giessen, Germany
- 4Institute of Nuclear Physics, Polish Academy of Sciences, Krakow, Poland
- 5University of Applied Science, Gießen-Friedberg, Giessen, Germany
- 6Department of Physics, Medical Radiation Physics, Stockholm University, Stockholm, Sweden
- 7Department of Oncology and Pathology, Medical Radiation Physics, Karolinska Institute, Stockholm, Sweden
- 8Department of Experimental Clinical Oncology, Aarhus University Hospital, Aarhus, Denmark
- 9GSI Helmholtzzentrum für Schwerionenforschung, Darmstadt, Germany
Ion beams passing through lung tissue show more pronounced energy straggling than expected for solid materials of the same thickness. Energy straggling in active scanning particle therapy can enlarge the pencil beam Bragg peaks in-depth as well as displace them, deteriorating the dose coverage of a target within the lung. While this is not yet considered in any known treatment planning system, we implement a mathematical model to be used for treatment planning, using TRiP98, which relies on a deterministic pencil beam algorithm. Through a randomization process based on a continuous Poisson probability distribution, the HU values of lung voxels are replaced with a modified value in successive iterations. The beam-modulation effect of the lung can thus be taken into account in treatment planning by recalculating the dose n times for n randomized CTs using the raster scan file of a plan that was optimized on the nonmodulated CT. The evaluation follows by averaging the resulting n dose distributions and comparing to the corresponding nonmodulated dose distribution, attending at dosimetric indices and dose-volume histograms. In this work, the functionality of these routines was tested for proton and carbon ion plans for two selected lung cancer patient cases with deep-seated tumors, showing that, with existing standard tools, it is possible to calculate the beam-modulation effect of the lung in TRiP98 in a transparent way. Variable model parameters, such as modulation power, voxel size and density voxel selection range, were evaluated. Furthermore, a systematic study for spherical geometries in a lung tissue CT cube is presented to investigate general trends.
Introduction
With the dose deposited locally in the energy-dependent narrow Bragg peak (BP) after which little-to-no-dose is given, particle therapy offers potentially more conformal treatments, as compared to photon irradiation, with improved normal tissue sparing. In particular with the pencil beam scanning method, where the lateral beam displacement is done by magnets and the range of each BP is changed by modulating the beam energy, a more conformal dose delivery, with fewer field directions, can be achieved compared to photons [1, 2].
Due to the porous nature of the lung, ion beams passing through a lung (or lung substitute material) show a more pronounced energy straggling than for solid materials [3, 4]. A substantial broadening of the BP shape has been found when irradiating lung tissue [5, 6]. So far, current treatment planning systems (TPS) assume no additional BP broadening due to tissue heterogeneities. Ordinary planning CT images cannot capture this beam-modulation effect of the lung since the CT voxel size spatially undersamples the microscopic lung alveoli. However, the beam-modulation effect of the lung could be of clinical relevance for lung tumor treatments, which motivates this study. If this broadening effect is not taken into consideration, it can potentially lead to an undesired inhomogeneity in the dose distribution, underdosage of the planning target volume (PTV) and overdosage of the healthy surrounding normal tissue, especially in the distal region close to the PTV [3, 7].
Through the use of a 3D printed binary voxel model (the voxels in the geometry are either composed by air or by the printing plastic material) the BP degradation of lung irradiation for protons has been shown to cause for initial beam energies of 140 and 200 MeV an increase of up to 60% for the 80–20% distal beam fall-off as compared to the unperturbed reference curve [5]. Using a similar binary voxel model, a mathematical method for estimating the broadening effect of a porous material has been developed [4, 6, 8]. The degree of this broadening depends on the average size of the microscopic structures as well as on the material density and thickness. For materials with a fine (
Treatment planning studies investigating the effects on the dose uncertainties in treatment plans of lung cancer patients are limited to a few published works. Flatten et al. [9] investigated the effects of the BP degradation in proton beams by using CT phantoms with spherical targets of variable sizes placed at different depths in the lung. The lung modulation has been implemented in the TOPAS Monte Carlo tool [6] using sets of modulated DICOM images. It was shown that the underdosage of the target volume, due to the BP degradation, increases with an increasing depth of the tumor in lung and a decreasing tumor volume. In a further study by the same group [10] the effects were investigated on proton treatment plans of lung cancer patients. It was found that the maximum underdosage of the target volume due to the BP degradation was in the order of 5% while the average underdosage was roughly 2%. In another study [11] the effects on clinical treatment plans in proton beams were investigated using an analytical approach: Instead of using sets of modulated DICOM images and Monte Carlo tools, the pristine proton BPs were convolved using the MatRad toolkit [12] with several superimposed normal distributions of sigma values defined by certain modulation power values of the lung tissue. The underdosage of the target volumes was comparable to the results from Baumann [6]. However, to the best of our knowledge, there are no studies investigating the modulation effects for treatment planning with carbon ion beams. For carbon ion beams a more pronounced modulation effect is expected, because of the much sharper carbon BPs compared to protons. The lack of a carbon ion TPS for carbon ion beams that can calculate the lung modulation effect was a main motivation for this work.
To take the lung modulation effect into account directly, the CT resolution is crucial [5]. The resolution of a clinical CT image used for treatment planning is typically around 1 mm but the biological porous structure of the lung leading to the modulation is in the μm range. To work with CTs with μm resolution, assuming such images can be obtained, would lead to an impractically large data array and time increase in the handling of the DICOM data. The method presented in this work bypasses this problem.
The aim of the present work is to show that, with existing deterministic pencil beam dose calculation algorithms like the one in TRIP98 [13–15], it is possible to calculate the beam-modulation effect of the lung tissue. Here the term, “deterministic” applies to dose calculation algorithms with analytical functions that describe a 3D pencil beam dose distribution and deliver reproducible results without random seeds. TRiP98 is a treatment planning system that was developed for research and patient treatment at the Helmholtzzentrum für Schwerionenforschung, Darmstadt, Germany (GSI). It was used to treat 440 patients during the GSI pilot project. The basic algorithms and the pencil beam model of TRIP98 were implemented into the carbon ion planning module of the Siemens Syngo PT TPS [16] that is currently used at the ion beam facilities in Heidelberg (HIT), Marburg (MIT), Shanghai (SPHIC) and Pavia (CNAO). Although we are using a deterministic pencil beam dose calculation, the results of the procedure cannot be considered entirely deterministic because the sampling of the HU values is done with random functions.
The beam-modulation effect calculation is done by implementing a mathematical model based on a continuous Poisson probability distribution within the open-source PyTRiP tool [17]. Through a randomization process, the HU value of each selected lung voxel is changed into a modified value. The lung beam-modulation effect on patient treatment plans can then be estimated by recalculating the dose n times for n randomized CTs, using raster scan files for plans optimized on nonmodulated CTs and afterward averaging the n dose distributions. Thus the result can be compared to the corresponding nonmodulated dose distribution. Using spherical PTV geometries and two selected patient cases, we evaluated a number of different model and planning parameters to show their respective relevance in terms of PTV coverage deterioration as a result of the lung modulation effect for carbon ion as well as for proton plans.
Materials and Methods
Treatment Planning System TRiP98 and Python Package PyTRiP98
All treatment plans were calculated using the ion TPS TRiP98 [13–15].
In former studies [18, 19], facility-specific baseline data, including depth-dose distributions and lateral profiles, were generated with SHIELD-HIT12A [20] for both carbon ions and protons.
PyTRiP [17, 21] is an open-source python package for, among other purposes, facilitating the work with TRiP98 and with TRiP native files. PyTRiP can import, export, convert and modify such files and execute TRiP98 locally or remotely. PyTRiP enables scripting large parameter studies of treatment plans and more advanced and automatized (programmable) manipulation than what a commercial TPS usually allows. PyTRiP handles the CT and planning contour files, as well as dose cubes from calculated plans and permits extensive manipulation on these objects, making it possible to randomize n CTs, recompute a plan on each of them and average all the calculated dose cubes.
The presented concept follows Baumann et al. [6] but is done in a fully automated and integrated environment and works for a standard pencil beam algorithm.
Mathematical Implementation of CT Randomization
For each investigated planning case, first a treatment plan on the unmodified planning CT is calculated, producing a raster scan file for each case. Afterward, a dose recalculation, using these raster scan files, is done n times following the mathematical method described below. This is based on the “binary voxel model” for porous targets, where the target is divided into high and low density voxels, which each traversing particle will hit with probabilities of p and (1-p), respectively, [4, 6]. The probability for hitting k voxels with high density is thus given by a binomial distribution, which, for a large number of voxels, can be approximated by a normal distribution. While this normal distribution can be subsequently used to modulate the individual PBs, here we will modify the CT voxels of a certain volume of interest (VOI), in this case the ipsilateral lung VOIlung.
First the tissue density in each voxel of the CT image is calculated using the standard HU conversion table of TRiP98. Then, the voxels of VOIlung (within a user-defined density range
with σ being the Gaussian sigma from the normal distribution and t the mean water-equivalent path length. The larger the value of Pmod, the broader the BP and the wider its distal fall-off.
Both parameters
The water-equivalent voxel length t =
where n = (
In each of the n runs the following procedure is performed for all selected lung voxels. The water-equivalent path length through the voxel is randomized corresponding to
The delta-Dirac function

FIGURE 1. Histogram of the WEPL voxel values in the beam direction of the original CT (t values in blue) and after application of the randomization voxel modulation routine (
For the density sampling of the individual voxels with an initial density
At the end HU(
In comparison to the previous work [6], where
Calculation of the Poisson Distribution Parameters
The mathematical principle for the calculation of the tables of the Poisson distribution
N is chosen as a value large enough (typically 10), that the contribution of the negative part of the Gaussian distribution (right term in Eq. 5) becomes negligible. The idea behind this concept is that
Benchmark With an Analytical Convolution
Our PyTRiP routine was tested against our well-established analytical convolution method [6] (which has been confirmed experimentally [4, 8]) for 130 and 230 MeV/u carbon ion beams. For this test we used n = 60, Pmod = 0.500 mm and
The comparisons of the Bragg curves can bee seen in Figure 2. The agreement between the analytical curves and the curves from our PyTRiP routine is clearly seen.
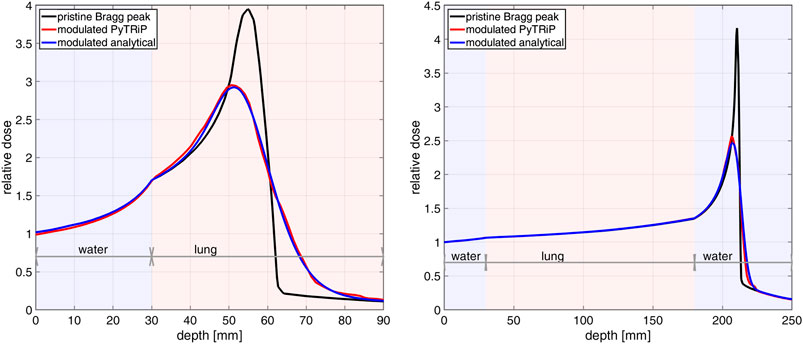
FIGURE 2. Modulation effect of the lung tissue for a 130 MeV/u (left) and a 230 MeV/u (right) carbon ion beam. The curves compare the analytically modulated Bragg curves (blue) vs. the Bragg curves modulated by PyTRiP (red) for a 15 cm lung cube starting at 3 cm inside a water phantom.
Lung Voxel Selection Range
When selecting the VOIlung voxels to be randomized, instead of using all voxels in the lung, we implemented a voxel selection by a user-defined density range
We adopted values of
Study of Spherical Planning Geometries
For a systematic analysis of the modulation effect as a function of the isocenter depth
First, a sphere of a constant 17 mm radius was placed at variable
For the sphere planning study, n = 100 and Pmod = 0.400 mm were used and all lung voxels were taken into account for the modulation. All plans were single field plans with the beam parallel to the z-axis. A 2 × 2 mm2
Patient Selection and Planning
Two lung cancer patient cases, henceforth called P1 and P2, with different PTV volumes VPTV and locations were selected. They were originally treated with photons at the university hospital in Marburg. For P1 the PTV is deep-seated and located close to the spine, whereas the PTV for P2 is centrally located. For both cases, the tumors are not close to the thorax wall, as some distance in the lung is required for the degradation effect. The PTVs were sufficiently small as to not drastically decrease the lung volume to be modulated. The isocenter slice of both patient geometries, P1 and P2, is given in Figure 3, showing for each patient case the PTV position and an exemplary dose distribution calculated on the non-modulated CTs.
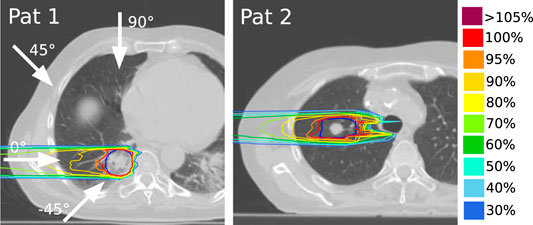
FIGURE 3. Patient geometries and nonmodulated carbon ion dose distributions for a horizontal beam for P1 (left) and P2 (right). Shown here are the isocenter transversal slices. The arrows indicate the four different field angles used in this work. The PTV contours are shown in dark blue.
Multiple plans for each of the two patients were created for protons as well as for carbon ions, focusing on the latter. For each nonmodulated case (planned on the nonmodulated CTs), planning parameters such as raster scan grid size, energy step size and optimization margins yielding the best PTV coverage with respect to dose conformity and target homogeneity were found by iterations. For the nonmodulated plans the planning objective was to deliver at least 95% of the prescribed dose to 98% of the PTV [25]. All plans were 1- or 2-field plans and optimized for physical (absorbed) dose. For the carbon ion cases, a 3 mm thick ripple filter was applied to broaden the BP, as is routine in the clinic [26].
Coplanar fields were used for the study. In order to have data with beams traversing different distances through the lung tissue
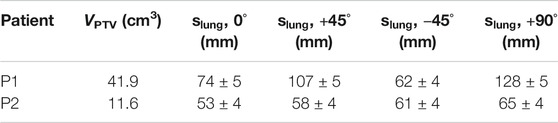
TABLE 1. PTV volumes VPTV and estimated travel distances through the lung to the isocenter
For protons, the “multiple scattering” algorithm was used for optimization and dose calculation, which considers the broadening of the beam as a function of patient depth [15]. For the carbon ion plans the much faster “all-points” algorithm, which is considering only all neighboring raster beam spots that may contribute to a given voxel [15], was used as this is normally sufficient for carbon ion plans [27]. Although comparisons between carbon ion plans with the two algorithms showed a slight difference in the plans (data not shown), the relative coverage difference between a modulated and nonmodulated dose distribution when comparing the algorithms was, even in the worst case, less than 0.5 percentual point (pp).
In addition to the main study, we calculated for the patient case P1 a range of carbon ion plans with lateral contour extensions from 0.6
Evaluation of the Parameters of the Lung Modulation Model
For the patient cases, the model parameters n, d, Pmod and
The parameter n was evaluated for values of 24, 48, 72, 100, 120, 150, 200, and 400. For Pmod, we chose 0.300, 0.400, 0.500, and 0.600 mm, as our former works show that realistic values of Pmod lie below 0.600 mm. For the treatment planning cases with oblique fields for P1, plans with three different values of mean voxel length d were calculated: One following Eq. 2 yielding d = 0.8439 mm, one using the unchanged length of the voxel d =
After the parameter study was done, selected values of these parameters were then used throughout the paper: n = 100,
Plan Evaluation
PTV coverage, dose homogeneity and planning conformity were used for dosimetric plan evaluations. In each patient case, the doses to lung, spinal cord, trachea and heart were compared between nonmodulated and modulated dose distributions. V95%, being the volume receiving at least 95% of the prescribed dose, was used for evaluating the PTV coverage. The homogeneity index (HI) and the conformity index (CI) were defined as:
where V95%pi is the volume within the patient receiving 95% of the prescribed dose.
Results
In general, the coverage and dose homogeneity of the PTVs were found to be worse for the modulated doses compared to the dose distributions calculated on the original CTs. This leads to a PTV dose overestimation by the TPS. The change in dose homogeneity was mainly due to a change in the minimum dose D98%. As expected, the relative difference between the modulated and nonmodulated dose distributions increases for larger values of Pmod.
For
Spherical Geometries
Figure 4 summarizes the results for modulated and nonmodulated dose distributions calculated for the spherical targets with 17 mm radius in a lung tissue CT cube. In Figures 4A,B), the DVHs for the nonmodulated and modulated dose distributions are shown for 6 different
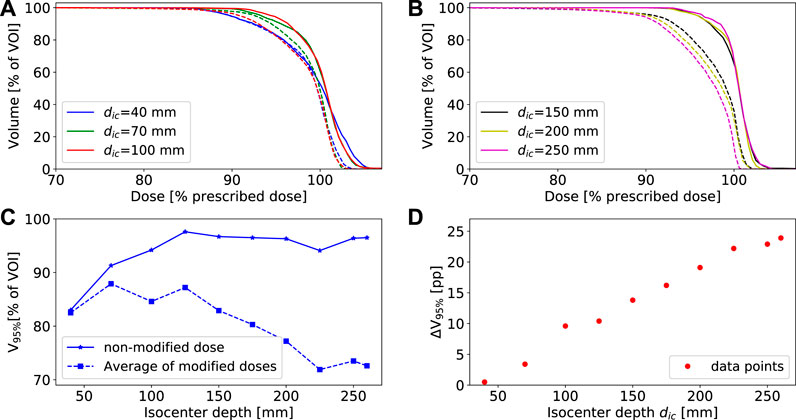
FIGURE 4. A),(B) show selected DVHs for a spherical PTV with a 17 mm radius at 6 different isocenter depths
In Figure 5A, the V95% values for plans with
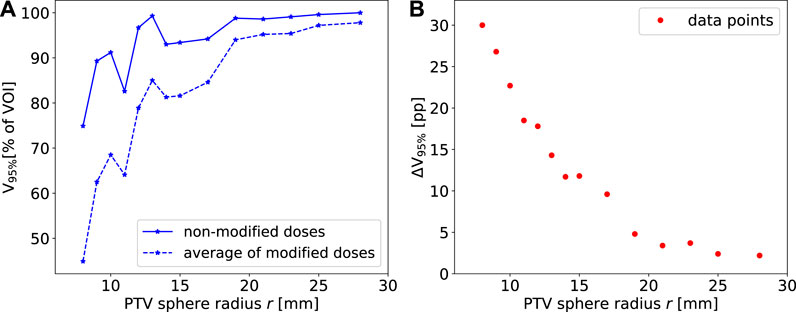
FIGURE 5. (A) The PTV V95% for the non-modulated and modulated cases for spherical PTVs with variable radii at
In both cases of Figures 4C, 5A, some outliers can be seen in the individual V95%-curves. Importantly, they occur for both the nonmodulated and modulated case, leaving their relative difference consistent. This is to be expected as the “modulated plans” are dose recomputations of the nonmodulated ones. Similar curve shapes were seen when using other coverage indices, as for example V90%, V80% or the mean dose (data not shown). One deviation from the smooth tendency that can be easily explained is the very superficial case at
Patient Plans
Dosimetric indexes V95%, D98%, D2% and dose homogeneity HI of the carbon ion patient plans are presented in Table 2 (for P1) and Table 3 (for P2) for the nonmodulated cases and for the recalculated modulated dose distributions. The planning cases for P2 for
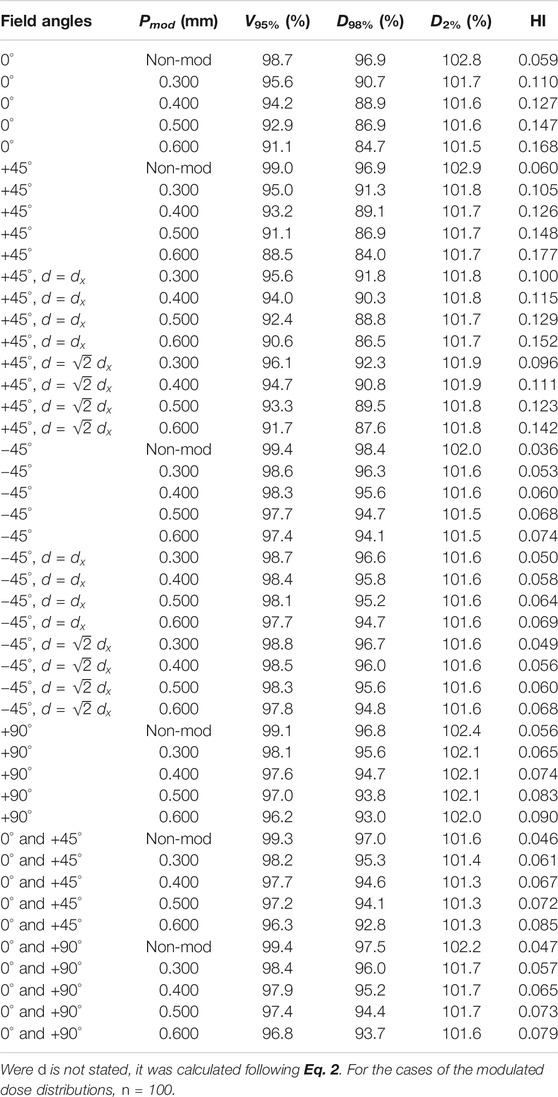
TABLE 2. Dosimetric indices for carbon ion treatment plans for P1 with
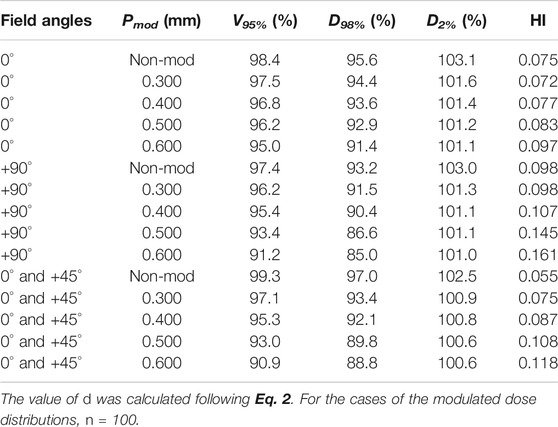
TABLE 3. Dosimetric indices for carbon ion treatment plans for P2 with
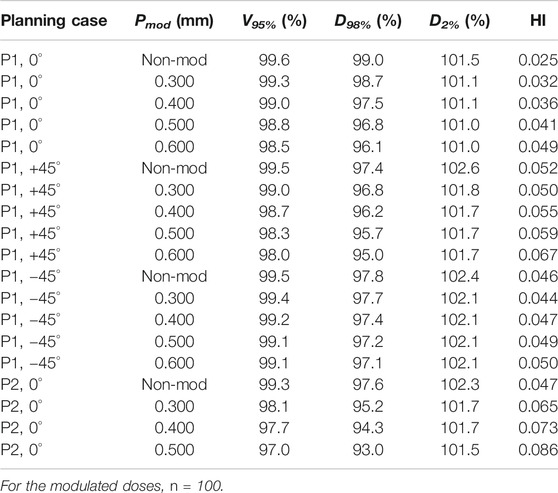
TABLE 4. Dosimetric indices for proton treatment plans for P1 and P2 with
DVHs for PTV, trachea and lung in the nonmodulated and modulated dose distributions in selected one-beam plans for P1 (horizontal and oblique beams) and P2 (horizontal beam) are shown for carbon ions and protons in Figures 6, 7, respectively. No difference was found in the DVHs with and without lung modulation for the organs not displayed in these graphs. Zoomed plots for the DVHs of the PTV help to see the relative differences between nonmodulated and modulated dose distributions.
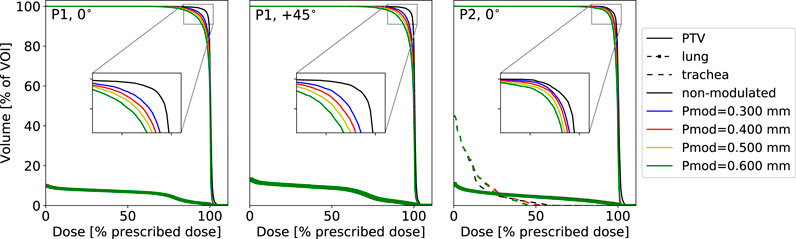
FIGURE 6. DVHs of relevant VOIs for
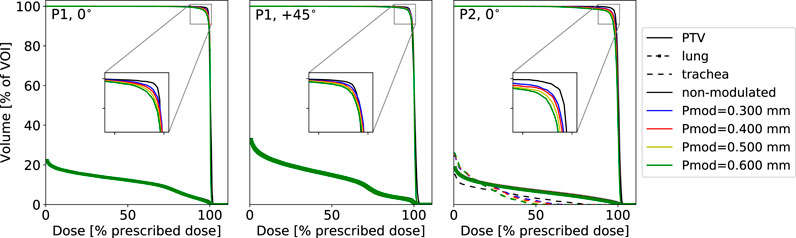
FIGURE 7. DVHs of selected VOIs for proton plans on the non-modified CTs compared to plans on n = 100 summed modified CTs with different Pmod values. Three treatment planning cases are shown for P1 planned with a horizontal field as well as with one oblique field at +45° as well as for P2 with a horizontal field. Plans were optimized and calculated for physical dose with a 3 × 3 mm2 raster scan size and a depth step size of 3 mm P1 and 2 mm for P2.
As can be seen comparing Tables 2–4 and by comparing Figures 6, 7, the relative differences between nonmodulated and modulated dose distributions are larger for carbon ions than for protons, which can be attributed to the generally sharper carbon ion BPs. Actually, for all cases of the modulated proton plans for P1, the drop in V95% never compromised the planning objective of giving at least 95% prescribed dose to 98% of the PTV volume. Our conclusion is that the lung modulation effect is not very severe for proton treatment planning. This is in agreement with other findings [10, 11]. We focus on the carbon ions plans for further analysis due to the larger modulation effect observed for this particle type relative to protons.
Of all the displayed DVHs, only those corresponding to the trachea for the case P2 exhibit a slightly changed maximum dose when considering the lung modulation effect (D2% changes from 45.5% of the prescribed dose for the non-modulated plan to 38.9% for the case of Pmod = 0.600 mm). In the low dose region, the DVH for the trachea is slightly larger for the modified doses compared to the nonmodulated one. For example V20% = 7.3% of the prescribed dose for the nonmodulated dose compared to 10.4% of the prescribed dose for the dose distribution calculated with Pmod = 0.600 mm. None of these findings bear however a clinical relevance.
The dose to the lung displays minimal changes between modulated and nonmodulated dose distributions. Due to the generally smaller beam spot sizes of carbon ion beams, the ipsilateral lung could be better spared using carbon ions with approximately half the integral dose given to the lung compared to the proton plans. As an example, for P1, the V5% with a horizontal proton beam is 18.8% of the prescription dose compared to 8.9% delivered with carbon ions.
Due to the tumor location of the selected patients, far from critical organs (the spinal cord for example), we will focus on assessment of the changes in target coverage as presented in Tables 2–4.
In Figure 8 is shown the relative difference between the V95% of the nonmodulated doses and the modulated doses calculated for the values of Pmod = 0.300 mm (blue plots) and Pmod = 0.600 mm (green plots) as a function of the distance traversed through the lung
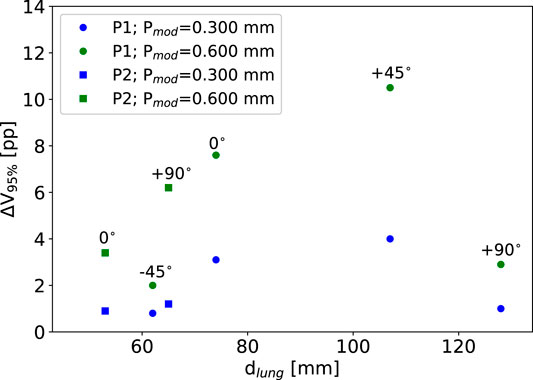
FIGURE 8. The difference in target coverage between the non-modulated doses and the doses calculated with Pmod = 0.300 mm (blue plots) and Pmod = 0.600 mm (green plots) as a function of the amount of lung traversed by the particle beam (see Table 1). Circles mark data for P1, squares mark data for P2. For the Pmod = 0.600 mm plots the matching field angles are shown. All plans are for carbon ions.
In the clinic, single field plans would rarely be used. Therefore, we also included selected few dual-field plans in the study. The dual-field plans are providing better and more conform target coverage, also for the nonmodulated doses and it can be seen that the drop in target coverage caused by the beam-modulation effect is slightly smaller for the dual-field plans relative to the nonmodulated ones.
The Effect of the Voxel Length d
As expected, and as can additionally be seen in Table 2, the relative difference between the plans with different values of d are significantly larger for the +45° cases where the particles traverse roughly twice the amount of lung tissue compared to the −45° cases. Also, it can be seen that the larger the value of Pmod, the more critical a variation in d becomes. However, even for +45° the largest decrease in V95% seen between d = 0.8439 mm and d = 1.339 mm is 2.9 pp. For −45°, the largest decrease is only 0.4 pp.
Selecting Modulation Lung Voxels
Dosimetric indexes for plans with Pmod = 0.400 mm and variable
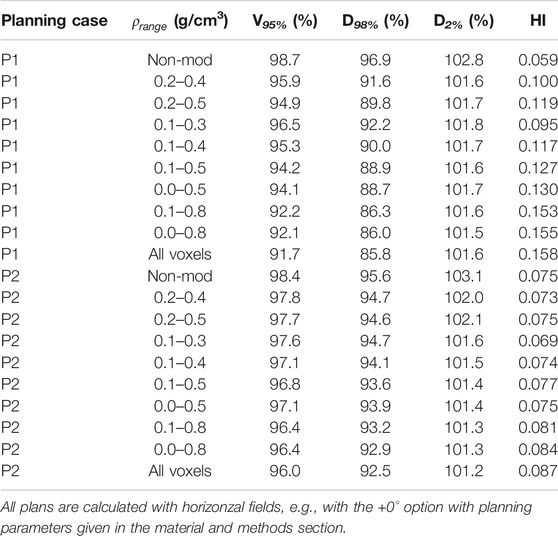
TABLE 5. Dosimetric indices for carbon ion plans for patients P1 and P2 and Pmod = 0.400 mm for variable values of
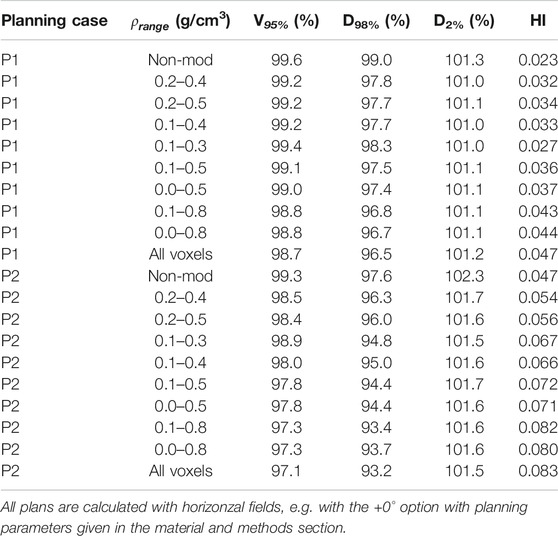
TABLE 6. Dosimetric indices for proton plans for patients P1 and P2 and Pmod = 0.400 mm for variable values of
The same trends for V95% and HI as for
Both of the extreme cases,
Effect of Changes on the Planning Parameter Settings
Figure 9 shows a boxplot with outliers for coplanar horizontal field plans for P1 with variable planning parameters (see the materials and methods section). Nonmodulated and modulated doses, calculated with Pmod = 0.400 mm, are shown separately. All plans that in the nonmodulated cases had V95% below 98.0% or a CI above 2.5 were omitted from this study, as they did not fulfill the planning objectives.
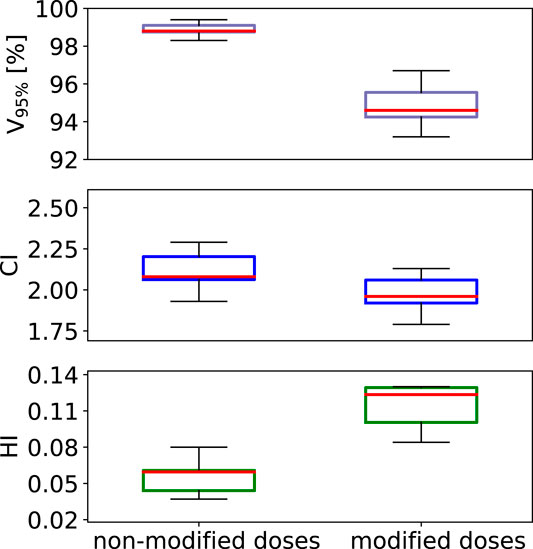
FIGURE 9. A standard boxplot (median, 1. and 3. quartiles and whiskers including the outliers) for V95%, HI and CI data sets obtained for patient case P1 using a horizontal beam for non-modulated as well as modulated dose distributions for carbon ions. A set of variable planning parameters was used as given in the materials and method section.
It is seen how V95%, for the modulated dose distributions, varies more from a change in planning parameters. We observed that the better the nonmodulated plan was, in terms of PTV coverage and dose homogeneity, the smaller the relative difference between the nonmodulated and the modulated dose distribution.
For a small number of plans with specific parameter settings, the dose distribution was even improved by the lung modulation, in terms of PTV coverage and homogeneity. It was seen that, in some cases, it is possible to first calculate an inferior plan for the nonmodulated case, which due to the broader and slightly displaced BPs caused by the lung-modulation effect can result in a plan fulfilling the planning objectives for the modulated case. As an example, we show in Figure 10 DVHs for a plan calculated on patient case P2, for a non-modified case (solid lines) compared to the sum of doses calculated on 100 modified CTs (dashed lines). A horizontal field was used, with beam spot spacing of 3 mm, energy step 3 mm, and lateral contour extension 1.2
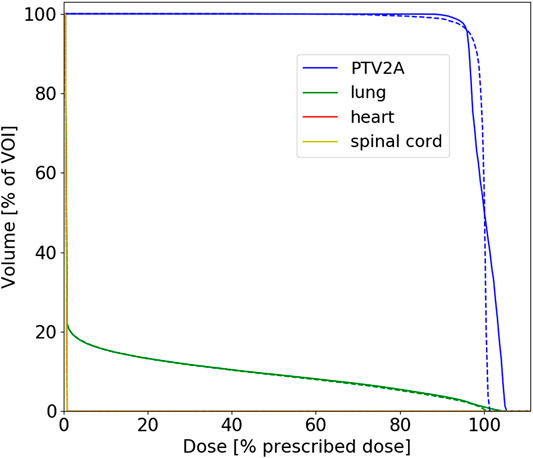
FIGURE 10. DVHs for proton plans calculated on patient case P2 for non-modified (solid lines) vs. sum of 100 modified CTs (dashed lines). The corresponding planning parameters and dosimetric indexes are given in the text.
Discussion
The beam-modulation effect caused by the porous material of the lung results in a lower PTV coverage and dose homogeneity. This effect is clearly more pronounced for carbon ions than for protons, as the sharper the initial BP the stronger the modulation effect. The modulation effect is generally negligible in proton treatments, as compared to the other dose delivery and treatment uncertainties related to protons, which confirms the work of Baumann et al. [10]. Among such uncertainties are particle range uncertainties, patient setup errors, inter-fractional anatomy changes (e.g., weight loss, tumor shrinkage, etc.) and intra-fractional tumor motion. Additionally, TPS algorithms often have problems handling the air cavities and sharp density gradients present in the lung.
Using spherical geometries, we show that when 1) increasing the distance the beam travels through the lung tissue and/or when 2) reducing the PTV size, the effect of the beam-modulation increases. Both tendencies have been shown previously only for protons [9]. The latter effect fits the general knowledge that a good PTV coverage is more difficult to obtain for smaller PTVs when using broader BPs. For the non-modulated plans, the PTV coverage increases with an increasing depth, while for the modulated cases, the larger the depth of the target in the lung the larger the beam-modulation effect. This altogether yields the increasing relative difference with depth between the non-modulated and modulated dose distributions.
These trends were only partially confirmed for the patient cases. The systematic study on spherical target geometries represents a simplified scenario, while for patient cases there are many degrees of freedom and many further parameters in consideration, such as case-dependent planning parameters and much more complex patient geometries. The angle from which the beam comes might lead to a large change in the relative difference between modulated and nonmodulated dose distributions. Our conclusions are based on our limited number of planning cases, but in this work, a wider general test of the lung modulation model as well as the systematic study with spheres were prioritized.
The largest uncertainties in our model (and as an extension in any similar routine dealing with the lung modulation) lie in the parameters Pmod and
Another, less important, parameter in the model is the voxel length d. For beam angles running parallel to the CT axis d is trivially the voxel length in that direction whereas, for any other angles, it must be calculated. The effect on the lung modulation of the value of d was found to be not so dramatic and only important when the distance through the lung traveled by the particles is large. We recommend using the tested formula, given in this work as Eq. 2.
The specifically chosen example shown in Figure 10 might indicate that, in some rare planning cases, an inferior dose coverage of the PTV can actually be improved by the lung modulation effect, although, in the large majority of cases, not taking the lung modulation effect into consideration in treatment planning is a net disadvantage for the patients.
The mathematical model described in this work could, in theory, be built into other TPSs too. We note, although, that the “future” of implementing the lung modulation into a TPS lies within MC codes when these will be coupled to treatment planning in a more general way. MC codes allow for on-the-fly modulation of the voxels during the actual treatment planning process and not by recomputing the dose on many different modulated CTs, followed by summing up the dose distribution to estimate the modulation effect. However, even with MC available, for the case that a deterministic TPS mode would still be opted for—for instance to calculate biologically effective dose with the Linear Effect Model (LEM) [14, 28]—the concept presented in this work is an appropriate option for recalculation of treatment plans and for assessment of the lung modulation effect. For carbon ion therapy, the authors estimate that TPS with deterministic pencil algorithms are assumed to remain still in clinical use in the next years. Additionally, deterministic TPS programs, like TRiP98 and matRad [11], will play an important role for educational purposes.
Conclusion
With existing standard tools, it is possible in a transparent and reproducible way, to implement and calculate the beam-modulation effect of the lung in a known TPS for particles. Our evaluation of two selected lung cancer patients is in line with previous results. For protons, the lung modulation effect is found to be negligible compared to other dose delivery uncertainties related to particle therapy treatments of the lung. For carbon ions, the effect is significantly more pronounced and cannot be ignored. The decrease in both PTV coverage and dose homogeneneity, caused by the modulation effect, could lead to underdosage within the PTV and to overdosage in the healthy normal tissue surrounding the PTV. Planning parameters and beam angles also have an impact on the relative difference between nonmodulated dose distributions and those taking the beam-modulation effect into account, caused by the porous nature of lung tissue.
Data Availability Statement
The original contributions presented in the study are included in the article, further inquiries can be directed to the corresponding author.
Ethics Statement
Ethical review and approval was not required for the study on human participants in accordance with the local legislation and institutional requirements. Written informed consent from the participants was not required to participate in this study in accordance with the national legislation and the institutional requirements.
Author Contributions
UW devised the project, the main conceptual ideas and project outline. TR, AS, KZ, and UW further developed the project with AS and KZ supervising the work and providing financial support. TR, LG, and NB developed the software tools for the manuscript, based on a mathematical model developed by UW. TR performed the computations, the data gathering and the data analysis. TR and AS created the images and graphs. KB, VF, and RE provided the patient data. TR wrote the manuscript with input from all authors.
Funding
The authors TR and AS acknowledge the financial support of the German fund for research “Deutsche Forschungsgemeinschaft” (DFG), case number SA 3085/1-1, Granted to AS. The study was also performed in the frame of FAIR Phase-0 supported by the GSI Helmholtzzentrum für Schwerionenforschung in Darmstadt (Germany).
Conflict of Interest
The authors declare that the research was conducted in the absence of any commercial or financial relationships that could be considered as a potential conflict of interest.
Acknowledgments
The authors acknowledge the access to TRiP98, provided by M. Krämer and the GSI, and the cluster time at the PLGRID infrastructure in Krakow under Grant Number ccbmc7. The authors Ringbæk and Santiago acknowledge the support of M. Stuschke and S. Qamhiyeh from the Radiotherapy Department at Essen University Hospital. We thank Michelle Lis (GSI) for the linguistic improvement of the manuscript.
References
1. Haberer T, Becher W, Schardt D, Kraft G. Magnetic scanning system for heavy ion therapy. Nucl Instrum Methods Phys Res Sect A Accel Spectrom Detect Assoc Equip (1993). 330:296. doi:10.1016/0168-9002(93)91335-k
2. Lomax AJ, Bortfeld T, Goitein G, Debus J, Dykstra C, Tercier P-A, et al. . Treatment planning inter-comparison of proton and intensity modulated photon radiotherapy. Radiother Oncol (1999). 51:257–71. doi:10.1016/s0167-8140(99)00036-5
3. Coucke GO, Titt U, Mirkovic D, Mohan R. Density heterogeneities and the influence of multiple Coulomb and nuclear scatterings on the Bragg peak distal edge of proton therapy beams. Phys Med Biol (2008). 53:4605–19. doi:10.1088/0031-9155/53/17/010
4. Ringbæk TP, Simeonov Y, Witt M, Cabillic-Engenhart R, Kraft G, Zink K, et al. . Modulation power of porous materials and usage as ripple filter in particle therapy. Phys Med Biol (2017). 62:2892–909. doi:10.1088/1361-6560/aa5c28
5. Titt U, Sell M, Unkelbach J, Bangert M, Mirkovic D, Oelfke U, et al. . Degradation of proton depth dose distributions attributable to microstructures in lung‐equivalent material. Med Phys (2015). 42:6425–32. doi:10.1118/1.4932625
6. Mohan K-S, Witt M, Weber U, Engenhart-Cabillic R, Zink K. An efficient method to predict and include Bragg curve degradation due to lung-equivalent materials in Monte Carlo codes by applying a density modulation. Phys Med Biol (2017). 62:3997–4016. doi:10.1088/1361-6560/aa641f.
7. Espana M, Paganetti H. Uncertainties in planned dose due to the limited voxel size of the planning ct when treating lung tumors with proton therapy. Phys Med Biol (2011). 56:3472–56. doi:10.1088/0031-9155/56/13/007.
8. Witt M, Weber U, Simeonov Y, Zink K. SU-E-T-671: range-modulation effects of carbon ion beams in lung tissue. Med Phys (2015). 42:3491. doi:10.1118/1.4925034.
9. Flatten V, Baumann K, Weber U, Engenhart-Cabillic R, Zink K. Quantification of the dependencies of the Bragg peak degradation due to lung tissue in proton therapy on a ct-based lung tumor phantom. Phys Med Biol (2019). 64:155005. doi:10.1088/1361-6560/ab2611
10. Baumann K, Flatten V, Weber U, Lautenschläger S, Eberle F, Zink K, et al. . Effects of the Bragg peak degradation due to lung tissue in proton therapy of lung cancer patients. Radiat Oncol (2019). 14:155005. doi:10.1186/s13014-019-1375-0. |
11. Winter J, Ellerbrock M, Jäkel O, Greilich S, Bangert M. Analytical modeling of depth-dose degradation in heterogeneous lung tissue for intensity-modulated proton therapy planning. Phys Imaging Radiat Oncol (2020). 14:32–8. doi:10.1016/j.phro.2020.05.001.
12. Wieser H-P, Cisternas E, Wahl N, Ulrich S, Stadler A, Mescher H, et al. . Development of the open-source dose calculation and optimization toolkit matrad. Med Phys (2017). 44:2556–68. doi:10.1002/mp.12251.
13. Müller M, Jäkel O, Haberer T, Kraft G, Schardt D, Weber U. Treatment planning for heavy-ion radiotherapy: physical beam model and dose optimization. Phys Med Biol (2000). 45:3299–317. doi:10.1088/0031-9155/45/11/313.
14. Krämer M, Scholz M. Treatment planning for heavy-ion radiotherapy: calculation and optimization of biologically effective dose. Phys Med Biol (2000). 45:3319–30. doi:10.1088/0031-9155/45/11/314.
15. Krämer M, Durante M. Ion beam transport calculations and treatment plans in particle therapy. Eur Phys J D (2010). 60:195–202. doi:10.1140/epjd/e2010-00077-8.
16. Dreher C, Habermehl D, Ecker S, Brons S, El-Shafie R, Jäkel O, et al. . Optimization of carbon ion and proton treatment plans using the raster-scanning technique for patients with unresectable pancreatic cancer. Radiother Oncol (2015). 10:850–860. doi:10.1186/s13014-015-0538-x.
17. Toftegaard J, Petersen JP, Bassler N. PyTRiP—a toolbox and gui for the proton/ion therapy planning system trip. J Phys: Conf Ser (2014). 489:012045. doi:10.1088/1742-6596/489/1/012045.
18. Ringbæk TP, Weber U, Santiago A, Iancu G, Wittig A, Grzanka L, et al. . Validation of new 2d ripple filters in proton treatments of spherical geometries and non-small cell lung carcinoma cases. Phys Med Biol (2018). 62:245020. doi:10.1088/1361-6560/aaede9
19. Ringbæk TP, Weber U, Santiago A, Simeonov Y, Fritz P, Krämer M, et al. . Dosimetric comparisons of carbon ion treatment plans for 1d and 2d ripple filters with variable thicknesses. Phys Med Biol (2016). 61:4327. doi:10.1088/0031-9155/61/11/4327
20. Bassler N, Hansen DC, Lühr A, Thomsen B, Petersen JP, Sobolevsky N. SHIELD-HIT12A—a Monte Carlo particle transport program for ion therapy research. J Phys Conf (2014). 489:012004. doi:10.1088/1742-6596/489/1/012004
23.[Dataset]MK. Trip98 online manual. Available from: http://bio.gsi.de/DOCS/trip98.html (2009).
24. Schneider W, Bortfeld T, Schlegel W. Correlation between CT numbers and tissue parameters needed for Monte Carlo simulations of clinical dose distributions. Phys Med Biol (2000). 45:459–78. doi:10.1088/0031-9155/45/2/314.
25.Journal of the ICRU prescribing, recording and reporting proton-beam therapy (2007). Technical Report, Bethesda, MA: International Comission on Radiation Units and Measurements. Vol 7 No 2 (2007). Report 78.
26. Schlegel U, Kraft G. Design and construction of a ripple filter for a smoothed depth dose distribution in conformal particle therapy. Phys Med Biol (1999). 44:2765–75. doi:10.1088/0031-9155/44/11/306.
27. Gemmel A, Hasch B, Ellerbrock M, Weyrather WK, Krämer M. Biological dose optimization with multiple ion fields. Phys Med Biol (2008). 53:6991–7012. doi:10.1088/0031-9155/53/23/022.
Keywords: ion beam therapy, particle therapy, proton therapy, lung cancer, treatment planning, pencil beam scanning
Citation: Ringbæk TP, Santiago A, Grzanka L, Baumann K, Flatten V, Engenhart-Cabillic R, Bassler N, Zink K and Weber U (2020) Calculation of the Beam-Modulation Effect of the Lung in Carbon Ion and Proton Therapy With Deterministic Pencil Beam Algorithms. Front. Phys. 8:568176. doi: 10.3389/fphy.2020.568176
Received: 31 May 2020; Accepted: 14 October 2020;
Published: 18 November 2020.
Edited by:
Yolanda Prezado, INSERM U1021 Signalisation normale et pathologique de l’embryon aux thérapies innovantes des cancers, FranceReviewed by:
Kevin Souris, Catholic University of Louvain, BelgiumUrszula Jelen, Ingham Institute of Applied Medical Research, Australia
Copyright © 2020 Ringbaek, Santiago, Grzanka, Baumann, Flatten, Engenhart-Cabillic, Bassler, Zink and Weber. This is an open-access article distributed under the terms of the Creative Commons Attribution License (CC BY). The use, distribution or reproduction in other forums is permitted, provided the original author(s) and the copyright owner(s) are credited and that the original publication in this journal is cited, in accordance with accepted academic practice. No use, distribution or reproduction is permitted which does not comply with these terms.
*Correspondence: Uli Weber, VS5XZWJlckBnc2kuZGU=