- 1School of Resource, Environment and Safety Engineering, Hunan University of Science and Technology, Xiangtan, China
- 2School of Civil Engineering, Guizhou University, Guizhou, China
Acidic fluids will cause rock erosion and further endanger the safety of rock engineering. To explore the aging characteristics of the mechanical damage under acid condition, diorite specimens were saturated in neutral water and acid solutions with pH values of 3 and 5 for 49 days. The masses and sizes of the specimens and the pH values of the acidic solution were tracked and measured. Besides, the specimens before and after saturations were observed by an electron microscope scanner. Meanwhile, triaxial compression tests were carried out under neutral water, pH = 5 and pH = 3 hydrochloric acid solutions, respectively. The mass damage features and mechanical properties of diorite specimens saturated in solutions with different pH values were analyzed. The results show: 1) after acidic saturation, the original lamellar structures and crystal forms were spongy or flocculent. The structure loosened and the boundary between layers became fuzzy. Meanwhile, the number of micro-cracks and micro-pores increased, which weakened the macro-mechanical performances of diorite; 2) the acid condition with pH value of 3 could be used to simulate the long-term effect of the weakly acidic environment in nature; 3) internal friction angle of diorite was more sensitive to acidic solutions than its cohesion; 4) at the initial stage of saturation, diorite broke rapidly. With increasing saturation time, the damage rate slowed down and finally stabilized. The established damage strength model considering acidification could properly describe the test results.
Introduction
The mechanical properties of rock masses could be affected by water erosion [1–3]. Moreover, the differences in water fluid chemicals significantly affect their mechanical properties and chemical composition [4–7]. Compared with distilled water, water chemical fluids produce more intense latent erosion and molten corrosion, resulting in the overall deterioration and the destruction of the micro-mechanical structure of the rock mass [8–10]. Subsurface rock mass is subject to groundwater erosion and thawing. Therefore, the mechanical properties of rock mass are easily influenced by the external conditions [11–15]. Meanwhile, in various water-related rock engineering constructions, such as dam foundation, slope, tunnel, and underground mining, it is important to understand the influence of water erosion on the characteristics of the bearing capacity and deformation of the structure [11, 12, 16, 17].
Atkinson et al. [12] and Dunning et al. [14] used distilled water, inorganic water chemical solution, and organic solution to research the effects of different water chemical solutions on the fracture development of single-crystal quartz and glass. Rebinder et al. [15] analyzed the influence of the water chemical environment on the mechanical properties of rock mass based on the Griffith strength theory. Karfakis et al. [18] performed tensile tests on rocks saturated in different water chemical solutions and analyzed the influence of different chemical solutions on the fracture toughness. Feucht et al. [19] conducted triaxial compression tests on prefabricated sandstone specimens in NaCl, CaCl2, and Na2SO4 solutions. They further discussed the effects of different water chemical solutions on the friction factors of the sandstone crack surfaces. Hutchinson et al. [20] and Heggheim et al. [21] used HCl, H2SO4 and other diluted solutions to simulate acid rain. Then, they measured the effect on the determination of the mechanical parameters of limestone and the damage mechanism. Moreover, the corrosion resistance and corrosion mechanism of different types of cement mortar were studied comprehensively. It is found that the deterioration of samples of cementing materials under acid rain erosion is mainly due to the coupling effect of H+ and SO42−. Meanwhile, it leads to the increase of porosity and the loss of weight and strength of cementing materials [22, 23]. Brzesowsky et al. [24] investigated the coupling effect of the hydrochemical environment and the stress state on the creep characteristics of sandstone under compression. Moreover, by changing particle sizes in the rock sample, the time-dependent effect of water chemical environment on rock particle destruction was proposed. Liu et al. [25] studied the effects of hydrochemical solutions on the mechanical parameters of sandstone. In the works of Tang et al. [26–29], the mechanism and quantification method of rock hydrochemical damage were systematically discussed. Ding et al. [30, 31] analyzed the damaging effect of the water chemical solution on the macro and microstructures of limestone. Furthermore, they quantified the law of water chemical damage on its mechanical properties. Chen et al. [32–34] performed uniaxial and triaxial compression tests on sandstone, granite, and limestone specimens in various solutions. As a consequence, the dynamic parameters of rocks affected by corrosion were obtained by applying computed tomography scanning. According to the fracture characteristics and evolution law, a chemical damage constitutive model was established. Using various flow rates and pH values, Miao et al. [35, 36] performed uniaxial compression, triaxial compression and splitting tests on the dry granite specimens and corroded ones. They further analyzed the strength evolution, deformation characteristics and response mechanism of mechanical parameters in acidic environment. Besides, they observed the characteristics of mass damage and pH changes of acidic solution during the process, and then examined the ion chromatographic detection of chemical components and concentrations of the solution after saturation. By using scanning electron microscopy (SEM) and electronic energy spectroscopy, they also discussed the aging features of acidic chemical solution on the macrophysical properties [12, 18, 37].
The previous researches mainly focus on the hydrophysical and hydrochemical effects on the macro-mechanical properties of rocks. Nonetheless, the researches on the mechanism of rock chemical damage based on the effects of water and rock microscopic effect are still relatively scarce [38–41]. Water-rock chemical action has a great influence on the deterioration of rock micro-mechanical structure, and also affects the macro-mechanical properties [42–44]. Besides, quantitative studies on the hydrochemical damage of rocks have emerged. But researches on the damage effects of water-rock chemistry on the mechanical properties of rock mass have been rarely reported [45, 46]. Therefore, the researches on damage, strength and failure modes of rocks in acidic environments are urgent. Based on the above-mentioned tests, the hydrogeological survey of Copper-Iron mine in Qianchang County, Anhui Province was carried out. Through investigation, weak acid groundwater was found to be in this mine area, where the surrounding rocks of diorite are damaged by the groundwater erosion for a long time. Therefore, this paper intends to take the diorite rock in this mine area as the research object, simulate the groundwater erosion environment, conduct immersion on the diorite rock, SEM observations and triaxial compressive strength (TCS) tests were performed on diorite specimens before and after saturations with pH values of 3, 5, and 7 for 49 days. Furthermore, the effect of natural long-term acidity condition on the time-dependent characteristics of rock damage was studied and a damage strength model was established.
Laboratory Tests
Preparation of Rock Specimens
Diorite was taken from Line 10 in the middle -300 section of Qianchang Copper–Iron Mine in Anhui Province, China. Following the standards of the International Society for Rock Mechanics [47, 48], the specimens were first processed into a cylinder with a diameter of 50 mm and a height of 100 mm for TCS tests. Meanwhile, due to the size of the SEM observation platform, the standard specimen was further processed into three small specimens with a diameter of 50 mm and a height of 25 mm. Three different pH values of 3, 5, and 7 were used to simulate the different subsurface acidic environments, respectively.
Test pieces were inserted into the preservation boxes containing the hydrochloric acid solution. During saturation process, the pH value of the solution in each box was measured and recorded.
Experiment Content and Test Method
To observe the mechanical properties of diorite before and after the acidification treatment, SEM observations and TCS tests were performed (see Supplementary Figure S1).
Scanning Electron Microscopy Observation
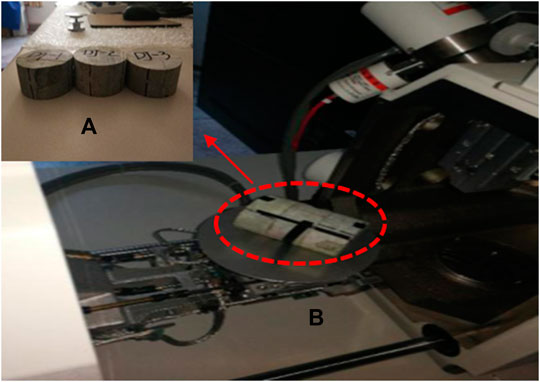
The SEM observations were performed four times. DJ-1 was scanned before and after saturation in distilled water for 49 days. DJ-2 and DJ-3 were scanned after saturation in acid solutions with pH values of 3 and 5 for the same time, respectively (Figure 1A). The sample surfaces were scanned with a magnification coefficient of 400–450 (Figure 1B).
Triaxial Compressive Strength Experiment
The TCS tests were performed on RMT-150C with confining stresses (σ3) of 10, 20, and 30 MPa. The axial and lateral loading rates were 0.1 KN/s and 0.2 MPa/s, respectively. The stress-strain curves were recorded during the test. Besides, the damaged specimen was photographed for later reference (see Supplementary Figure S2).
Chemical Damage Analysis
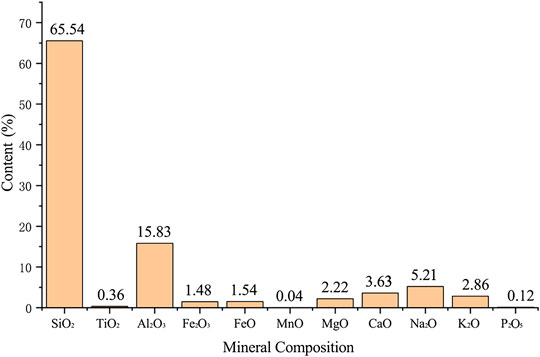
The main component of diorite in the Qianchang copper-iron area is oxidized minerals (Figure 2). Under acidic solution, the oxidized mineral components in diorite will react with H+ as follows:
Rock Surface Characteristics After Acidification
The main changes of the specimen surface after saturation in a hydrochemical solution are reflected in macro and micro aspects [8, 49–51].
Diorite samples were smooth after coring, cutting, and grinding. Macroscopic viewing also suggests that the samples were uniformly dense and flat before acid saturation (Figure 3A). After saturation for 49 days in acidic solutions with pH = 3 and pH = 5, powders were stripped from the surface of the rock samples. While the powders were rinsed, the outer surface became rough and some micro-cracks appear (Figure 3C). After long-term saturation, the outer surface was dissolved, and the color turned slightly gray. There were severe unevennesses on the surface under acid solution of pH = 3 (Figure 3D). However, after saturation in distilled water, no obvious macro changes were observed, except for a lighter surface (Figure 3B). It suggests that the chemical damage negatively relates to the pH value. The macro comparison of the representative test specimens after saturation for 49 days is shown in Figure 3.
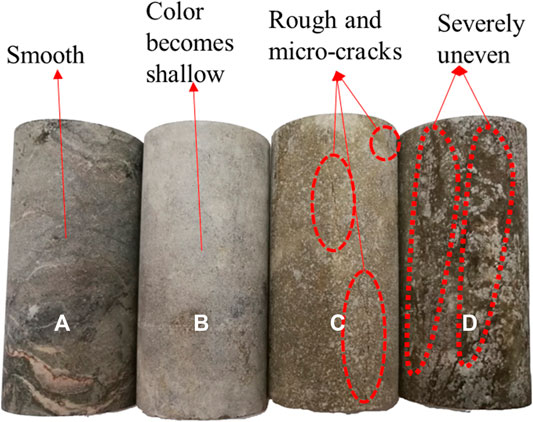
FIGURE 3. Macro comparison of sample surfaces after different saturations: (A) naturally dry condition, (B) pH = 7, (C) pH = 5, and (D) pH = 3.
Microscopically, according to the scanning electron micrographs in Figure 4A, the rock sample showed a clear layered structure or flaky crystal form before saturation, with superior homogeneity, tight internal structure, small interlayer distance, and micro-cracks. The micropore was small and dispersed. The microstructure consisted of homogeneous and dense particles, fine and sparse pores, indicating the positive macro mechanical properties before acidification and erosion.
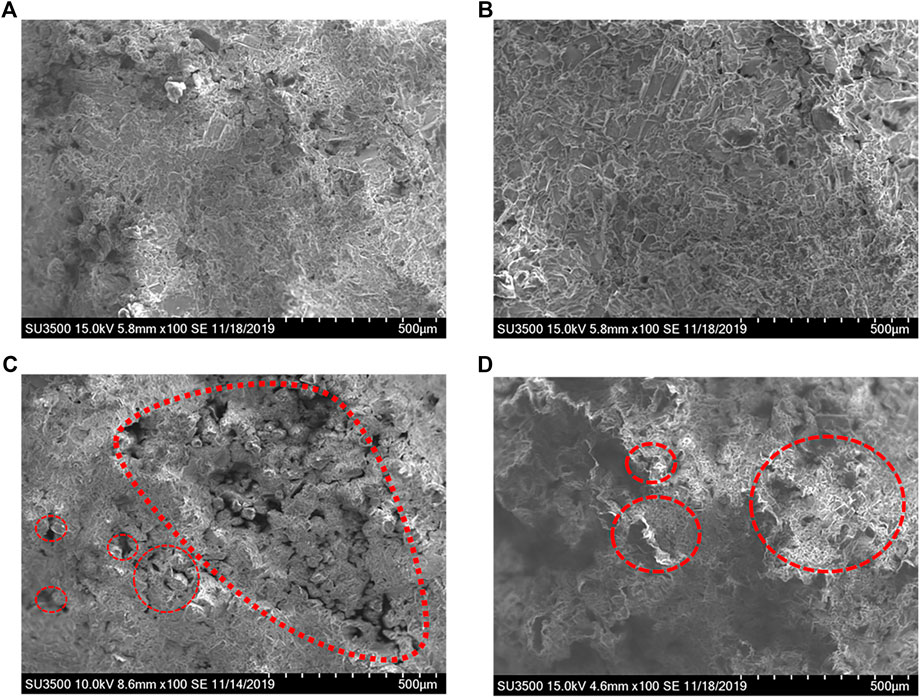
FIGURE 4. Scanning electron microscopy of diorite surfaces after different saturations: (A) naturally dry condition, (B) pH = 7, (C) pH = 5, and (D) pH = 3.
However, the specimens saturated in acidic solutions exhibited a spongy or flocculent structure. The structure was loosened, and the boundary between layers became blurred (Figures 4C, D). The number of micro-fissures and micro-pores increased, and some independent small-sized micro-pores were dispersively interconnected with each other to form a larger “gully” (Figure 4C). In comparison, more powders were shed and the edges were the more distinct at pH = 3 (Figure 4D). After saturation in distilled water, the microscopic morphology did not change obviously (Figure 4B). Clearly, the decrease in pH value accelerated the chemical damage.
Mass Damage After Acidification
After saturation for 49 days, the surfaces of the rock samples were rinsed with distilled water, dried, and measured. Compared with the rock sample mass before saturation, the mass decreased by various degrees with different pH values. However, the masses after dipping in distilled water were basically the same as the ones before saturations. Five samples were randomly selected from the three groups. Comparisons between the mass before and after saturations with different pH values are shown in Figure 5.
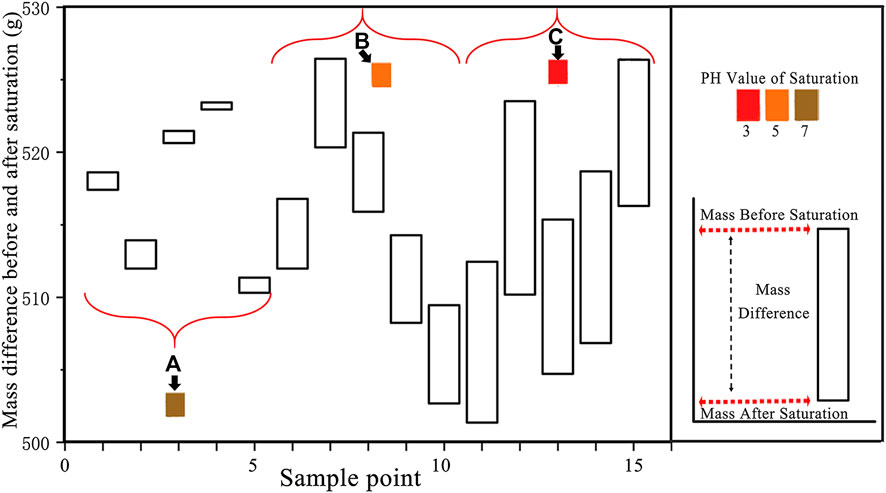
FIGURE 5. Comparison of mass differences before and after different saturations: (A) rock samples soaked with distilled water, (B) rock samples under pH = 5 acidic saturation, and (C) rock samples under pH = 3 acidic saturation.
The stronger and faster reaction was caused by the higher concentration of H+ in the solution [52, 53]. It can be further concluded that stronger acidity led to the destruction of more micro-structures. As shown in Figure 5, the mass was slightly diminished after saturated in distilled water. It proves the existence of water-soluble mineral components. To quantitatively characterize the degree of mass damage after saturation, a time-dependent mass damage factor D(t) is defined:
Where M0 is the mass of the rock sample before saturation, and M(t) is the mass at t days during saturation.
The mass damage factors of the samples saturated for 49 days at pH = 3 and pH = 5 are presented in Figure 6. Relatively speaking, the change in distilled water is not obvious. Thus, the factors are not provided here.
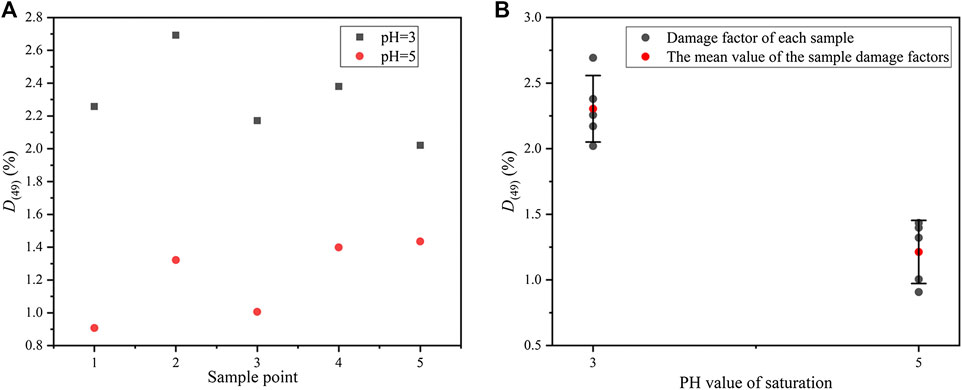
FIGURE 6. Mass damage factors of rock samples after different acidic saturations for 49 days: (A) damage factor of each sample, and (B) error bars of damage factors.
Figure 6A shows that the mass damage factors at pH = 3 are higher than pH = 5. The average value of the factors at pH = 3 is 2.30%, while which at pH = 5 is 1.21% (see Figure 6B). Obviously, the latter is almost half of the former. Under the two actions, the standard deviations are almost the same. The standard deviation is 0.25 at pH = 3 and 0.24 at pH = 5. Hence, the comparison between the two is reliable. In conclusion, during the same time of saturation, lower pH value will strengthen the reaction, leading to larger mass damage and corrosion.
Laboratory Results and Discussion
Calculation of Time Scale
The time scale refers to the ratio of the amount of H+ substances consumed per unit time for two solutions with different initial pH values [52, 54]. Assuming that under a strongly acidic solution, the amount of H+ substances consumed per unit time is ∆n1, and that in weak acid is ∆n2, the time scale ƞ(t) of two different acidic solutions can be defined as:
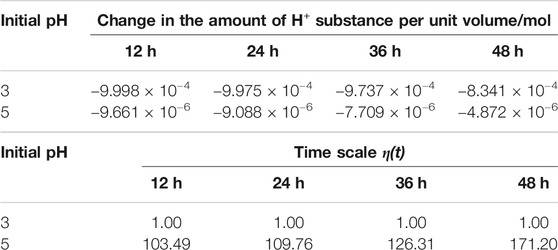
Theoretically, the time scale η(t) is a variable with the selected period. Due to the limitations of the laboratory, it is impossible to accurately determine the amount of H+ substances at any time during saturation process. In this paper, the unit time is set as 12 h to calculate the time scale. Table 1 lists the changes in the amount of H+ substances under the two acidic solutions. Thus, the calculated results are provided in Table 1.
According to Table 1, the consumption of H+ shows a decreasing trend, indicating that the reaction gradually slows down. In the first 12 h, the consumption of H+ in the acidic solution with initial pH = 3 is 103.49 times as much as the initial pH = 5 (see Table 1). The time scale reflects the chemical damage caused by the two acidic solutions. Thus, in the first 12 h, the solution of pH = 3 causes 103.49 times the damage compared to that of pH = 5. Similarly, based on the change of H+ per unit time, the time scale of chemical damage caused by two different acidic solutions can be calculated at any period. The characteristics of the solution with pH = 5 is close to the natural environment. Through the conversion of the time scale, saturation under pH = 3 could be tried to simulate the long-term effect caused by natural environment in a short time, which may shed some lights on predicting the durability of rock masses in nature.
Characteristics of pH Change During Acidification
As mentioned above, the pH value of the acidic solution plays an important role in the corrosion of diorite. The change of pH value can directly reflect the reaction rate and degree. In the tests, the pH value was measured every 12 h. To maintain the initial concentrations (pH = 3 and 5), concentrated hydrochloric acid was added dropwise via plastic dropper. The rock sample and the acidic solution reacts violently at the beginning (see Figures 7A, C). Meanwhile, the pH value increases significantly, which is close to neutral. Hence, it shows that the H+ ions in the two solutions have almost been consumed. As saturation time increases, the pH values gradually decrease. Besides, the two decline rates continuously decrease, while the decline rate with pH = 3 is faster than that with pH = 5. Lastly, the pH of the initial solution with pH = 3 starts to stabilize slowly on the 29th day (the 58th measurement) (see Figure 7D), and the pH is slightly higher than 3. Thus, the reaction proceeds slowly after the 29th day, but it does not indicate the end. When the minerals on the outer surface have been dissolved, the internal structure may fail to display signs of reaction due to the tight structure arrangement. In contrast, the pH of the initial solution of pH = 5 gradually stabilizes on the 32nd day (64th measurement) (see Figure 7B). However, the corresponding pH is greater than 5, indicating that the reaction has changed from the 32nd day. Change of the pH value in distilled water is minimal. It indicates that no obvious chemical reaction has occurred. Therefore, its curve over time is not provided.
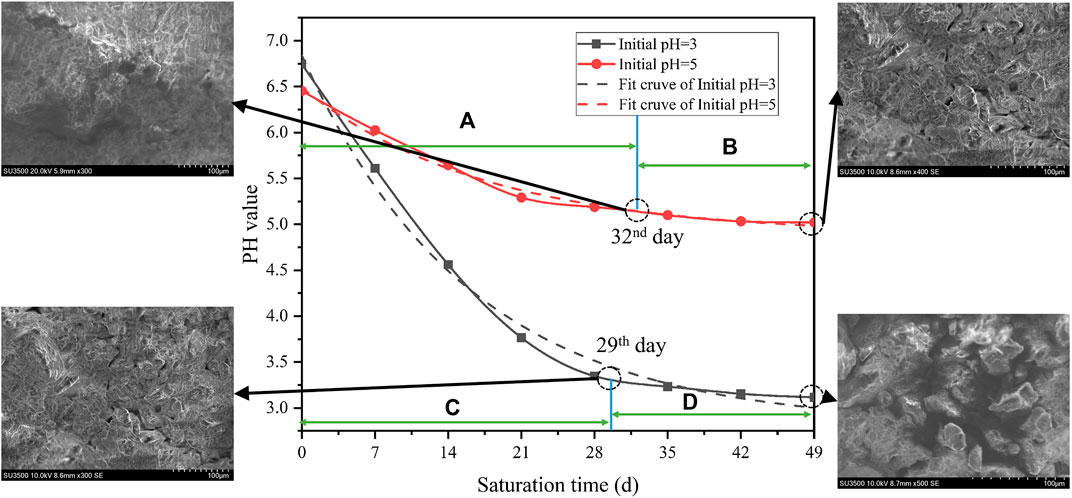
FIGURE 7. Aging characteristics of pH values of acidic solution during saturations: (A) violent stage during acidification reaction under saturation (pH = 5), (B) stable stage during acidification reaction under saturation (pH = 5), (C) violent stage during acidification reaction under saturation (pH = 3), and (D) stable stage during acidification reaction under saturation (pH = 3).
According to Figure 7, the time-dependent pH value at initial pH = 3 is:
The time-dependent pH value at initial pH = 5 is:
The time-varying characteristics indicate that lower pH value leads to faster corrosion. Thus, severer corrosion is caused by a lower pH value. This further verifies the time scale principle that the reaction speed can be accelerated by increasing the reactant concentration.
Aging Characteristics of Mass Damage During Acidification
The test pieces were taken out from the solution and placed in an indoor ventilation environment for 24 h. Then, the mass measurement was performed after the test pieces were completely dried. Samples were randomly selected from the acidic solutions of pH = 3 and pH = 5. The results show that after different acidic saturations, the masses of the samples decreases to various degrees. Besides, the decreasing rate gradually slows down. To characterize the relationship between mass damage and saturation time, the time-dependent characteristic curves of mass damage are calculated and plotted (see Figure 8A).
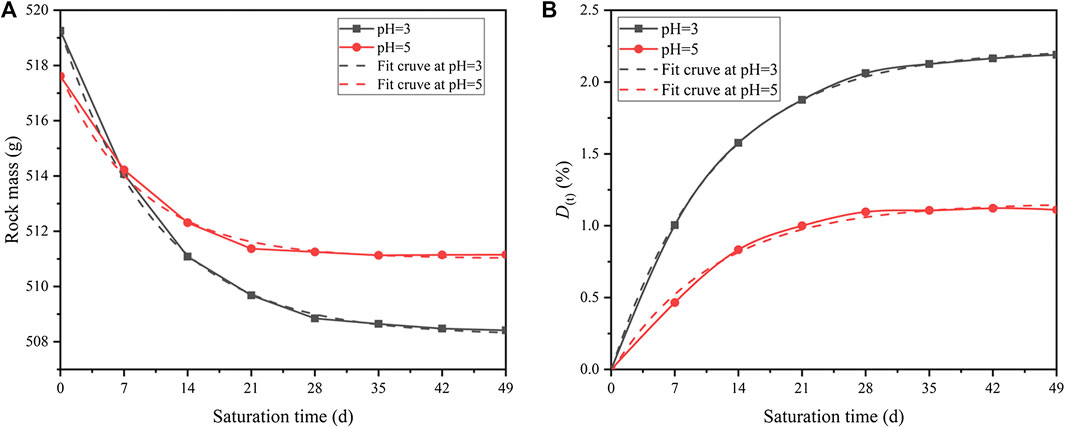
FIGURE 8. Aging curves of mass damage during different saturations: (A) rock mass, and (B) rock mass damage factor.
Where the time-dependent mass M(t) is defined. According to Figure 8A, the fitted curve of M(t) at condition of pH = 3 is:
The fitted curve of M(t) under solution of pH = 5 is:
According to Figure 8B, the fitted curve of D(t) at condition of pH = 3 is:
The fitted curve of D(t) under solution of pH = 5 is:
Thus, the decreasing rate of D(t) at condition of pH = 3 is:
The decreasing rate of D(t) under solution of pH = 5 is:
With increasing saturation time, the cumulative damage of the mass gradually increases and finally stabilizes (see Figure 8B). According to Eqs 13 and 14, the mass damage factors will gradually decrease and eventually reach zero. Comparing the characteristics of the damage caused by two acidic solutions, lower pH will produce larger mass damage during the same saturation time (see Eqs 15 and 16). This trend is similar to the change of pH values and agrees well with the results from the perspective of chemical kinetic principles.
Mechanical Damage Characteristics During Acidification
Effect of Acidification Time on the Strength and Deformation
To simulate the long-term corrosion induced by weakly acidic groundwater and the actual confining pressure, test results for rock samples at pH = 3 and σ3 = 10 MPa are further provided.
According to Figure 9, the stress–strain curves of pH = 3 under triaxial compression (σ3 = 10 MPa) have obvious stepwise trends. Four obvious stages can be observed: (A) initial crack compaction stage (Figure 9A), (B) elastic deformation to stable micro-elastic crack development stage (Figure 9B), (C) unstable crack development stage (Figure 9C), and (D) post-fracture stage (Figure 9D). However, as saturation time increases, stress-strain curves exhibit different characteristics.
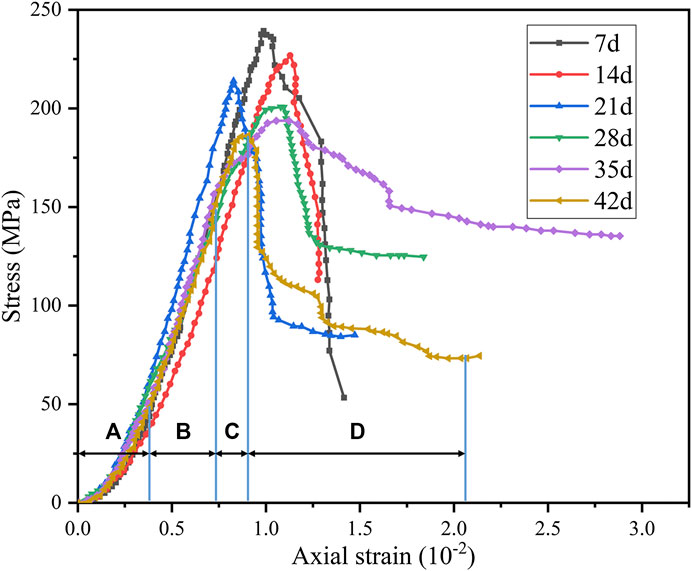
FIGURE 9. Stress–strain curves for different saturated periods under triaxial compression (σ3 = 10 MPa, pH = 3): (A) initial crack compaction stage, (B) elastic deformation to stable micro-elastic crack development stage, (C) unstable crack development stage, and (D) post-fracture stage.
At the initial crack compaction stage, the degree of concavity on the curve gradually increases, indicating that samples will produce more micro-fissures. At the elastic deformation to stable micro-elastic crack development stage, the slope of the curve gradually decreases, indicating that the elastic modulus will also gradually decrease. In the unstable crack development stage, the peak stress drops significantly with time. Besides, in the post-fracture stage, the deformation after peak stress gradually increases with time. This shows that diorite has a tendency to change from brittle to ductile after acid saturation. Besides, this tendency will become more obvious with longer saturation time.
To quantify the damage aging characteristics of compressive strength during saturation, the compressive strength damage Q(t) [55–57] is introduced as:
where σt is the TCS of diorite samples after saturation (pH = 3 and σ3 = 10 Mpa) for t days. σ0 represents the TCS of diorite in the natural dry state (σ3 = 10 Mpa). The TCS damage is shown in Figure 10.
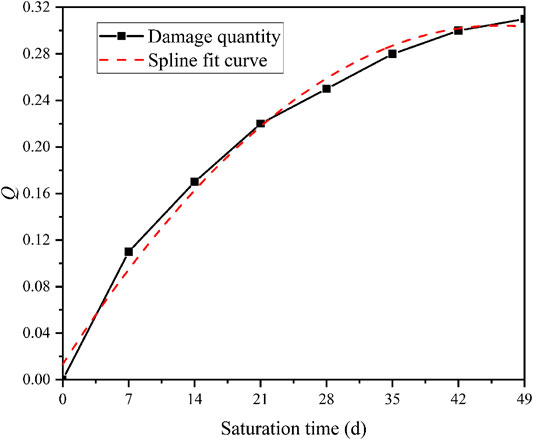
FIGURE 10. Variation curve of triaxial compressive strength damage of diorite with saturation time (σ3 = 10 MPa, pH = 3).
The equation of fitted curve is:
Hence, the damage rate q(t) can be defined as:
The TCS gradually decreases with time. Besides, the rate also gradually decreases. The maximum rate (4.18 MPa/d) occurs in the first 7 days. When saturation reaches 35 days, the TCS tends to be stable, which is consistent with the damage characteristics and the changes of the pH values. As the soluble matter on the surface dissolves, the reaction gradually slows down. So the mechanical damage weakens.
The TCS damage reflects time-dependent characteristics. As saturation time increases, the TCS damage of diorite gradually increases. However, the damage rate decrease slowly. After reaching a certain time (35 days), the damage gradually stabilizes. As shown in Eq. 18 the strength damage of diorite will reach 0.34 instead of developing continuously. This suggests that the mechanical damage mainly occurs at the fierce physical-chemical reaction. For rocks that are hard to be completely dissolved, the mechanical properties will not be affected at certain reaction point. This is of great significance for predicting the residual strength of rocks in acidic environments. After immersing granite samples with different pH values, Liu et al. [52] reached a similar conclusion through the uniaxial compression tests.
Parameter Damage Characteristics During Acidification
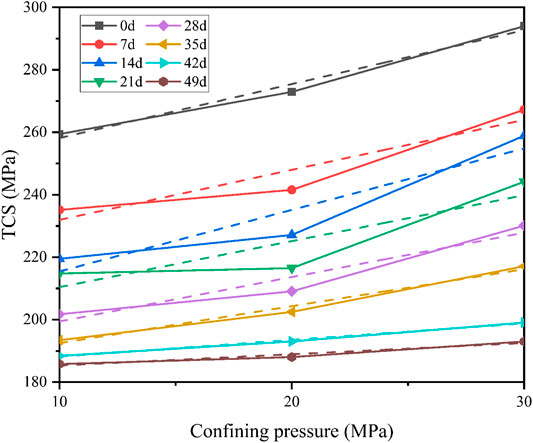
The cohesion (c) and internal friction angle (φ) values of rocks are two important physical and mechanical rock parameters [58–60]. Therefore, it is necessary to study the damage aging characteristics of the c and φ values during saturation process. The fitted curves of the TCS and confining pressure obtained at different saturation times are shown in Figure 11.
The c and φ values are calculated as:
where σ1 represents the TCS, PMAX is the axial load when the rock fails, and A represents the cross-sectional area of the specimen.
where σ3 is confining pressure, σ0 represents the intercept in the relationship between σ1 and σ3, and k represents the slope.
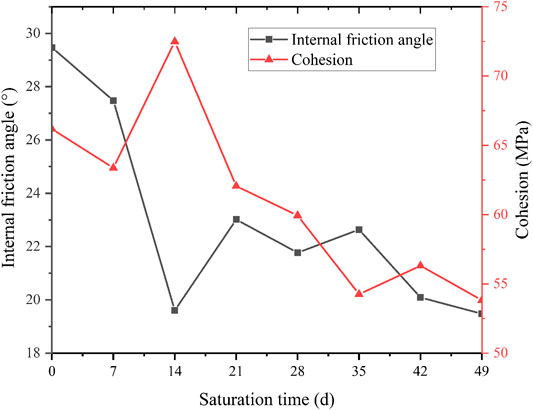
The calculation results are shown in Figure 12.
According to Figure 12, the c and φ values decrease with time. The φ values decrease significantly in the first 21 days after saturation, from the initial 29.4° to around 22.9°. The reduction rate reaches the maximum value of 2.17°/7 days. Then the φ values keep decreasing with a lower rate at around 0.875°/7 days. The c and φ values decrease by 41.9 and 59.7% in the first 21 days. The c values decrease first and then increase steadily. The average rate of c reduction is about 1 MPa/7 days. During the reaction, a stepwise trend could be observed for the development of φ. It is consistent with the trends of rock mass damage and pH value. The trend of φ can be seen as the cumulative effect of time, which suggests that the φ of diorite is more sensitive to acidic solutions than its c.
Mechanical Damage Model During Acidification
Calculation of Corrosion Depth of Diorite During Acidification
The sizes of the rock samples are measured after acidification with pH = 3. The average change of five random diameters with saturation time is shown in Figure 13A.
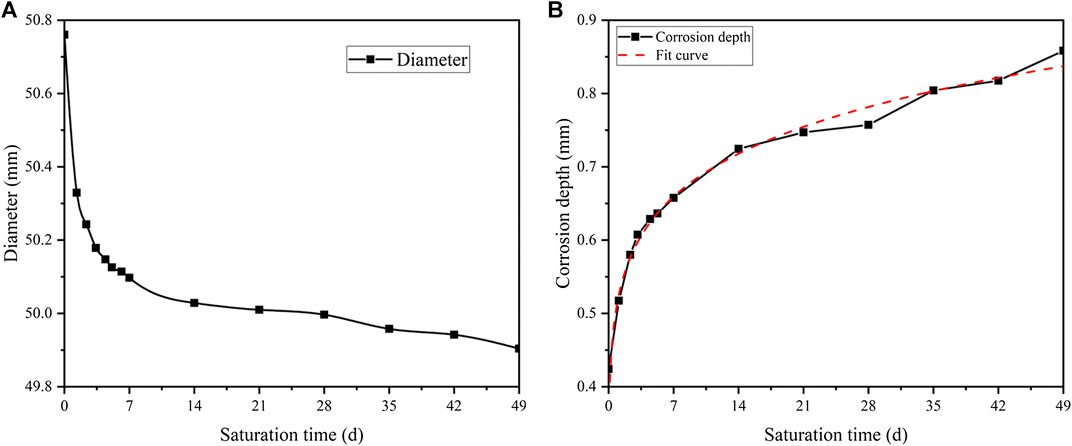
FIGURE 13. The average size change during saturation (pH = 3): (A) the changing curve of diameter of rock samples, and (B) the fitting curve of corrosion depth.
It can be seen that a dramatic decline in diameter occurs in the first 7 days. It is from 50.8 mm to around 50.1 mm. Then the trend immediately slows down with a minimal 0.2 mm reduction during the rest of acidification. This indicates that the rock sample reacts violently with the acidic solution at the initial stage. Besides, the intensity of the reaction slows down quickly with time.
To quantify the loss of diameter, a corrosion depth parameter is proposed as follows:
where d(t) refers to the diameter at t days, and d0 is the initial diameter. Therefore, the radius change is:
where ∇r(t) is the corrosion depth.
Based on the development of diameter, the development of corrosion depth is presented in Figure 13B. The function of the fitting curve is shown in Eq. 26.
Strength Damage Model of Diorite During Acidification
Before establishing the strength damage model of diorite during acidification, four hypotheses are given:
(1) Diorite specimen is a two-phase material consisting of rock matrix and pores.
(2) The strength of diorite specimen is proportional to its matrix bearing area and inversely proportional to its porosity.
(3) Diorite specimens can reduce matrix bearing area and increase porosity during acidification.
(4) The matrix bearing area could decrease and the porosity could increase during acidification.
The percentage of residual strength of diorite sample during acidification is:
where σ(t) is the compressive strength after saturation for t time and σ0 is the compressive strength in the natural dry state. Based on the hypothesis and theoretical derivation, Huo [61] obtained the relationship between residual strength percentage and porosity as follows:
where μ is the coefficient to be determined and ωp is the porosity. The increase in the corrosion depth by the acidic solution is the main reason for the growth of porosity [62]. The test piece has a height of 100 mm and a diameter of 50 mm. The corrosion depth of the test piece is ∇r(t). Therefore, the load-bearing area A(t) of the test piece is:
From Hypothesis (4), Eq. 29 could be produced as:
Where γ is the scale constant. Substituting Eq. 30 into Eq. 28 gives:
Substituting Eq. 26 into Eq. 31 gives:
In Eq. 32, α1 and α2 are test constants, which are larger than 0. When t is equal to 0, λ = 1. Hence, μ = 1. Equation 32 can be presented as:
Substituting Eq. 23 into Eq. 27, the formula of the rock’s strength over time during saturation in an acidic solution of pH = 3 is:
To verify the reliability of the established strength damage model (see Eq. 34), two groups of experimental data (σ3 = 10 MPa, pH = 3) are randomly selected to produce α1 = 0.124 and α2 = 0.032. Figure 14 shows the measured and calculated compressive strength of diorite specimen.
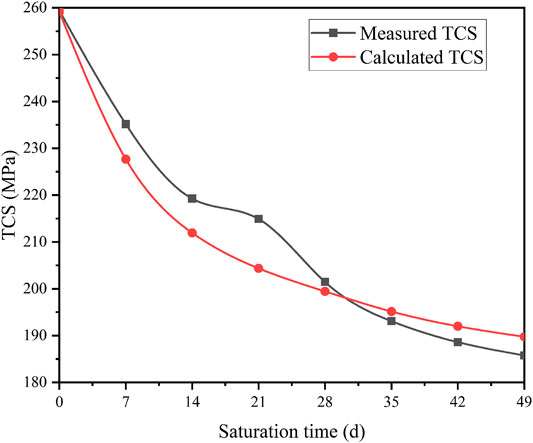
FIGURE 14. Measured and calculated values of triaxial compressive strength triaxial compressive strength (TCS) of diorite (σ3 = 10 MPa, pH = 3).
As can be seen from Figure 14, when σ3 = 10 MPa and pH = 3, the trends of the measured and calculated values of diorite’s compressive strength with time are roughly the same. In the initial stage of saturation, the strength damage range of diorite is relatively large and the damage rate is high. With the increase of saturation time, the intensity of the damage rate gradually slows down. By comparing the measured and calculated values of compressive strength, the aging model of diorite strength damage established based on the corrosion depth agrees well with the aging characteristics. Thus, the proposed model can be used to simulate residual triaxial compression strength of diorite in acidic environment.
Conclusions
In light of the above work, the main conclusions of this paper can be drawn as follows:
(1) Under the action of acidic chemical solutions, the microstructure of the amorphous particles changes, which causes damage to the physical properties and weakens the macro mechanical performances of diorite.
(2) Through the conversion of the time scale, saturation of pH = 3 can be used to simulate the long-term effect of the weakly acidic environment in a short period.
(3) As saturation time passes, the pH value of the two acidic solutions gradually decreases with decreasing rates. After reaching a certain time (29, 32 days), the pH values stabilize at higher values than the initial.
(4) When saturation time reaches 35 days (pH = 3), the TCS gradually levels. The cohesion (c) and internal friction angle (φ) tend to decrease with time. The change of φ shows a clear decreasing trend. The magnitude of change in c values is relatively gentle throughout saturation process. Therefore, the φ of diorite is more sensitive to acidic solutions than its c.
(5) The established model of diorite during saturation (σ3 = 10MPa, pH = 3) shows that in the initial stage, diorite experiences strong strength damage at a high rate. With the increase of saturation time, the intensity damage rate gradually decreases, which agrees well with the test results and provides guidance for practical calculation.
Data Availability Statement
The raw data supporting the conclusions of this article will be made available by the authors, without undue reservation.
Author Contributions
WC, WW, and YZ, methodology and funding acquisition; SX, software; ZD and XW, data curation and formal analysis; BJ, visualization; and SL, supervision. All authors have read and agreed to the published version of the manuscript.
Funding
This research was funded by the National Natural Science Foundation of China (Grant nos 51774132, 51774131, 51974118, and 51904101) and the Natural Science Foundation of Hunan Province (Grant no. 2020JJ5188).
Conflict of Interest
The authors declare that the research was conducted in the absence of any commercial or financial relationships that could be construed as a potential conflict of interest.
Acknowledgments
We thank Longjun Dong, Xiaofan Wu, Jie Liu, Wenhao Li, Wenbing Peng, and Qiuhong Wu for useful discussions and early contributions to the project as well as the reviewers for very helpful and inspiring comments.
Supplementary Material
The Supplementary Material for this article can be found online at: https://www.frontiersin.org/articles/10.3389/fphy.2020.553643/full#supplementary-material
References
1. Wu Q, Weng L, Zhao Y, Zhao F, Peng W, Zhang S. Deformation and cracking characteristics of ring-shaped granite with inclusion under diametrical compression. Arab. J. Geosci (2020) 13(14):681. doi:10.1007.s12517-020-05718-8
2. Dong L, Sun D, Shu W, Li X. Exploration: safe and clean mining on earth and asteroids. J Clean Prod (2020) 257:120899. doi:10.1016/j.jclepro.2020.120899
3. Zhao Y, Wang Y, Wang W, Tang L, Liu Q, Cheng G. Modeling of rheological fracture behavior of rock cracks subjected to hydraulic pressure and far field stresses. Theor Appl Fract Mech (2019) 101:59–66. doi:10.1016/j.tafmec.2019.01.026
4. Dong L, Zou W, Li X, Shu W, Wang Z. Collaborative localization method using analytical and iterative solutions for microseismic/acoustic emission sources in the rockmass structure for underground mining. Eng Fract Mech (2018) 210:95–112. doi:10.1016/j.engfracmech.2018.01.032
5. Wang ZH, Li L, Zhang YX, Wang W-T. Bond-slip model considering freeze-thaw damage effect of concrete and its application. Eng Struct (2019) 201:109831. doi:10.1016/j.engstruct.2019.109831
6. Chen W, Wan W, Zhao Y, Peng W. Experimental study of the crack predominance of rock-like material containing parallel double fissures under uniaxial compression. Sustainability (2020) 12:5188. doi:10.3390/su12125188
7. Zhou XP, Zhang YX, Ha QL, Zhu KS. Micromechanical modelling of the complete stress-strain relationship for crack weakened rock subjected to compressive loading. Rock Mech Rock Eng (2008) 41:747–69. doi:10.1007/s00603-007-0130-2
8. Wang Y, Niu D, Song Z. Effect of acid rain erosion on steel fiber reinforced concrete. J Wuhan Univ Technol -Materials Sci Ed (2017) 32:121–8. doi:10.1007/s11595-017-1569-y
9. Carmona-Quiroga PM, Blanco-Varela MT. Use of barium carbonate to inhibit sulfate attack in cements. Cement Concr Res (2015) 69:96–104. doi:10.1016/j.cemconres.2014.12.006
10. Zhao Y, Zhang L, Wang W, Wan W, Ma W. Separation of elastoviscoplastic strains of rock and a nonlinear creep model. Int J GeoMech (2018) 18:04017129. doi:10.1061/(asce)gm.1943-5622.0001033
11. Chen R, Yang K, Qiu X, Zheng X, Wang P, Xu J, et al. Degradation mechanism of CA mortar in CRTS I slab ballastless railway track in the Southwest acid rain region of China - materials analysis. Construct Build Mater (2017) 149:921–33. doi:10.1016/j.conbuildmat.2017.04.017
12. Kean A, Meredith P. Stress corrosion cracking of quartz: a note on the influence of chemical environment. Tectonophysics (1981) 77:1–11. doi:10.1016/0040-1951(81)90157-8
13. Han T, Shi J, Chen Y, Dang S, Peng S. Salt solution attack induced mechanical property degradation and quantitative analysis method for evolution of meso-structure damages of mortar. Chin J Mater Res (2015) 29:921–30. doi:10.11901/1005.3093.2015.12.921
14. Dunning J, Douglas B, Miller M, McDonald S. The role of the chemical environment in frictional deformation: stress corrosion cracking and comminution. Pageoph (1994) 143:151–78. doi:10.1007/bf00874327
15. Rebinder P, Shreiner L, Zhigach K. Hardness reducers in drilling: a physico-chemical method of facilitating the mechanical destruction of rocks during drilling. Council for Scientific and Industrial Research, Melbourne (1948)
16. Wu Q, Li X, Weng L, Li Q, Zhu Y, Luo R. Experimental investigation of the dynamic response of prestressed rockbolt by using an SHPB-based rockbolt test system. Tunn Undergr Space Technol (2019) 93:103088. doi:10.1016/j.tust.2019.103088
17. Zhou XP. Localization of deformation and stress-strain relation for mesoscopic heterogeneous brittle rock materials under unloading. Theor Appl Fract Mech (2005) 44(1):27–43. doi:10.1016/j.tafmec.2005.05.003
18. Karfakis MG, Akram M. Effects of chemical solutions on rock fracturing. Int J Rock Mech Min Sci Geomech Abstr (1993) 30:1253–9. doi:10.1016/0148-9062(93)90104-l
19. Feucht LJ, Logan JM. Effects of chemically active solutions on shearing behavior of a sandstone. Tectonophysics (1990) 175:159–76. doi:10.1016/0040-1951(90)90136-v
20. Hutchinson AJ, Johnson JB, Thompson GE, Wood GC, Sage PW, Cooke MJ. Stone degradation due to wet deposition of pollutants. Corrosion Sci (1993) 34:1881–98. doi:10.1016/0010-938x(93)90025-c
21. Heggheim T, Madland MV, Risnes R, Austad T. A chemical induced enhanced weakening of chalk by seawater. J Petrol Sci Eng (2005) 46:171–84. doi:10.1016/j.petrol.2004.12.001
22. Fan YF, Wang DW, Luan H. Study on the load carrying capacity of reinforced concrete beams under acid precipitation. Eng Mech (2014) 31:147–54. doi:10.6052/j.issn.1000-4750.2012.11.0845
23. Chen MC, Wang K, Xie L. Deterioration mechanism of cementitious materials under acid rain attack. Eng Fail Anal (2013) 27:272–85. doi:10.1016/j.engfailanal.2012.08.007
24. Brzesowsky RH, Hangx SJT, Brantut N, Spiers CJ. Compaction creep of sands due to time‐dependent grain failure: effects of chemical environment, applied stress, and grain size. J. Geophys. Res. Solid Earth (2014) 119:7521–41. doi:10.1002/2014jb011277
25. Spiers J, Li P, Qiao L, Zhu J. Experimental research on creep behavior and mechanism of sandstones with hydro-physico-chemical effects. Chin J Rock Mech Eng (2008) 27:2540–50. doi:10.3321/j.issn:1000-6915.2008.12.022
26. Tang L, Zhang P, Wang S. Testing study of effects of chemical action of aqueous solution on crack propagation in rock. Chin J Rock Mech Eng (2002) 21:822–27. doi:10.3321/j.issn:1000-6915.2002.06.012
27. Tang L, Wang S. Analysis on mechanism and quantitative methods of chemical damage in water-rock interaction. Chin J Rock Mech Eng (2002) 21:314–9. doi:10.3321/j.issn:1000-6915.2002.03.004
28. Tang L, Wang S. Testing study on macroscopic mechanics effect of chemical action of water on rocks. Chin J Rock Mech Eng (2002) 21:523–6. doi:10.3321/j.issn:1000-6915.2002.04.015
29. Tang L, Wang S. Progress in the study on mechanical effect of the chemical action of water-rock on deformation and failure of rocks. Adv Earth Sci (1999) 14:433–9. doi:10.11867/j.issn.1001-8166.1999.05.0433
30. Ding W, Feng X. Study of chemical damage effect and quantitative analysis method of meso-structure of limestone. Chin J Rock Mech Eng (2005) 24:1283–8. doi:10.3321/j.issn:1000-6915.2005.08.002
31. Ding W, Feng X. Testing study on mechanical effect for limestone under chemical erosion. Chin J Rock Mech Eng (2004) 23:3571–6. doi:10.3321/j.issn:1000-6915.2004.21.002
32. Chen S, Feng X, Zhou H. Study on triaxial meso-failure mechanism and damage variables of sandstone under chemical erosion. Rock Soil Mech (2004) 25:1363–7. doi:10.3969/j.issn.1000-7598.2004.09.004
33. Chen S, Feng X, Zhou H, Li S. Effects of chemical erosion on uniaxial compressive strength and meso-fracturing behaviors of rock. Chin J Rock Mech Eng (2003) 22:547–51. doi:10.3321/j.issn:1000-6915.2003.04.007
34. Chen S, Feng X, Zhou H. Experiments on the mechanical effects of sandstone with chemical erosion under the triaxial compression. J Northeast Univ (Nat Sci) (2003) 24:292–5. doi:10.3321/j.issn:1005-3026.2003.03.023
35. Miao S, Cai M, Ji D. Damage effect of granite's mechanical properties and parameters under the action of acidic solutions. J China Coal Soc (2016) 41:829–35. doi:10.13225/j.cnki.jccs.2015.0845
36. Miao S, Cai M, Ji D, Guo Q, Bai Y. Aging features and mechanism of Granite's damage under the action of acidic chemical solutions. J China Coal Soc (2016) 41:1137–44. doi:10.13225/j.cnki.jccs.2015.1263
37. Zhang C, Wang Y, Jiang T. The propagation mechanism of an oblique straight crack in a rock sample and the effect of osmotic pressure under in-plane biaxial compression. Arab J Geosci (2020) 13:736. doi:10.1007/s12517-020-05682-3
38. Zhang Y, Zhang Z, Xue S, Wang R, Xiao M. Stability analysis of a typical landslide mass in the Three Gorges Reservoir under varying reservoir water levels. Environmental Earth Sciences (2020) 79:1–14. doi:10.1007/s12665-019-8779-x
39. Wang ZH, Li L, Zhang YX, Zheng SS. Reinforcement model considering slip effect. Eng Struct (2019) 198:109493. doi:10.1016/j.engstruct.2019.109493
40. Zhou W, Shi X, Lu X, Qi C, Luan B, Liu F. The mechanical and microstructural properties of refuse mudstone-GGBS-red mud based geopolymer composites made with sand. Construct Build Mater (2020) 253:119193. doi:10.1016/j.conbuildmat.2020.119193
41. Zhou XP, Yang HQ. Dynamic damage localization in crack-weakened rock mass: strain energy density factor approach. Theor Appl Fract Mech (2018) 97:289–302. doi:10.1016/j.tafmec.2017.05.006
42. Wu Q, Chen L, Shen B., Dlamini B., Li S., Zhu Y. Experimental investigation on rockbolt performance under the tension load. Rock Mech Rock Eng (2019) 52:4605–18. doi:10.1007/s00603-019-01845-1
43. Zhao Y, Zhang L, Wang W, Tang J, Lin H, Wan W. Transient pulse test and morphological analysis of single rock fractures. Int J Rock Mech Min Sci (2017) 91:139–54. doi:10.1016/j.ijrmms.2016.11.016
44. Zhao Y, Zhang L, Wang W, Pu C, Wan W, Tang J. Cracking and stress-strain behavior of rock-like material containing two flaws under uniaxial compression. Rock Mech Rock Eng (2016) 49:2665–87. doi:10.1007/s00603-016-0932-1
45. Lin Z, Yang L, Jian L, Wei J, Qiang L, Li M. Experimental study of fracture toughness and subcritical crack growth of three rocks under different environments. Int J GeoMech (2020) 20:04020128. doi:10.1061/(ASCE)GM.1943-5622.0001779
46. Zhou XP, Yang HQ. Micromechanical modeling of dynamic compressive responses of mesoscopic heterogenous brittle rock. Theor Appl Fract Mech (2007) 48:1–20. doi:10.1016/j.tafmec.2007.04.008
47. Ulusay R. The isrm suggested methods for rock characterization, testing and monitoring: 2007-2014. Vol. 15. New York, NY: Springer International Publishing. (2014) p. 47–8.
48. Kahraman S. Evaluation of simple methods for assessing the uniaxial compressive strength of rock. Int J Rock Mech Min Sci (2001) 38:981–94. doi:10.1016/s1365-1609(01)00039-9
49. Dong L, Tong X, Li X, Zhou J, Wang S, Liu B. Some developments and new insights of environmental problems and deep mining strategy for cleaner production in mines. J Clean Prod (2019) 210:1562–78. doi:10.1016/j.jclepro.2018.10.291
50. Wang M, Wan W. A new empirical formula for evaluating uniaxial compressive strength using the Schmidt hammer test. Int J Rock Mech Min Sci (2019) 123:104094. doi:10.1016/j.ijrmms.2019.104094
51. Zhang C, Zou P, Wang Y, Jiang T, Lin H, Cao P. An elasto-visco-plastic model based on stress functions for deformation and damage of water-saturated rocks during the freeze-thaw process. Construct Build Mater (2020) 250:118862. doi:10.1016/j.conbuildmat.2020.118862
52. Liu J, Wan W, Zhao Y, Fan X. Stress evolution in punch-through shear tests: a numerical study based on discrete element method. Front Phys. (2020) 8:327. doi:10.3389/fphy.2020.00327
53. Zhao Y, Zhang L, Wang W, Liu Q, Tang L, Cheng G. Experimental study on shear behavior and a revised shear strength model for infilled rock joints. Int J GeoMech (2020) 20:04020141. doi:10.1061/(asce)gm.1943-5622.0001781
54. Zhao Y, Wang Y, Wang W, Wan W, Tang J. Modeling of non-linear rheological behavior of hard rock using triaxial rheological experiment. Int J Rock Mech Min Sci. (2017) 93:66–75. doi:10.1016/j.ijrmms.2017.01.004
55. Sammis CG, Ashby MF. The failure of brittle porous solids under compressive stress states. Acta Metall (1986) 34:511–26. doi:10.1016/0001-6160(86)90087-8
56. Ashby MF, Hallam SD. The failure of brittle solids containing small cracks under compressive stress states. Acta Metall (1986) 34:497–510. doi:10.1016/0001-6160(86)90086-6
57. Wu Q, Weng L, Zhao Y, Guo B, Luo T. On the tensile mechanical characteristics of fine-grained granite after heating/cooling treatments with different cooling rates. Eng Geol (2019) 253:94–110. doi:10.1016/j.enggeo.2019.03.014
58. Parteli E, Schmidt J, Blumel C, Wirth K, Peukert W, Poschel T. Attractive particle interaction forces and packing density of fine glass powders. Sci Rep (2015) 4:6227. doi:10.1038/srep06227
59. Zhang C, Lin H, Qiu C, Jiang T, Zhang J. The effect of cross-section shape on deformation, damage and failure of rock-like materials under uniaxial compression from both a macro and micro viewpoint. Int J Damage Mech (2020) 29:1076–99. doi:10.1177/1056789520904119
60. Dong L, Sun D, Li X, Ma J, Zhang L, Tong X. Interval non-probabilistic reliability of surrounding jointed rockmass considering microseismic loads in mining tunnels. Tunn Undergr Space Technol (2018) 81:326–35. doi:10.1016/j.tust.2018.06.034
61. Huo R. Experimental research on progressive and deteriorative characteristics of sandstone and mortar subjected to hydrochloric acid corrosion. Chin J Rock Mech Eng (2007) 26:647–51. doi:10.3321/j.issn:1000-6915.2007.03.031
Keywords: rock mechanics, acidification erosion, mechanics damage, aging characteristics, strength model
Citation: Chen W, Wan W, Zhao Y, Xie S, Jiao B, Dong Z, Wang X and Lian S (2020) Aging Features and Strength Model of Diorite’s Damage Considering Acidization. Front. Phys. 8:553643. doi: 10.3389/fphy.2020.553643
Received: 19 April 2020; Accepted: 14 September 2020;
Published: 07 October 2020.
Edited by:
Longjun Dong, Central South University, ChinaReviewed by:
Eric Josef Ribeiro Parteli, University of Cologne, GermanyNiravkumar J. Joshi, University of California, Berkeley, United States
Copyright © 2020 Chen, Wan, Zhao, Xie, Jiao, Dong, Wang and Lian. This is an open-access article distributed under the terms of the Creative Commons Attribution License (CC BY). The use, distribution or reproduction in other forums is permitted, provided the original author(s) and the copyright owner(s) are credited and that the original publication in this journal is cited, in accordance with accepted academic practice. No use, distribution or reproduction is permitted which does not comply with these terms.
*Correspondence: Wei Chen, MTgwMTAxMDIwMDAxQG1haWwuaG51c3QuZWR1LmNu, Wen Wan, d2Fud2VuaHVuc3RAMTYzLmNvbQ==
 Wei Chen
 Wen Wan1*