
94% of researchers rate our articles as excellent or good
Learn more about the work of our research integrity team to safeguard the quality of each article we publish.
Find out more
ORIGINAL RESEARCH article
Front. Phys., 17 December 2020
Sec. Optics and Photonics
Volume 8 - 2020 | https://doi.org/10.3389/fphy.2020.527734
This article is part of the Research TopicSingular and Correlation OpticsView all 7 articles
The knife-edge method is an established technique for profiling of even tightly focused light beams. However, the straightforward implementation of this method fails if the materials and geometry of the knife-edges are not chosen carefully or, in particular, if knife-edges are used that are made of pure materials. Artifacts are introduced in these cases in the shape and position of the reconstructed beam profile due to the interaction of the light beam under study with the knife. Hence, corrections to the standard knife-edge evaluation method are required. Here we investigate the knife-edge method for highly focused radially and azimuthally polarized beams and their linearly polarized constituents. We introduce relative shifts for those constituents and report on the consistency with the case of a linearly polarized fundamental Gaussian beam. An adapted knife-edge reconstruction technique is presented and proof-of-concept tests are shown, demonstrating the reconstruction of beam profiles.
A paraxially propagating linearly polarized fundamental Gaussian beam undergoes, upon high numerical aperture focusing, an elongation of its focal spot along the polarization axis of the input beam [1–3]. In contrast, radially and azimuthally polarized beams are still symmetric with respect to their electric and magnetic field distributions when tightly focused. Nonetheless, both cases have in common that for non-paraxial propagation, the field distributions exhibit significant contributions of longitudinal field components, which, for the case of radial polarization, are peaking on the optical axis [2, 4, 5]. A paraxial radially polarized mode can be decomposed into two orthogonally polarized Hermite-Gaussian (HG) modes: an x-polarized HG10 and a y-polarized HG01 mode. In contrast, an azimuthally polarized mode is a superposition of a y-polarized HG10 and an x-polarized HG01 mode. Similar to linearly polarized Gaussian beams, tight focusing of these linearly polarized constituents also results in a symmetry breaking of the focal spot. Due to the rich structure of the focal spot achieved by various field engineering techniques, a precise measurement of such complicated vectorial fields is rather challenging. Nevertheless it is crucial to experimentally analyze and profile tightly focused vectorial beams in a real-world setup before utilizing them for experiments in nano-optics or plasmonics (see, for instance, Refs. 6–10 and others).
In the literature, many methods for beam characterization have been described, such as the so-called knife-edge [11–14], point scan method [15], particle scan [16], or slit method [17], to just name a few. In the knife-edge method, a beam-block realized by a sharp edge made from an opaque material (such as a knife or razor-blade) is line-scanned through the beam perpendicular to its optical axis while the transmitted power is monitored by a detector for multiple scanning directions. From the resulting photocurrent curves (power vs. position of the edge relative to the beam) the so-called beam-projections onto the scanning-line and finally the beam shape can be tomographically reconstructed [2, 5].
In a more recent study, knife-edges made from pure materials (metals, semiconductors, etc.) were systematically studied and polarization dependent effects in the knife-edge profiling method were observed [18]. Those effects result in a shift and a deformation of the measured projections and depend on the polarization and wavelength of the input beam, and the materials of the knife-edge samples. Caused by the aforementioned distortions introduced by knife-edges made from pure materials, a proper reconstruction of the beam under study seems to be impossible using a standard evaluation method. But recently we have demonstrated that the interaction between the knife-edge and a highly focused linearly polarized fundamental Gaussian beam can be understood in terms of the moments of the beam (beam profile times a polynomial) and, therefore, an adapted beam reconstruction and fitting technique can be successfully applied in this case [19].
The aim of the study presented in this article is an extension of the previously discussed method by applying the knowledge already obtained for linearly polarized fundamental Gaussian beams [18, 19] and to develop an adapted knife-edge reconstruction technique for highly focused linearly polarized first order Hermite-Gaussian beams [20], which are the constituents of radially and azimuthally polarized beams.
The principle of the knife-edge method is depicted in Figure 1. For experimental reasons we consider here beam profiling by two adjacent edges of a single rectangularly shaped metallic knife-pad. The photocurrent generated inside the photodiode is proportional to the power P detected by the photodiode and is recorded for each beam position
where
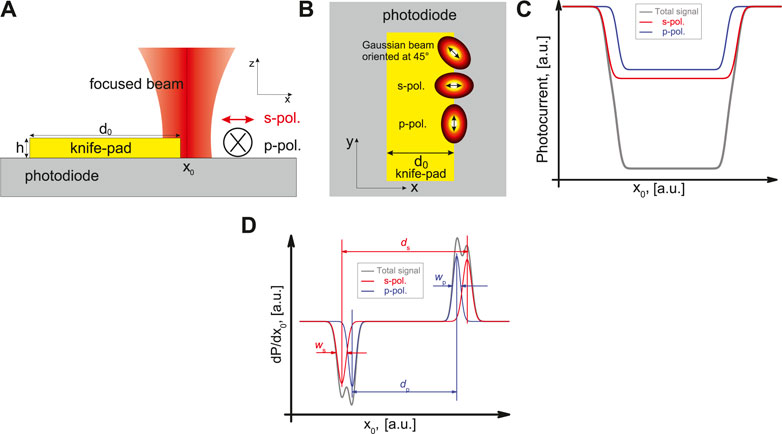
FIGURE 1. Schematic depiction of the knife-edge method xz-plane (A) and xy-plane (B). The state of polarization always refers to the orientation of the electric field of the incoming beam relative to the knife-edge in the xy-plane. Typical beam profiling data (photocurrent curves) (C) and their derivatives (beam-projections) (D) for a linearly polarized Gaussian beam (oriented at 45° (total signal) - gray, s-polarization - red, p-polarization - blue).
In this context it has to be mentioned that the term intensity usually refers to the total electric energy density and at the same time to the z-component of the Poynting-vector
To better understand those shifts and distortions in the measured projections, we start with a fundamental Gaussian beam, which has its electric field oriented at 45° to the knife-edge. With a polarizer in front of the focusing objective oriented either perpendicular or parallel to the knife-edge, the incident beam can be decomposed in its linearly polarized constituents with the electric field of the incoming beam being either perpendicular (s) or parallel (p) to the knife-edge, see Figures 1A,B. A photocurrent curve can be recorded for each orientation of the polarizer. The sum of those two photocurrent curves should result in the signal recorded without the polarizer (total signal), see Figure 1C. Taking the derivative
Of particular interest for this article is now the question how higher order (first order) beams behave in the context of the previous discussion, see Figure 2. Similar to the rotated linearly polarized Gaussian beam a radially polarized beam is a superposition of two orthogonally polarized modes (x-pol. HG10, y-pol. HG01). In an equivalent fashion, an azimuthally polarized beam is a superposition of two linearly polarized constituents (y-pol. HG10, x-pol. HG01). In the case of tightly focused cylindrical vector beams, the retrieved total beam projections will be strongly modified if their linearly polarized constituents are shifted and distorted, see Figures 2A,B. Therefore it is important to investigate whether the distortions observed in these linearly polarized first order constituents can also be described using analogical parameters
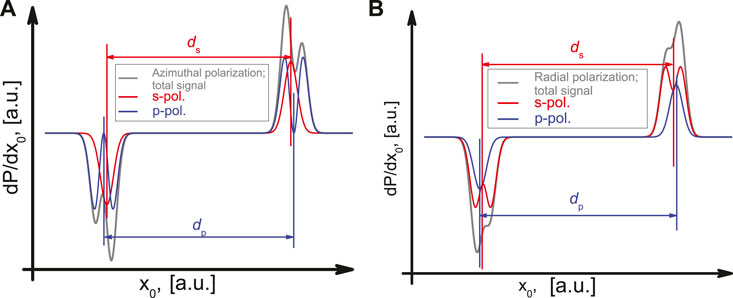
FIGURE 2. Typical derivatives of beam profiling data (photocurrent curves) for azimuthally (A) and radially (B) polarized beams (gray) and their linear constituents (s-polarization - red, p-polarization - blue).
We start with a discussion of the basis functions that would be most suitable for further development of an adapted knife-edge technique. An accurate description of highly focused beams is possible either by vectorial diffraction theory, leading to a numerical calculation of diffraction integrals, see for instance [3, 4], or by the so-called complex source approach, which enables an analytical description of tightly focused fields [22, 23]. The disadvantage of both approaches is their complexity, which makes them unsuitable for the development of an adapted knife-edge technique. Our aim here is to use an orthogonal set of analytical functions, which would be sufficient for an approximate description of highly focused fields. Electric (and magnetic) field components that are solutions to Maxwell’s equations can be expressed in terms of two independent functions
We can further simplify these expressions by keeping only the leading terms in
with
and
which greatly simplifies further considerations and enables us to rewrite Eq. 2 as
where the expansion coefficients
where
We now discuss an azimuthally and radially polarized beam and their linear constituents in more detail. A paraxial radially polarized beam is a superposition of two orthogonal HG modes, an x-polarized
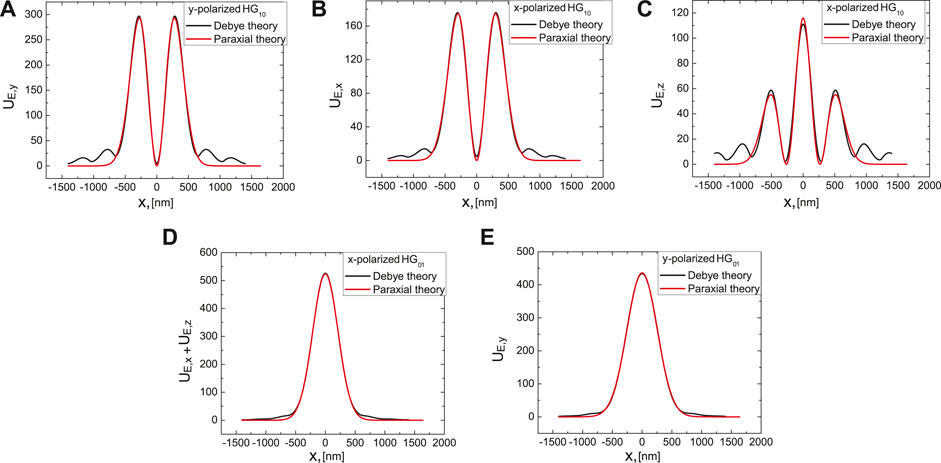
FIGURE 3. Comparison of calculated components of the projections of electric field energy densities between an approximation (paraxial theory, red) and exactly calculated projections using Richards-Wolf integrals (vectorial diffraction theory (Debye), black). The wavelength is
In our previous work [19], we presented a numerical technique to correct for artifacts in profiling of linearly polarized fundamental Gaussian beams, which are introduced by the interaction of the knife-edge with the focused light field [21]. This approach finally enables the usage of any kind of opaque material as a knife-edge material. Here, we now discuss a generalization of this numerical technique, which will also allow for the correction of artifacts observed in beam profiling of s- and p-polarized projections of the electric field intensity, which can be represented using Eq. 7. For that purpose, we start the discussion with a short excursus, describing the light-matter interaction between the focused light beam and the knife-edge as it is recorded by a detector, see Eq. 1.
First, the integration in Eq. 1 over the y-axis reduces the dimensionality of the electric field energy density. Therefore, beam profiling of this kind does not result directly in the reconstruction of the electric field intensity distribution I but its projection
with
The physical meaning behind Eq. 8 is the following. The first term in the sum
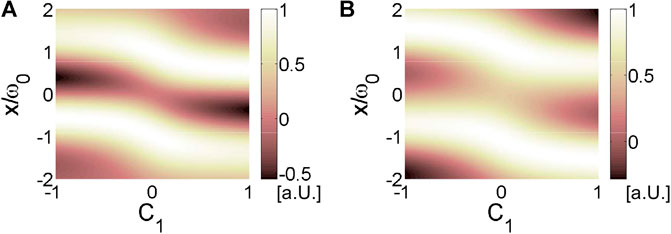
FIGURE 4. Dependence of calculated beam projections of (A)
We substitute now the expressions from Eq. 7 into Eq. 8 and obtain for s- and p-projections
where
We recently demonstrated that for functions with Gaussian envelopes, derivatives up to fourth order are sufficient [19]. Thus, the inner sum in Eq. 9 contains up to 14 different combinations of HG polynomials for a single unknown
In the following section we briefly discuss the experimental setup, the principle of the measurement and the studied knife-edge sample. A detailed discussion of the experimental concept was introduced earlier in Refs. 18 and 21. The experiments were performed at wavelengths between 535 and 700 nm using a tunable laser system from TOPTICA. The emitted laser beam is coupled into a single-mode photonic crystal fiber (PCF) to obtain a Gaussian beam profile. After collimation this linearly polarized Gaussian beam is converted into a radially or azimuthally polarized mode by using a liquid crystal polarization converter (LCPC) (see Figure 5A) [29]. Afterward the beam is filtered by a Fourier spatial filter (FSF), consisting of two lenses and a pinhole to achieve a high mode quality. The resulting beam is guided into a high NA microscope objective by a set of mirrors, and focused onto the knife-edge sample. For measurements with the fundamental x- and y-polarized linear constituents of the radially or azimuthally polarized modes, a linear polarizer is used in front of the objective. The knife-edges are line-scanned through the focal spot by a piezostage, and the power of the light beam that is not blocked by the knife-edge is detected by a photodiode placed directly underneath. This way projections of the beam profile are measured as already discussed in Section 2.1. For the measurements, knife-edges made of gold with a thickness

FIGURE 5. Schematic illustration of the experimental setup (A) (P, Polarizer; LCPC, liquid crystal polarization converter; FSF, Fourier spatial filter; MO, microscope objective), SEM image of the used knife-edge sample (B) (gold with a thickness h = 70 nm and a width
We start the discussion of our experimental results by demonstrating the appearnace of the aforementioned artifacts while beam profiling a radially and an azimuthally polarized beam and their linearly polarized constituents at two different wavelengths, see Figures 6A,B. In all cases one can notice the impact of the wavelength on the shape and relative position of the measured beam projections. While for a wavelength of
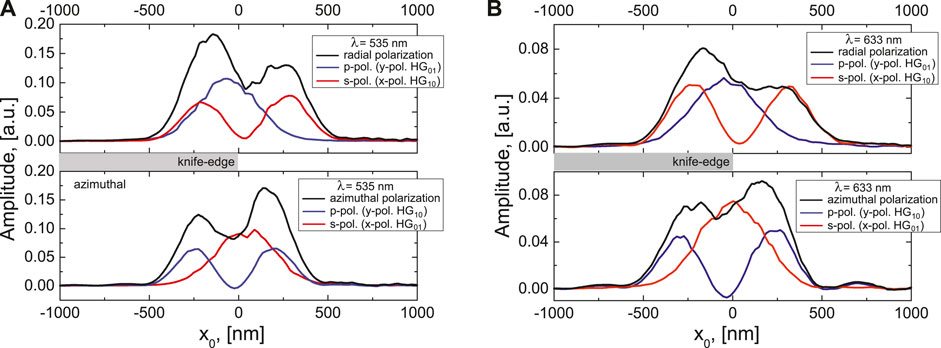
FIGURE 6. Experimentally measured projections of radially and azimuthally polarized beams (black) and their linear s-, p- polarized constituents (red, blue) for (A)
As a next step, we have retrieved specific points from the projections of all linearly polarized constituents, indicated in Figures 1 and 2 by the red and blue vertical lines respectively, to determine the shift of the projections
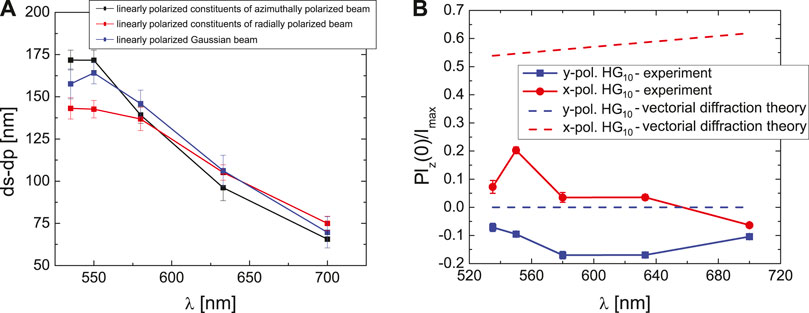
FIGURE 7. Experimentally measured relative shift
In a next step, we compare the measured intensities for the z-component of the electric field of the projected linear constituents at the specific points (see Figure 2) with those obtained numerically from Debye integrals [3], see Figure 7B. In all cases we have normalized the on-axis intensity at the point
Based on the ansatz proposed in Eq. 9, we have implemented a least-square fitting algorithm as a proof-of-concept, where we have restricted ourselves to up to the fourth derivative of the electric field energy density projection
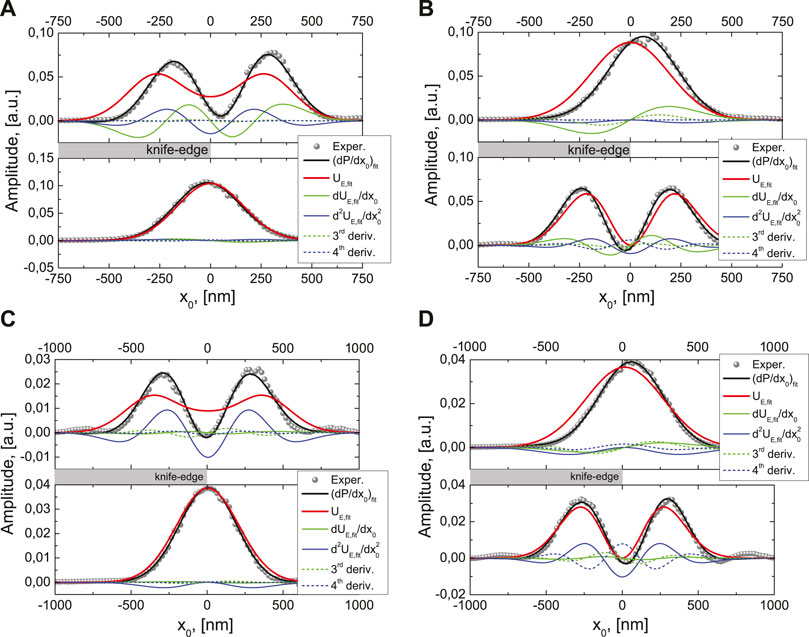
FIGURE 8. Depiction of the adapted knife-edge method for linear constituents of tightly focused radially (A,C) and azimuthally (B,D) polarized beams. The derivatives of the experimentally measured photocurrents (gray circles) and the fitted curve (black) with the beam profile (red) are shown together with its first four derivatives at
Lastly, we have used those successfully converged iterations to numerically determine the coefficients
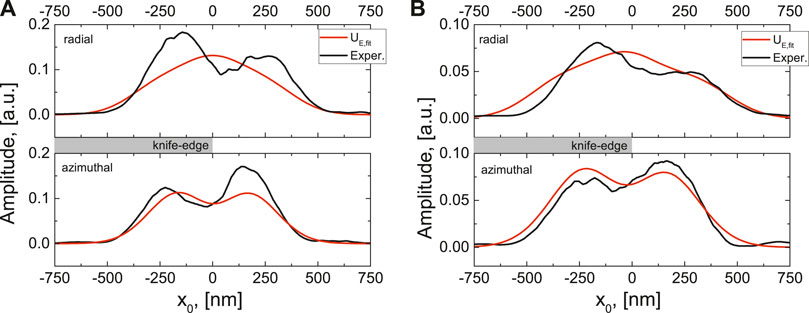
FIGURE 9. Depiction of the adapted knife-edge method for tightly focused radially and azimuthally polarized beams. Experimentally measured projections of radially and azimuthally polarized beams (black) and their reconstructed beam profiles (red) for (A)
In the end we would like to stress that the implementation of the fitted knife-edge algorithm performs an additional smoothing of some fine scale numerical artifacts. This can happen because the beams in our basis are perfect and symmetric in shape. One can argue, that by approximating the beam as a combination of Hermite-Gaussian modes, the algorithm restores only “perfect” shapes of a beam. Furthermore, if this method is applied to an irregularly shaped beam, it could completely remove the irregularities and artificially reconstruct it into a “perfect” shape beam. This is a natural outcome given the fact that the beams are very tightly focused here, and numerically observed irregularities have very high transverse wave-vectors, which would require an introduction of evanescent Hermite-Gaussian fields in order to describe them. However, we would like to point out that Eq. 8 can be rewritten without implementation of Hermite-Gaussian polynomials and the whole adapted knife-edging algorithm can be implemented as a system of linear equations for a few adjacent x-coordinates. This implementation would produce less smooth curves than those we observe in Figures 8 and 9.
In conclusion, we have analyzed the performance of the knife-edge method for pure materials applied to linearly polarized Hermite-Gaussian modes of first order, which are the constituents of radially and azimuthally polarized beams. For the correction of the observed modifications in these knife-edge measurements we presented a straight-forward and easy to implement method that is based on the adapted knife-edge reconstruction scheme. This way we are able to retrieve the beam projections of linearly polarized Hermite-Gaussian modes, for which shifts and deformations of the reconstructed projections as observed in conventional knife-edge measurements can be corrected.
The datasets generated for this study are available on request to the corresponding author.
SO and PB conceived the idea. SO developed the theoretical frame work and analyzed the theoretical data. CH and PM performed the experiments and analyzed the experimental data. PB and GL supervised the project. All authors contributed equally to the manuscript.
SO acknowledges funding by the European Social Fund according to the activity “Improvement of researchers” qualification by implementing world-class R&D projects’ of Measure No. 09.3.3-LMT-K-712.
The authors declare that the research was conducted in the absence of any commercial or financial relationships that could be construed as a potential conflict of interest.
We thank Stefan Malzer, Isabel Gäßner, Olga Rusina, and Irina Harder for their valuable support in preparing the samples. This manuscript has been released as a pre-print on the pre-print server arXiv (S. Orlov et al., arXiv:1610.08643 [physics.optics]).
1. Quabis S, Dorn R, Eberler M, Glöckl O, Leuchs G. Focusing light to a tighter spot. Optic Commun (2000) 179:1–7. doi:10.1016/s0030-4018(99)00729-4
2. Dorn R, Quabis S, Leuchs G. The focus of light-linear polarization breaks the rotational symmetry of the focal spot. J Mod Optic (2003) 50:1917–26. doi:10.1080/09500340308235246
3. Richards B, Wolf E. Electromagnetic diffraction in optical systems. II. Structure of the image field in an aplanatic system. Proc R Soc A (1959) 253:358–79. doi:10.1098/rspa.1959.0200
4. Youngworth KS, Brown TG. Focusing of high numerical aperture cylindrical-vector beams. Opt Express (2000) 7:77–87. doi:10.1364/oe.7.000077
5. Dorn R, Quabis S, Leuchs G. Sharper focus for a radially polarized light beam. Phys Rev Lett (2003) 91:233901. doi:10.1103/physrevlett.91.233901
6. Kindler J, Banzer P, Quabis S, Peschel U, Leuchs G. Waveguide properties of single subwavelength holes demonstrated with radially and azimuthally polarized light. Appl Phys B (2007) 89:517–20. doi:10.1007/s00340-007-2874-5
7. Züchner T, Failla AV, Hartschuh A, Meixner AJ. A novel approach to detect and characterize the scattering patterns of single Au nanoparticles using confocal microscopy. J Microsc (2008) 229:337–43. doi:10.1111/j.1365-2818.2008.01910.x
8. Banzer P, Kindler J, Quabis S, Peschel U, Leuchs G. Extraordinary transmission through a single coaxial aperture in a thin metal film. Opt Express (2010) 18:10896–904. doi:10.1364/oe.18.010896
9. Banzer P, Peschel U, Quabis S, Leuchs G. On the experimental investigation of the electric and magnetic response of a single nano-structure. Opt Express (2010) 18:10905–23. doi:10.1364/oe.18.010905
10. Bauer T, Orlov S, Leuchs G, Banzer P. Towards an optical far-field measurement of higher-order multipole contributions to the scattering response of nanoparticles. Appl Phys Lett (2015) 106:091108. doi:10.1063/1.4914117
11. Firester AH, Heller ME, Sheng P. Knife-edge scanning measurements of subwavelength focused light beams. Appl Opt (1977) 16:1971–4. doi:10.1364/ao.16.001971
12. Khosrofian JM, Garetz BA. Measurement of a Gaussian laser beam diameter through the direct inversion of knife-edge data. Appl Opt (1983) 22:3406–10. doi:10.1364/ao.22.003406
13. de Araújo MA, Silva R, de Lima E, Pereira DP, de Oliveira PC. Measurement of Gaussian laser beam radius using the knife-edge technique: improvement on data analysis. Appl Opt (2009) 48:393–6. doi:10.1364/ao.48.000393
14. Brost G, Horn PD, Abtahi A. Convenient spatial profiling of pulsed laser beams. Appl Opt (1985) 24:38–40. doi:10.1364/ao.24.000038
15. Schneider MB, Webb WW. Measurement of submicron laser beam radii. Appl Opt (1981) 20:1382–8. doi:10.1364/ao.20.001382
16. Bauer T, Orlov S, Peschel U, Banzer P, Leuchs G. Nanointerferometric amplitude and phase reconstruction of tightly focused vector beams. Nat Photon (2013) 8:23–7. doi:10.1038/nphoton.2013.289
17. McCally RL. Measurement of Gaussian beam parameters. Appl Opt (1984) 23:2227. doi:10.1364/ao.23.002227
18. Marchenko P, Orlov S, Huber C, Banzer P, Quabis S, Peschel U, et al. Interaction of highly focused vector beams with a metal knife-edge. Opt Express (2011) 19:7244–61. doi:10.1364/oe.19.007244
19. Huber C, Orlov S, Banzer P, Leuchs G. Corrections to the knife-edge based reconstruction scheme of tightly focused light beams. Opt Express (2013) 21:25069–76. doi:10.1364/oe.21.025069
20. Orlov S, Huber C, Marchenko P, Banzer P, Leuchs G. Corrected knife-edge-based reconstruction of tightly focused higher order beams (2016). arXiv:1610.08643.
21. Huber C, Orlov S, Banzer P, Leuchs G. Influence of the substrate material on the knife-edge based profiling of tightly focused light beams. Opt Express (2016) 24:8214–27. doi:10.1364/oe.24.008214
22. Orlov S, Peschel U. Complex source beam: a tool to describe highly focused vector beams analytically. Phys Rev A (2010) 82:063820. doi:10.1103/physreva.82.063820
23. Orlov S, Banzer P. Vectorial complex-source vortex beams. Phys Rev A (2014) 90:023832. doi:10.1103/physreva.90.023832
24. Erikson WL, Singh S. Polarization properties of Maxwell-Gaussian laser beams. Phys Rev E (1994) 49:5778–86. doi:10.1103/physreve.49.5778
25. Lax M, Louisell WH, McKnight WB. From Maxwell to paraxial wave optics. Phys Rev A (1975) 11:1365. doi:10.1103/physreva.11.1365
27. Sturman B, Podivilov E, Gorkunov M. Eigenmodes for metal-dielectric light-transmitting nanostructures. Phys Rev B (2007) 76:125104. doi:10.1103/physrevb.76.125104
28. Kocabaş ŞE, Veronis G, Miller DAB, Fan S. Modal analysis and coupling in metal-insulator-metal wavequides. Phys Rev B (2009) 79:035120. doi:10.1103/PhysRevB.79.035120
Keywords: optics, structured light, nano-optics, tomographic reconstruction, vector beam
Citation: Orlov S, Huber C, Marchenko P, Banzer P and Leuchs G (2020) Toward a Corrected Knife-Edge-Based Reconstruction of Tightly Focused Higher Order Beams. Front. Phys. 8:527734. doi: 10.3389/fphy.2020.527734
Received: 17 January 2020; Accepted: 10 November 2020;
Published: 17 December 2020.
Edited by:
Steen Grüner Hanson, Technical University of Denmark, DenmarkReviewed by:
Xiangping Li, Jinan University, ChinaCopyright © 2020 Orlov, Huber, Marchenko, Banzer and Leuchs. This is an open-access article distributed under the terms of the Creative Commons Attribution License (CC BY). The use, distribution or reproduction in other forums is permitted, provided the original author(s) and the copyright owner(s) are credited and that the original publication in this journal is cited, in accordance with accepted academic practice. No use, distribution or reproduction is permitted which does not comply with these terms.
*Correspondence: Sergej Orlov, c2VyZ2VqdXMub3Jsb3Zhc0BmdG1jLmx0
Disclaimer: All claims expressed in this article are solely those of the authors and do not necessarily represent those of their affiliated organizations, or those of the publisher, the editors and the reviewers. Any product that may be evaluated in this article or claim that may be made by its manufacturer is not guaranteed or endorsed by the publisher.
Research integrity at Frontiers

Learn more about the work of our research integrity team to safeguard the quality of each article we publish.