- Data Science & Machine Learning Division, PerMediQ GmbH,Wang, Germany
It is common to consider using a data-intensive strategy as a way to develop systemic and quantitative analysis of complex systems so that data collection, sampling, standardization, visualization, and interpretation can determine how causal relationships are identified and incorporated into mathematical models. Collecting enough large datasets seems to be a good strategy in reducing bias of the collected data; but persistent and dynamic anomalies in the data structure, generated from variations in intrinsic mechanisms, can actually induce persistent entropy thus affecting the overall validity of quantitative models. In this research, we are introducing a method based on the definition of homological groups that aims at evaluating this persistent entropy as a complexity measure to estimate the observability of the systems. This method identifies patterns with persistent topology, extracted from the combination of different time series and clustering them to identify persistent bias in the data. We tested this method on accumulated data from patients using mobile sensors to measure the response of physical exercise in real-world conditions outside the lab. With this method, we aim to better stratify time series and customize models in complex biological systems.
Introduction
The quantitative description of complex systems often makes use of time series because its relationships and correlations aim to infer causal connections between observations [1]. At the end, a robust quantitative description must fulfill the condition of system’s observability, that is, the system’s internal states being accessed from the data, such that a mathematical model can be extrapolated or used to make predictions about future states of the system.
In this research work, we face the problem of estimating persistent entropy generated by all the internal processes and states in complex systems that could compromise the stability of a quantitative description of a complex system.
Previous research has focused on the definition of causality tests by using time series [1], for example, using transfer entropy [2]. But understanding causal relationships that lead to the successful implementation of models requires a sound analysis of the influence of the sampled data [3]. In some cases, causality inference can be complicated by a bias when estimating a limited amount of data that is possibly noisy [1]. This causality inference is based on the notion of cooperative behavior of complex coupled systems, where synchronization and related phenomena have been observed, for example, in physical and biological systems [4].
However, there are constant individual variations between organisms that challenge this approach. For example, a bird flying in a forest calculates its trajectory according to the distribution of the trees in the environment. Bees also “compute” and create a model of their environment [5]. Also, a cancer cell adapts its response represented by changes in its microenvironment as well as internal changes in the regulatory systems, for instance, depending on the acidity of the tissue, the presence of toxic chemicals [6], or the existence of landscapes with complex attractors in stem cells that depend on different molecular signatures (for a study on this topic, see, e.g., Ref. 7). Such representations are useful considering that an environment and changes in internal constraints like molecular shapes or boundary conditions are not static: a storm can change the distribution of trees in a forest affecting an ecosystem, or changing a diet can induce substances capable to modify microenvironments or regulation mechanisms of cells in tissues affected by cancer cells [8].
The reason why individual biological variations can take place is thus not easy to precise; but the important fact is that this problem permanently challenges the construction of models [9]. In effect, the myriad of possible interactions motivates a continuous update in the information registered in database. Thus, while some canonical pathways are well known, many other interactions, and possible variations, are still unknown and must be constantly updated when these mechanisms are reconstructed [8]. Therefore, a good strategy is the identification of individual deviations that might require individual modeling or an update in the database.
These individual deviations generate persistent entropy that can be estimated by analyzing persistent patterns in time series. For this reason, we make use of persistent homology groups to qualitatively assess persistent incoherencies and imbalances in the sampled data associated to the trajectories
In Topological Methods for the Assessment of Bias in the Sampled Data, we introduce the mathematical background of our methodology, which is tested in Supplementary Appendix 3 with synthetic data generated from a simple model on a population of chemotactic cells with different response mechanisms. In Proof of Concept for Data Analysis, we perform a test on real data with the mhealth dataset, which contains data of patients wearing Internet of things (IoT) sensors connected to internet devices to measure electrocardiograms (ECGs) and acceleration while they were performing physical exercise in normal and noncontrolled conditions [18]. Finally, in “Discussion” and “Conclusion,” we discuss the results and their future perspectives.
Topological Methods for the Assessment of Bias in the Sampled Data
As a starting point, we consider different biological/physiological data (e.g., number of individuals in a population, nerve impulses, concentration of chemicals, etc.), being recorded at different time series that can be coupled in a path
Under similar conditions, all organisms must have similar responses so that an average value of the data points in the phase space can be sampled and used to train models represented by a function
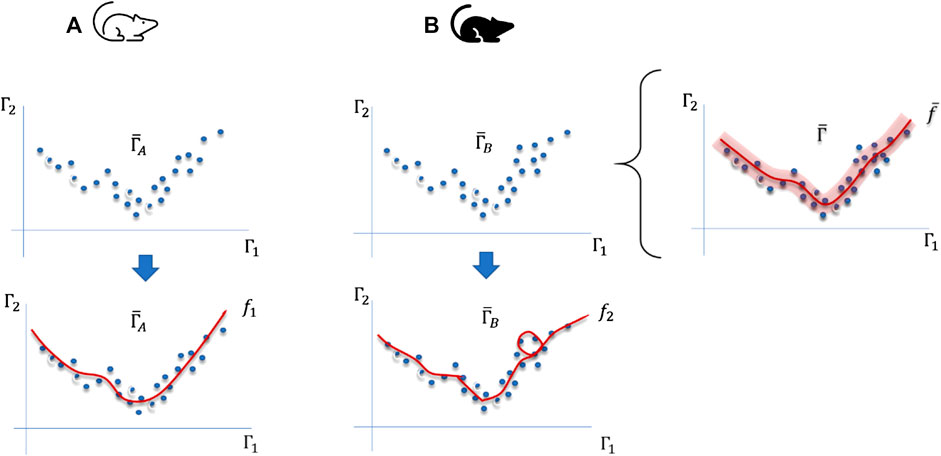
FIGURE 1. Differences between sampling trajectories in phase spaces generated by environmental changes or modifications of the internal regulation mechanisms of organisms of two different organisms (A,B). For instance,
In the modeling process, there is a statistical error and a bias associated with the way the researcher selects and validates the model. And the more the data points are sampled in
For this reason, a method, which goes beyond mere statistical variations, is required to extract relative variations generated in changes in physical constraints. Hence, we make use of the variance and bias to assess differences and effectively cluster trajectories with similar responses, leading to the concept of persistent bias, which in turn is related to this persistent variability of physical constraints.
Definition of Persistent Bias
According to the bias–variance decomposition, the error of a model
This bias is the result of false assumptions in the parameters used in the learning algorithm. But individual reactions of the organism induce a persistent bias in the data structure, for instance, how internal regulatory processes in an organism
where
Here,
When systems are observable, that is, when it is possible to extract the internal states of the system, then
Otherwise, when
Therefore, a persistent bias is not a mere statistical error originating from the observer or the sampled data but is the amount that generates persistent entropy that originated from variations in internal states of the system or organisms.
Topological persistence: separation of internal bias from statistical error and modeling.
In order to estimate the entropy in Eq. 3, we analyze the structure of
In the end, we construct point clouds
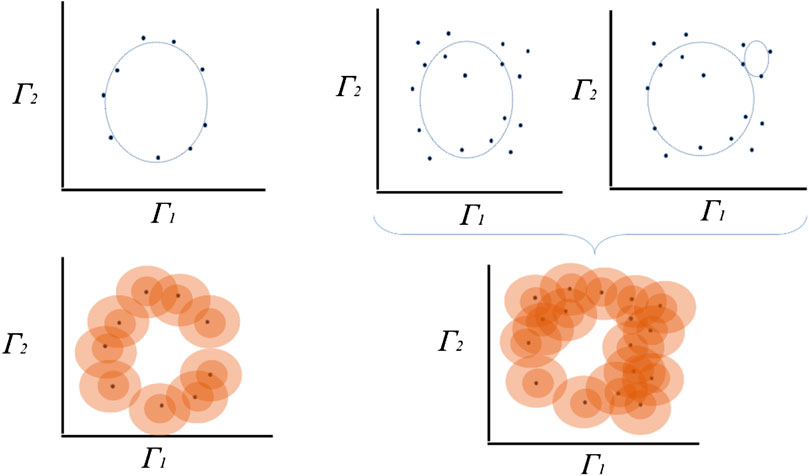
FIGURE 2. Exemplary estimation of topological persistence using a proximity parameter. A set of points can, for instance, be completed to a
In this theory, the combination of the time series of the trajectories
Persistent homology, a tool in algebraic topology, is particularly useful in situations where the “scale” is not a known a priori. Persistence theory, as considered by H. Edelsbrunner [24], starts with a space X equipped with finite filtration rather than represented by smooth manifolds using real-valued function [25]; thus, it can be seen as a generalization of hierarchical grouping of topological characteristics of the higher order that leads to a type of invariants represented by bar codes [23, 24, 26]. (For a more extensive introduction of this methodology, see Refs. 24–27. For an overview of its application, see Pun et al. [28] as well as Pereira et al. for the application on topology persistence in different fields in biology and medicine [29].)
We sample a collection of points in a metric space into a global object defined as the vertices of a combinatorial graph whose edges are defined by proximity [26]. While the graph captures the connectivity of the data, it allows the construction of filtration of simplexes using the values of the function and computes the persistent homology of the filtration, as in the example illustrated in Figure 2 for the discovery of different homologies in almost similar clouds of points.
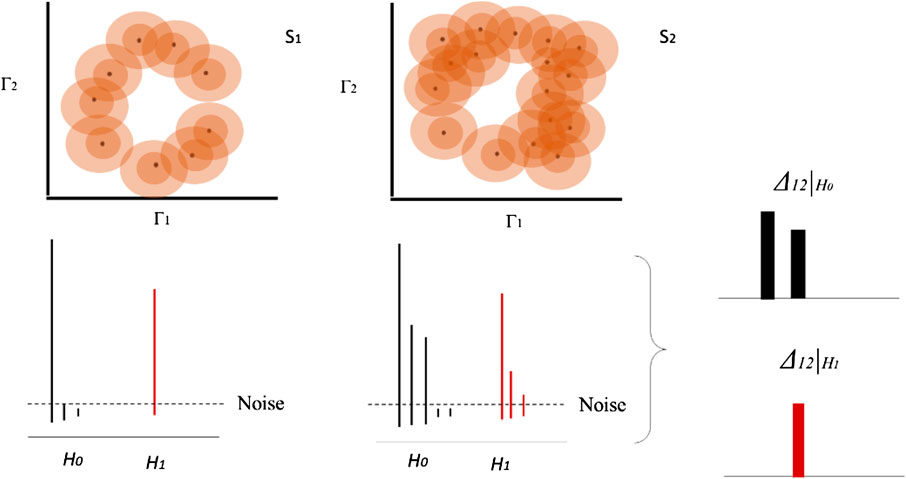
FIGURE 3. Homology group and bar diagram for two different datasets based on example in Figure 1. Each concentric circle on each data point represents a distance function
Here, we consider
Therefore, the estimation of these equivalences helps to characterize differences between trajectories as well as the differences of the topological signatures. Using persistent homology groups
where
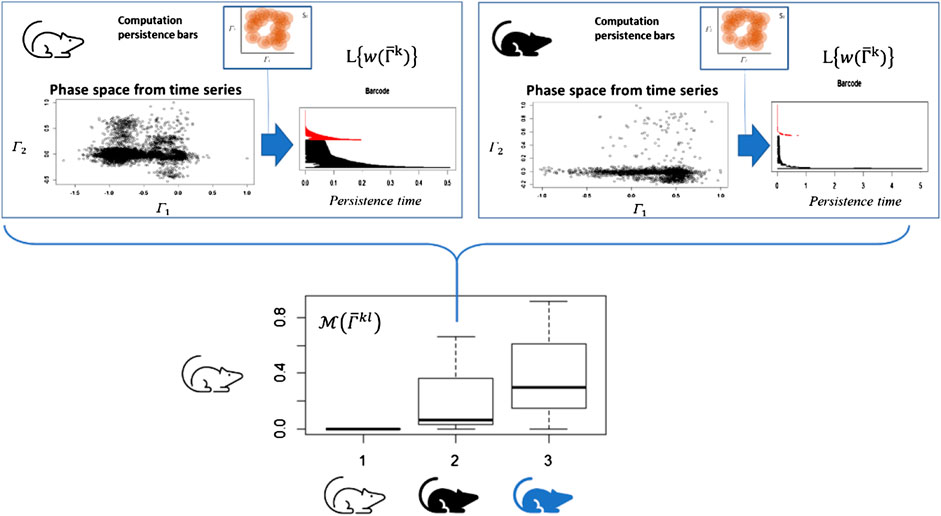
FIGURE 4. Time series of each system or organism is analyzed as a point cloud in a phase space using topological invariance. Once the persistent diagrams are obtained, they are normalized respect to the highest value. The difference of the bar codes
Bar codes are intuitive, but their statistical analysis is rather complex. To perform a useful statistical analysis of persistent homology for small samples, we need a real number which encapsulates the information contained in the bar code. Using a similar definition of a persistent entropy [21], we define it in function of the length of the persistence bars defined as
Given that any differences in the trajectories contains topological signatures, then
This equation implies that a persistent internal bias, that is, a persistent entropy that is originated from variations in internal states of the system or organisms.
Otherwise,
The matrix
Finally, when both
low relative persistence of data, that is.,
Thus, the goal is to estimate both the distortion matrix
As a reference, we have performed a simple test of the methodology using synthetic data from a predator/prey system of chemotactic cells with two kinds of responses in Supplementary Appendix 3. There we are able to show how with these method, we can stratify the distance between different background mechanisms generating the population dynamics and show how the estimated entropy accounts for the persistent bias that are associated to the difference of the intrinsic mechanisms of the chemotactic cells.
In the next section, we present our main results for the mhealth dataset.
Proof of Concept for Data Analysis
From the example presented in Supplementary Appendix 3, we learn that the methodology aims to group systems with similar topological signatures, suggesting that the underlying mechanisms and causal relationships are similar between systems 1 and 2. Of course, the method is able to detect the fact that system 1 (switching model) generates few topological signatures than that from system 2, affecting the size of the error bars. But within the period where the data are analyzed, the model correctly stratifies both datasets and identifies a low distortion in the data, suggesting that systems 1 and 2 have its own similar causal relationships.
In this section, we test the methodology using data containing physiological signals of patients. As has been suggested in other studies in animals, the physical activity is associated to changes of different physiological signals (like heart rate, arterial pressure, etc.) [31]. Furthermore, the heart response to exercise (macroscopic scale) has origin in complex molecular mechanisms, for instance, in subjects undergoing investigation for angina, some individuals with a low chronotropic index (a measure of heart rate response that corrects for exercise capacity) had impaired endothelial function, raised markers of systemic inflammation, and raised concentrations of N-terminal pro-brain natriuretic peptide (NT-proBNP) compared to those with a normal heart rate response [32].
Based on these notions, we assume that each individual generates a unique pattern for this integrated response due to the individual capacity—across several scales—to adapt and/or accommodate to changes in the environment, similar to the case presented in Figure 4 (in this case, the response to physical exercise).
The data used in this analysis have been obtained from the mobile health (mhealth) dataset [18], which comprises body motion and vital signs recordings of ten volunteers with diverse profile while performing several physical activities. Sensors placed on the subject’s chest, right wrist, and left ankle are used to measure the motion experienced by diverse body parts, namely, acceleration, rate of turn, and magnetic field orientation. The sensor positioned on the chest also provides 2-lead ECG measurements, which can be potentially used for basic heart monitoring, checking various arrhythmias, or looking at the effects of exercise on the ECG. These activities were monitored and collected in an out of lab environment with no constraints on how it must be executed, with the exception that the subject should try their best when executing them (see Figure 5).
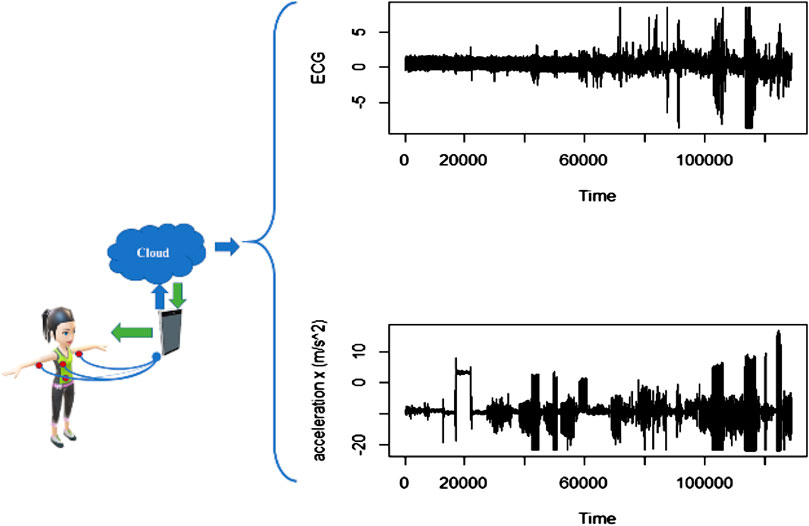
FIGURE 5. Exemplary data obtained from patients wearing sensors to measure ECG and acceleration in three axes (x, y, z).
Ideally, if this system is observable, then low persistent entropy (low inherent complexity) must lead to a quantitative description of the accelerations and ECGs.
The final raw data are analyzed when it is sampled in a phase space as
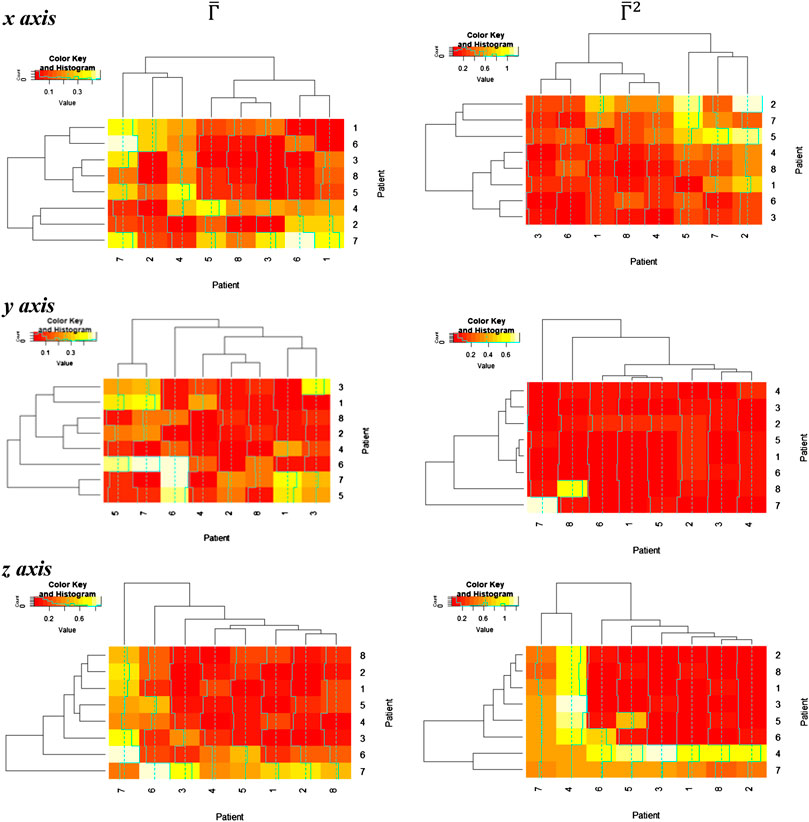
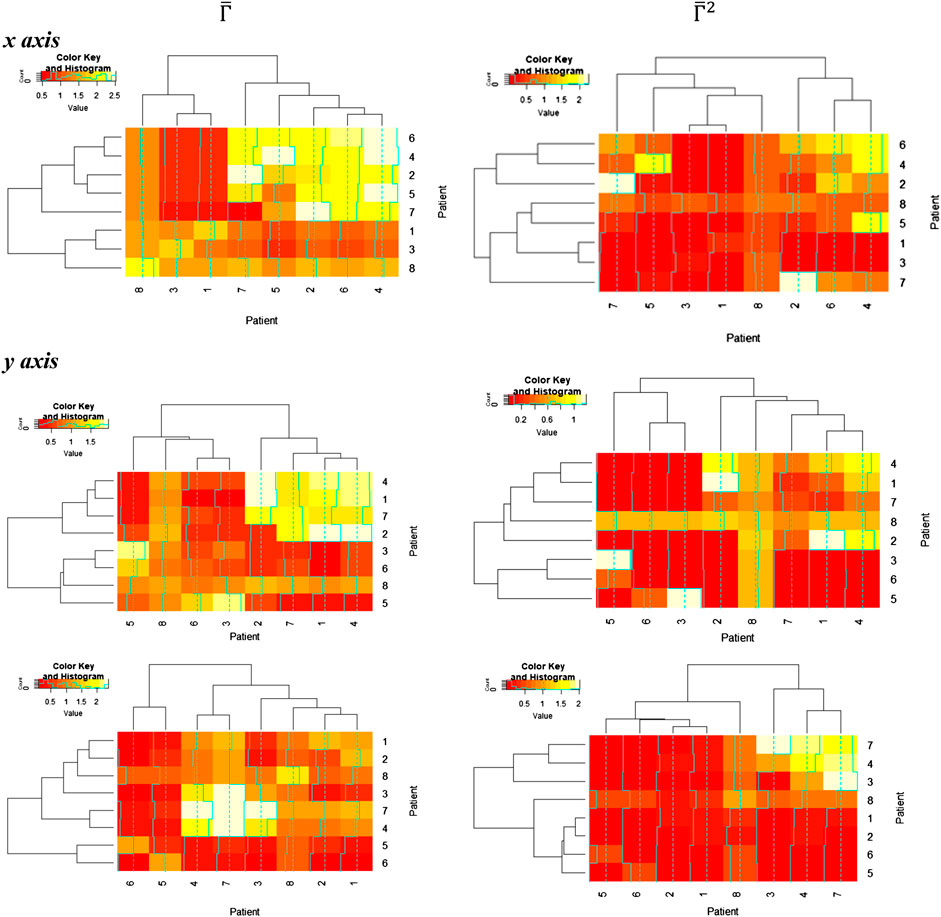
FIGURE 6. Distortion matrix
The homology groups were computed with the Dionysus software1 which included the TDA package in R language; the persistent homology has been measured over a triangular grid using the Gaussian kernel density estimator.
Thereafter, the relative distance between the homology groups
In these figures, we discover a relatively rich structure, with larger variations on the x axis (see also box plots in Supplementary Appendix 4). According to these results, there is a relatively low distortion of the response between patients, which is more evident on the y and z axes. On the other hand, we can extract groups of patients with high relative distortion, which are listed in Table 1.

TABLE 1. Patient groups with high variability from clusters in Figure 6.

TABLE 2. Patient groups with high variability from clusters in Figure 7.
We found that the seventh patient overlap all the groups, that is, that any quantitative prediction based on the rest of the population will deliver
However, the analysis of this relative entropy (Figure 7) is additionally required to perform a complete assessment, using the package “entropy” in R [33].
After computing the overlapping results between the groups, we find that patients 4, 2, and 7 also reoccur in all these groups. However, remnant differences in the entropy values indicate that persistent entropy remains for several patient groups, that is, that there is a persistent difference in the mechanisms leading to the response of each patient to physical exercise (Table 2).
These results are relevant when the mhealth data are used in the definition and training of predictive models. For example, activity recognition (AR) systems are typically built to recognize a predefined set of physical activities common in different applications, such as patient surveillance or as support systems to help individuals change or modify their habits. To this end, the data from the mhealth collection has been used to extract features and train AR models for the recognition of different physical activities such as walking, sitting, etc. [34]. However, when building a model, it is necessary to know whether the feature extraction can be generalized for any dataset and any new observations (low persistent entropy), or whether the model can only be generalized locally for selected datasets or observations [35]. Therefore, it is relevant to know if the dataset can be used to train models that can be validated over an entire patient population and be extrapolated to any new patient (extreme generalization), or can only be effectively used for specific subsamples of data (local generalization).
Our result helps to identify the degree of generalization of trained models and indicates that an AR model [34] can in principle be used for any patient excepting individuals with topological signatures similar to the seventh individual (and eventually, the second and fourth patients). These patients require a personalized approach, that is, persistent entropy in the data may be an indication of a heart failure or similar physiological impairments, which implies that AR models require additional features to account such individuals.
Discussion
The extraction of topological features is useful for pattern recognition and is an alternative to methods like 1-dimensional convolutional neural networks (CNNs) [36]. This methodology has been already used in different fields, particularly in biology and medicine, from the analysis and classification of tissue structures [11], to the analysis of time series in physiology [29] and thus can be considered as a kind of unsupervised learning machine with some advantages such as the following:
• It does not require large data samples to detect patterns in this data.
• It is much transparent in the way how patterns are computed in comparison to CNNs.
• It is robust against noise and data variations.
Topological persistence aims to identify structures in data and is suitable for pattern recognition. This technique is indeed used in Uniform Manifold Approximation and Projection for Dimension Reduction or topological autoencoders [37] for the optimization of deep learning methods. These approaches are based on local manifold approximations and patch together their local fuzzy simplicial set representations to construct a topological representation of a high-dimensional data [38], or they are used to identify topological signatures and using them as topological constraints while training deep neural networks [37]. Therefore, in these approaches, the estimation of topological signatures are used as constraints for an efficient training of neural networks, for instance, for image recognition [37], eventually improving the training and performance of deep learning models.
The present study follows a different strategy since we do not aim to implement a topological analysis to outperform current established methods for training of deep neural networks but to analyze and cluster topological signatures in the data, in this case, time series. Thus, the analysis of the topological signatures of the sampled data is helpful to better assess how a model can be generalized, for example, to estimate how other modeling methods for time series, like Long short-term memory models [36], can be generalized for the data analysis of novel datasets or for extrapolation of predictions.
Thus, we implemented this kind of pattern recognition to analyze the structure of sampled time series and to find out relative differences in order to
• assess the structure of time series,
• get hints about possible differences in underlying causal relations and intrinsic mechanisms, and
• help to drive the construction of predictive models since it allows the detection of implicit bias in the sampled data.
Therefore, instead of accumulating and managing very large datasets, it seems a better strategy is to first recognize which data collections are appropriate and balanced for training models that can be validated and reliable for further extrapolation, improving the safety (reliability) of the conclusions derived from models, while minimizing the amount of data used for model training. This means, an appropriate customization of models ab initio after assessing persistent bias is more efficient than the training of universal models on several datasets that will be problematic in its validation [39].2
We demonstrate that our method allows the analysis of sampled data which in turn helps to find out individual structures that can be interpreted as intrinsic bias. We tested this method in data collected from individuals performing physical activity (see Figures 6, 7).
Based on this result, we estimate the persistent entropy in synthetic vs. real data, thus helping us to assess if a model can be defined. The results suggested that few individuals probably require a customized model, that is, that the system is not completely observable. In this way, our method complements traditional modeling methods, such as the search of causal structures and deduction of network models [40] or the use of artificial intelligence techniques, to distinguish organisms that potentially cannot be reduced to canonical models [9].
However, the methodology has also some disadvantages:
• It generates large datasets for the analysis.
• It requires the fine tuning of parameters like the grid size where the analysis is performed.
• It is computationally intensive.
For this reason, extended analysis and optimization of the use of this technique in several datasets is required to further improve and standardize its applicability.
In this way, this method can either be used for direct pattern recognition and analysis of data structures or to pair it with other machine learning methods as a promising perspective to increase the effectiveness and safety of trained models [15], as already shown in autoencoders for image recognition [37]. This will be the subject of future research, in particular for automated workflows to autonomously estimate the generalization of a model.
Conclusion
The quantitative description of complex systems is limited from the internal states of the system from accessible data, which is in practice limited to a subset of variables. A system is called observable if we can reconstruct the system’s complete internal state from its outputs [20]. Under this assumption, it should be even possible to define optimal number of measurements in order to develop such quantitative descriptions.
In this research work, we have developed a method to qualitatively detect data imbalances by measuring the variability of the modeling error. If the data obtained from any organism’s trajectory has a persistent structure, that is, having low persistent entropy, then the variability of the modeling error is low, implying that a model can be identified and trained.
Otherwise, the errors in the model can not only be assigned to the sampling techniques and model selection but also to persistent entropy which has originated from constant intersystem variations in internal states (between individuals, organisms, or in general systems). This has an impact in the way how models and theoretical approaches are developed in any field, not only in biophysics but also in other complex fields like sociology and economics (in particular, in economic-socio physics, for instance, with complex networks), since persistent entropy values generated in intrinsic mechanisms limit the observation of the system.
This type of qualitative analysis prior to any data processing serves to better understand the data to be analyzed, as well as to avoid costly model formation. To detect persistent structures in trajectories, we have implemented methods using persistent topology for the analysis of time series [41], which have become a promising way to detect patterns in data different to entropy-based methods, combined with a clustering analysis. This methodology complements other methodologies like the measure the complexity of the data to be analyzed, using for instance, a Kolmogorov or a Chaitin complexity measurement [42] (see also Ref. 1; Discussion), together with the design of alternative learning architectures.
Our aim and vision was to use this method to alleviate problems like bias and disparity in big datasets used in train machines as well as the ever-increasing use of resources used in modeling and machine learning: the increasing processing and storage of information requires a lot of energy and resources that end up in the atmosphere in the form of greenhouse gases [44].3
In addition, this method provides the capability to better select data for training and indicates the possibility to introduce methods such as intelligent bias into the modeling process to reduce the amount of training data [39]. The concrete application of this method in the analysis of physiological data helps to characterize structural deviations of integrated data of a single individual from the rest of the population, which is relevant in machine learning and mathematical modeling in biology and medicine [9].
Of course, it is necessary to extensively test this methodology on different datasets and in different problems to get a better standardization. However, we have managed to demonstrate that this with method is possible to recognize structures in training data to have a better assessment of the possible differences in causal relationships, which is a relevant information for the derivation of models in complex systems (for instance in biology and medicine), and in general, for various applications in the field of artificial intelligence [3].
Data Availability Statement
Publicly available datasets were analyzed in this study. This data can be found here: https://archive.ics.uci.edu/ml/datasets/MHEALTH+Dataset.
Author Contributions
The author designed and implemented the theory and data analysis and wrote the article.
Conflict of Interest
The author JDO is employed by the company PerMediQ GmbH.
Acknowledgments
I want to thank the positive feedback of the referees as well as the editor, who helped me to sharpen and substantially improve this work.
Supplementary Material
The Supplementary Material for this article can be found online at: https://www.frontiersin.org/articles/10.3389/fphy.2020.465982/full#supplementary-material
Footnotes
1https://www.mrzv.org/software/dionysus/examples/rips.html#rips-example
2Therefore, we think that any research in machine learning do a better job by dealing with the natural symbiosis between information and life sciences, rather than try to simulate or imitate human cognitive capabilities.
3Regarding increasing concentration of greenhouse gases in the atmosphere, among them 6% are generated from computation, it results extremely important to develop methods to reduce the ecological impact of performing machine learning.
References
1. Paluš M, Vejmelka M. Directionality of coupling from bivariate time series: how to avoid false causalities and missed connections. Phys Rev E (2007). 75:056211. doi:10.1103/physreve.75.056211
2. Mao X, Shang P. Transfer entropy between multivariate time series. Commun Nonlinear Sci Numer Simulat (2017). 47:338–47. doi:10.1016/j.cnsns.2016.12.008.
3. Koh PW, Liang P. Understanding black-box predictions via influence functions. ArXiv170304730 Cs Stat (2017).
4. Banos O, Villalonga C, Garcia R, Saez A, Damas M, Holgado-Terriza JA, et al. . Design, implementation and validation of a novel open framework for agile development of mobile health applications. Biomed Eng Online. (2015). 14(Suppl. 2):S6. doi:10.1186/1475-925x-14-s2-s6.
5. Roper M, Fernando C, Chittka L. Insect bio-inspired neural network provides new evidence on how simple feature detectors can enable complex visual generalization and stimulus location invariance in the miniature brain of honeybees. PLoS Comput Biol (2017). 13:e1005333. doi:10.1371/journal.pcbi.1005333.
6. Rossetti S, Esposito J, Corlazzoli F, Gregorski A, Sacchi N. Entrainment of breast (cancer) epithelial cells detects distinct circadian oscillation patterns for clock and hormone receptor genes. Cell Cycle (2012). 11:350–60. doi:10.4161/cc.11.2.18792.
7. MacArthur BD, Ma’ayan A, Lemischka IR. Systems biology of stem cell fate and cellular reprogramming. Nat Rev Mol Cell Biol (2009). 10:672–81. doi:10.1038/nrm2766.
8. Diaz Ochoa JG. Elastic multi-scale mechanisms: computation and biological evolution. J Mol Evol (2018). 86:47–57. doi:10.1007/s00239-017-9823-7.
9. Zitnik M, Nguyen F, Wang B, Leskovec J, Goldenberg A, Hoffman MM. Machine learning for integrating data in biology and medicine: principles, practice, and opportunities. Inf Fusion (2019). 50:71–91. doi:10.1016/j.inffus.2018.09.012.
10. Ghrist R. Barcodes: the persistent topology of data. Bull Am Math Soc (2008). 45:61–75. doi:10.1090/s0273-0979-07-01191-3
11. Lawson P, Sholl AB, Brown JQ, Fasy BT, Wenk C. Persistent homology for the quantitative evaluation of architectural features in prostate cancer histology. Sci Rep (2019). 9:1139. doi:10.1038/s41598-018-36798-y.
12. Stolz BJ, Harrington HA, Porter MA. Persistent homology of time-dependent functional networks constructed from coupled time series. Chaos (2017). 27:047410. doi:10.1063/1.4978997.
13. Xia K, Wei G-W. Persistent homology analysis of protein structure, flexibility, and folding. Int J Numer Method Biomed Eng (2014). 30:814–44. doi:10.1002/cnm.2655.
14. Horak D, Maletić S, Rajković M. Persistent homology of complex networks. J Stat Mech (2009). 2009:P03034. doi:10.1088/1742-5468/2009/03/p03034
15. Townsend J, Micucci CP, Hymel JH, Maroulas V, Vogiatzis KD. Representation of molecular structures with persistent homology for machine learning applications in chemistry. Nat Commun (2020). 11:3230. doi:10.1038/s41467-020-17423-x.
16. Emrani S, Gentimis T, Krim H. Persistent homology of delay embeddings and its application to wheeze detection. IEEE Signal Process Lett (2014). 21:459–63. doi:10.1109/lsp.2014.2305700
17. Nicolau M, Levine AJ, Carlsson G. Topology based data analysis identifies a subgroup of breast cancers with a unique mutational profile and excellent survival. Proc Natl Acad Sci USA (2011). 108:7265–70. doi:10.1073/pnas.1102826108.
18. Banos O, Villalonga C, Garcia R, Saez A, Damas M, Holgado-Terriza JA, et al. Design, implementation and validation of a novel open framework for agile development of mobile health applications. Biomed Eng Online (2015). 14(Suppl. 2):S6. doi:10.1186/1475-925x-14-s2-s6.
19. Hastie T, Tibshirani R, Friedman J. The elements of statistical learning: data mining, inference, and prediction. 2nd ed. New York, NY: Springer (2009).
20. Liu Y-Y, Slotine J-J, Barabási A-L. Observability of complex systems. Proc Natl Acad Sci USA (2013). 110:2460–5. doi:10.1073/pnas.1215508110.
21. Atienza N, Escudero LM, Jimenez MJ, Soriano-Trigueros M. Persistent entropy: a scale-invariant topological statistic for analyzing cell arrangements. ArXiv190206467 Cs (2019).
22. Takens F. Detecting strange attractors in turbulence. In: D, Rand, and L-S, Young, editors Dynamical systems and turbulence, warwick 1980. Springer Berlin Heidelberg (1981). p. 366–81.
23. Emrani S, Chintakunta H, Krim H. Real time detection of harmonic structure: a case for topological signal analysis. In: 2014 IEEE international conference on acoustics, speech and signal processing (ICASSP) (2014). p. 3445–9.
24. Edelsbrunner H, Letscher D, Zomorodian A. Topological persistence and simplification. In: Proceedings 41st annual symposium on foundations of computer science (2000). p. 454–63.
27. Edelsbrunner H. Computational topology: an introduction. Providence, RI: American Mathematical Society (2010).
28. Pun CS, Xia K, Lee SX. Persistent-homology-based machine learning and its applications–a survey. ArXiv181100252 Math (2018).
29. Pereira CMM, de Mello RF. Persistent homology for time series and spatial data clustering. Expert Syst Appl (2015). 42:6026–38. doi:10.1016/j.eswa.2015.04.010
30. Fasy BT, Lecci F, Rinaldo A, Wasserman L, Balakrishnan S, Singh A. Confidence sets for persistence diagrams. Ann Stat (2014). 42:2301–39. doi:10.1214/14-aos1252.
31. Miyata K, Kuwaki T, Ootsuka Y. The integrated ultradian organization of behavior and physiology in mice and the contribution of orexin to the ultradian patterning. Neuroscience (2016). 334:119–33. doi:10.1016/j.neuroscience.2016.07.041.
32. Routledge HC, Townend JN. Why does the heart rate response to exercise predict adverse cardiac events? Heart (2006). 92:577–8. doi:10.1136/hrt.2005.079400.
33. Hausser J, Strimmer K. Entropy inference and the James-Stein estimator, with application to nonlinear gene association networks. J Mach Learn Res (2009). 10:1469–84
34. Nguyen LT, Zeng M, Tague P, Zhang J. Recognizing new activities with limited training data. In: Proceedings of the 2015 ACM international symposium on wearable computers. New York, NY: Association for Computing Machinery (2015). p. 67–74.
35. Chollet F. Deep learning mit python und keras: das praxis-handbuch vom entwickler der keras-Bibliothek. Frechen: mitp (2018).
37. Moor M, Horn M, Rieck B, Borgwardt K. Topological autoencoders. ArXiv190600722 Cs Math Stat (2020).
38. McInnes L, Healy J, Melville J. UMAP: uniform manifold approximation and projection for dimension reduction. ArXiv180203426 Cs Stat (2018).
39. Taniguchi H, Sato H, Shirakawa T. A machine learning model with human cognitive biases capable of learning from small and biased datasets. Sci Rep (2018). 8:7397. doi:10.1038/s41598-018-25679-z.
40. Barabási A-L, Bonabeau E. Scale-free networks. Sci Am (2003). 288:50–9. doi:10.1038/scientificamerican0503-60.
41. Maletić S, Zhao Y, Rajković M. Persistent topological features of dynamical systems. Chaos Interdiscip J Nonlinear Sci (2016). 26:053105. doi:10.1063/1.4949472
42. Chaitin GJ. Information-theoretic limitations of formal systems. J ACM (1974). 21:403–24. doi:10.1145/321832.321839.
43. Adriaans P. Information. In: EN, Zalta, editor The stanford encyclopedia of philosophy. Metaphysics Research Lab, Stanford University (2018).
44. Malmodin J, Lundén D. The energy and carbon footprint of the global ICT and E&M sectors 2010-2015. Sustainability (2018). 10:3027. doi:10.3390/su10093027.
Keywords: Persistent Homology, Machine Learning, Persistent Entropy, Time Series, Complex Systems, Modelling, Medicine and Biology
Citation: Diaz Ochoa JG (2020) Observability of Complex Systems by Means of Relative Distances Between Homological Groups. Front. Phys. 8:465982. doi: 10.3389/fphy.2020.465982
Received: 20 June 2019; Accepted: 30 September 2020;
Published: 17 December 2020.
Edited by:
Jae-Hyung Jeon, Pohang University of Science and Technology, South KoreaReviewed by:
Bela Mulder, Fundamental Research on Matter Institute for Atomic and Molecular Physics (NWO), NetherlandsTaegeun Song, Pohang University of Science and Technology, South Korea
Copyright © 2020 Diaz Ochoa. This is an open-access article distributed under the terms of the Creative Commons Attribution License (CC BY). The use, distribution or reproduction in other forums is permitted, provided the original author(s) and the copyright owner(s) are credited and that the original publication in this journal is cited, in accordance with accepted academic practice. No use, distribution or reproduction is permitted which does not comply with these terms.
*Correspondence: Juan G. Diaz Ochoa, anVhbi5kaWF6QHBlcm1lZGlxLmRl
 Juan G. Diaz Ochoa