 Bernardo A. Mello
94% of researchers rate our articles as excellent or good
Learn more about the work of our research integrity team to safeguard the quality of each article we publish.
Find out more
BRIEF RESEARCH REPORT article
Front. Phys. , 10 September 2020
Sec. Interdisciplinary Physics
Volume 8 - 2020 | https://doi.org/10.3389/fphy.2020.00376
This article is part of the Research Topic 2021 Frontiers in Physics Editor's pick View all 20 articles
Minimizing social contact is an important tool to reduce the spread of diseases but harms people's well-being. This and other more compelling reasons urge people to walk outside periodically. The present work explores how organizing the traffic of pedestrians affects the number of walking or running people passing by each other. By applying certain rules, this number can be significantly reduced, potentially reducing the contribution of person-to-person contagion to the basic reproductive number, R0. One example is the traffic of pedestrians on sidewalks. Another is the use of walking or running tracks in parks. It is obtained here that the number of people encountering each other can be drastically reduced if one-way traffic is enforced and runners are separated from walkers.
Contagious epidemics, as the Covid-19 pandemic, often demand limiting physical interactions among people in order to reduce the contagious rate. Governmental measures to reduce physical contact range from the closing of public facilities and schools to restrictions on mobility, lockdowns, quarantines, and curfews. These extreme measures, though necessary, should be used as last resources, due to their economic and personal negative impacts. Of great help in these situations are the physical and psychological benefits of physical exercises, walking included [1, 2]. On the other hand, physical contact and proximity should be avoided to reduce the spread of pathogens such as SARS-CoV-2 [3].
Measures that reduce the physical interaction with minimal disruption in the daily activities, as the ones proposed here, must be adopted whenever possible. For example, if sidewalks and crosswalks at intersections are made one-way, with walking only allowed on the right-hand ones (the street must be at pedestrians' left), the major inconvenience would be one more block of walking for pedestrians when leaving their starting points or reaching their destinations.
Pedestrian behavior depends on internal and external aspects such as urban environment, contingent individual situation, and crowd behavior [4–6], which must all be considered when planning traffic interventions. Sophisticated methods have been proposed to study pedestrian motion [7–9] and used, for example, to study the efficiency of pedestrian mobility [10]. Mostly, the studies on urban mobility have been concentrated on efficiency, well-being, safety, and other relevant aspects of daily life [11–13].
The present work addresses a completely different goal, which is only justifiable in abnormal circumstances, such as epidemics: minimizing the encounters among pedestrians. The conceptual problem is much simpler, since the interpersonal effect on mobility is not relevant due to the low density of people, justifying the use of a more “pedestrian” mathematical model.
Figure 1 illustrates the movement of three walkers on a circular track. The first encounter occurs between t = 0.8 and 1.0, involving two walkers moving in the same direction, the faster red overtaking the slower green. The second encounter occurs between t = 1.0 and 1.2, between the blue and the red walkers that move in opposite directions. Video 1, available in the Supplementary Material, features the movement of these walkers.
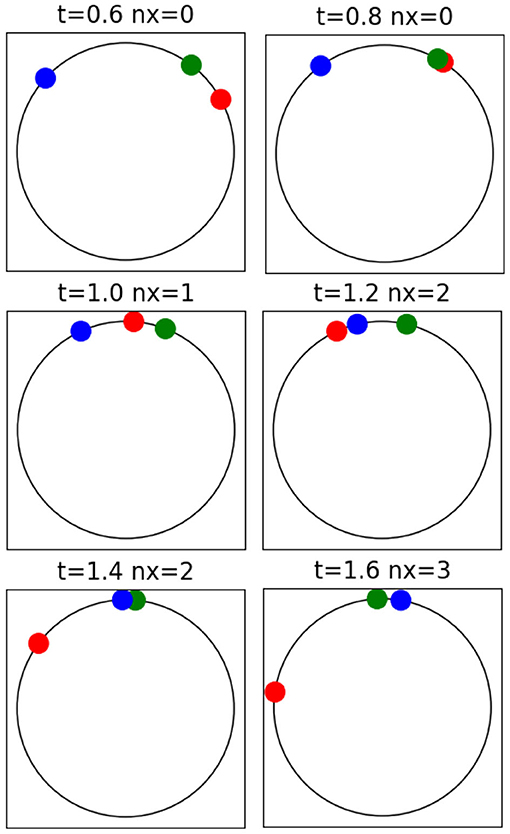
Figure 1. Example of encounters between walkers on a circular track. The blue walker moves in the clockwise direction and the green and the red walkers move in the counter-clockwise direction, the red walker moves faster than the green. The time and the number of encounters up to that instant are shown above each figure.
The encounter of walkers moving in the same direction is due to different speeds, and its frequency is reduced if the walkers walk at a similar rate, regardless of fast or slow. On the other hand, the encounter frequency of walkers moving in opposite directions is proportional to the average of their absolute speeds, regardless of the difference in their absolute values.
To represent the movement of a crowd, the initial position is supposed to be random and uniformly distributed over the track. Measures of walking speed in several conditions presented in [14] were used to adopt the mean value of 1.4 m/s with the standard deviation of 0.25 m/s for the walking speed. From [15], the running speed is assumed to be twice these values, i.e., an average of 2.8 m/s and a standard deviation of 0.5 m/s. Random and constant speeds with normal distribution are assigned to the walkers and runners, with the corresponding average and standard deviation. When minimum or maximum speed were imposed, the speed of individuals under or above these limits was redefined as equal to the boundary values.
Two measures are proposed to evaluate the number of encounters per person. One is the number of encounters per minute, that is suitable to evaluate the encounters of a person who goes out for a given amount of time, for example, for jogging. The other is the number of encounters when a person walks along 100 m, typically, the length of one block. This is suitable for the analysis of a person who goes out to reach a certain place.
Consider two people with constant speeds v and v′ moving around a closed path of length L. If they stay on the track long enough, they will cross each other with a common temporal frequency
If N people with constant speeds distribution p(v) share the same track, the average frequency of encounters of a person with speed v is
and the population average is
Another relevant quantity is the spatial frequency, the number of encounters by unit of length of the distance traveled by the particle with speed v, given by
From this we can define the person and the population averages,
The number of encounters may not be the best quantity to evaluate the probability of contagion if two people encounter more than once when traveling along a short track. Encountering the same person twice is not the same as encountering two people, one time each. Despite the same number of encounters, in the latter case the probability of meeting a contagious person is higher.
In the situation analyzed here, all people spend the same time τ on the track, entering and leaving it at the same rate, N/τ, which leads to the mean occupancy N. The number of people who visit the track at a time window [t0, t0 + τ] is 2N, consisting of the people who arrive in the time interval [t0−τ, t0 + τ]. Of the time that each of those people stay on the track, a time τ′ is spent inside the time window [t0, t0 + τ], with the uniform probability density τ−1 in the interval 0 < τ′ < τ. Accordingly, a person on the track will share it with 2(N−1) other people during the total time of his/her visit, and the time shared with those people will be in the interval 0 < τ′ < τ with probability density τ−1.
If two people with speeds v and v′ share the same track for a time τ′, the probability that they will meet each other at least once is
For any two people on the track, the probability of meeting at least once is
From the above expression, the diversity coefficient of encounters is defined as the fraction of non-repeated encounters,
The factor 2 in Equation (10) comes from the above discussion about the number of different people that enter or leave the track in the course of the time τ. For the population, the fraction of non-repeated encounters is
Complementary to the analytical approach presented in section 2.2, Monte Carlo simulation was used to describe a closed track with N individuals, and a random generator with a uniform distribution over the track length was used to define their position. The time evolution was performed by Euler integration with constant Δt. From the number of encounters of each individual, × i, the mean number of encounters per minute and per 100 m were, respectively, calculated as
and
where Tsim is the total simulation time in minutes, and Li is the distance traveled by the individual i, in hectometers. The expected values (ensemble average) of these quantities are equal to the frequencies Equations (3) and (6),
with the proper units of time and distance.
As a concrete case of the analysis presented here, one can consider a 5,000 m track shared by 500 people. The results are the average number of encounters per person at each minute or each block (100 m), calculated by numerical integration of the expressions from section 2.2. These two quantities are proportional to the average density of people on the track, in this case, 1 person at every 10 m, and do not depend on the simulation time or the track length and shape. Proportionality may be used to determine these quantities for other densities.
We start with equal numbers of people moving in both directions of a track, 80% of them walking and 20% running. These percentages were arbitrarily chosen but the results are qualitatively equivalent for other values. The distribution of their speeds is shown in Figure 2A, together with the number of encounters per minute and per 100 m. It can be seen that the fast runners run by several people per minute, but have a minimal number of encounters along 100 m since they cover that distance quickly. A slow walker, on the other hand, exhibits the opposite behavior, for reverse reasons.
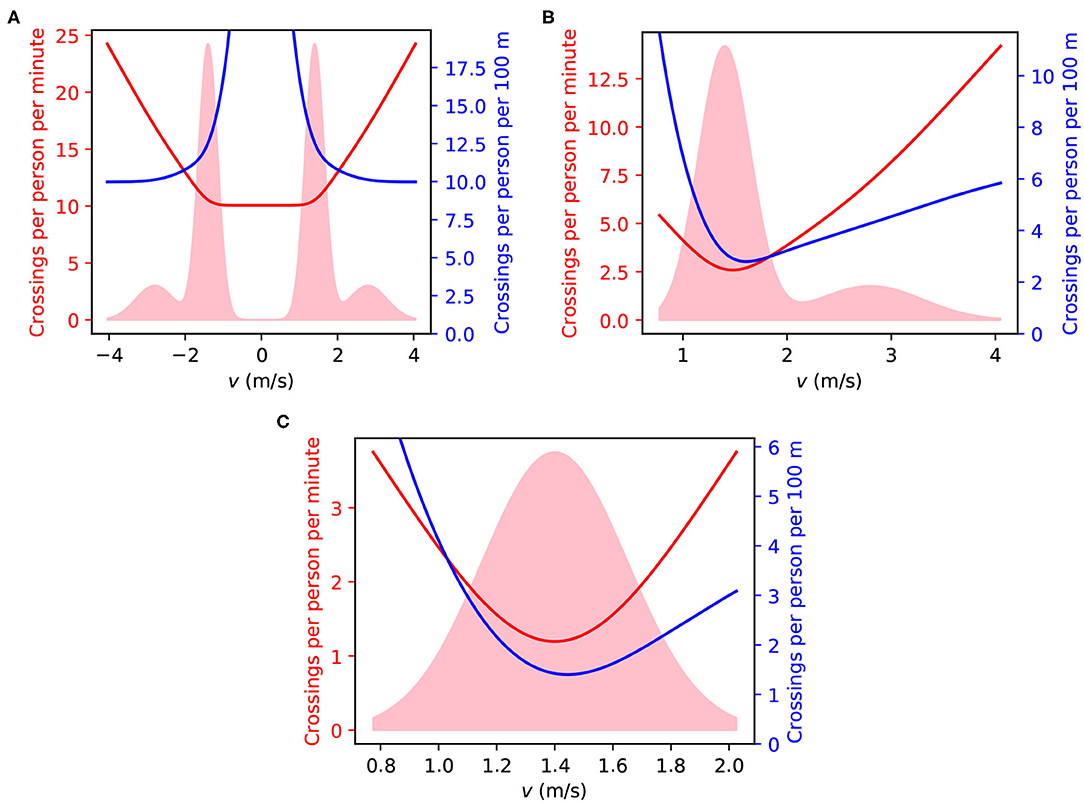
Figure 2. (A) Analysis of a track with 100 people per kilometer, 80% of them walking and 20% of them running, in both directions. The speed distribution is shown as the pink area in arbitrary units. The red curve is the average number of encounters per minute for people moving at a certain speed, given by Equation (2). The blue curve is the average number of encounters per 100 m for people moving at a certain speed, given by Equation (5). (B) Same as (A), with one-way enforced. (C) Same as (A) with one-way enforced and running forbidden. For illustration, Videos 2–4, representing 50 people in a 5,000 m track under the same rules can be found in the Supplementary Material.
To reduce the number of encounters observed in Figure 2A, we enforce unidirectional movement, illustrated by Figure 2B. To evaluate the effect on the crowd, we refer to the average values, Equations (3) and (6), shown in Table 1. By comparing the bidirectional and the unidirectional columns of line 3 in Table 1, it can be seen that the number of encounters per minute and per 100 m are both reduced by 68%, to around one-third of their values in bidirectional traffic.
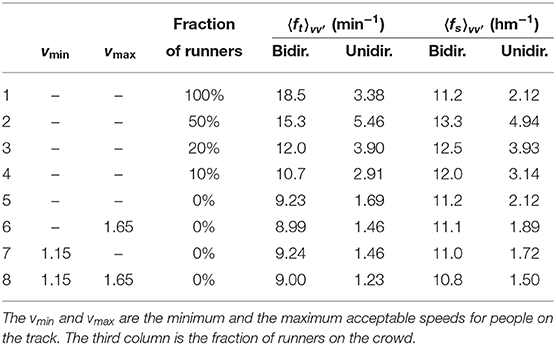
Table 1. The average number of encounters per minute and per 100 m for a track with 100 people per kilometer subjected to different conditions, as defined by Equations (3) and (6).
The encounters between people moving unidirectionally are due to their heterogeneous speed, which can be made more homogeneous by separating runners and walkers. Encounters of walkers are shown in Figure 2C. By comparing the columns of unidirectional encounters of lines 3 and 5 of Table 1, we find a contraction to 43% and 54%, respectively, of the number of encounters per minute and per 100 m.
Line 1 of Table 1 shows the average number of encounters for a track where only runners are allowed. As predicted by Equations (3) and (6), comparison of the runners on line 1 with the walkers on line 5 of Table 1 shows that the number of encounters per 100 m is the same for walkers and runners, but the number of encounters per minute is twice bigger for runners. Therefore, the density on a track of runners must be half of that of walkers to produce the same number of encounters per minute, but equal densities produce identical numbers of encounters per 100 m in tracks exclusive for runners or walkers.
Further reduction in the encounter rates can be achieved by imposing minimum and maximum walking speeds, for example, to no more and no less than one standard deviation of the average speed. Reductions of 30% are obtained, as can be seen by comparing the unidirectional encounters of lines 5 and 8 in Table 1. The modest improvement and the practical difficulties of imposing such measures suggest that they are not workable.
The fraction of non-repeated encounters between two people is measured by the diversity coefficient, Equation (11), plotted in Figure 3 for a runner and a walker. If the track is large enough to prevent multiple encounters, |v−v′| < L/τ, the diversity coefficient is 1, indicating that every encounter of a person involves different people. For shorter tracks, each pair of people may meet each other several times, and the coefficient of diversity is reduced.
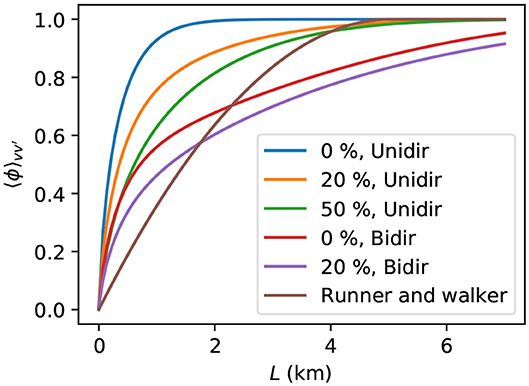
Figure 3. Coefficient of diversity of the encounters, defined by Equation (12), with the fraction of runners and the direction indicated in the legend. The curve for one runner and one walker, with velocities respectively equal to 2.8 and 1.4 m/s in the same direction, uses Equation (11).
Figure 3 shows that the diversity coefficient is bigger for a crowd equally divided between runners and walkers than for one runner and one walker, because the presence of people with similar speed diminishes the chances of repeated encounters. As a general rule, the analysis of Figure 3 demonstrates that more uniform speed distributions lead to higher diversity coefficients. However, if the track is long enough, the number of repeated encounters vanishes and the diversity coefficient reaches its maximum value, .
Transmission of diseases involves a multitude of aspects and this work addresses just one of them, the number of people met. This information is important to evaluate the probability of encounters with infected people, of physical contacts, and of meeting and interacting with acquaintances.
Recent results on aerodynamics indicate that a trail of potentially contagious droplets is left behind walking and running people [16]. The probability of contagion depends on the level of exposure to the pathogen [17], which is proportional to the density of pathogens on that cloud and to the time spent inside the trail of droplets. This aspect is not covered in this paper and will be addressed in a subsequent work.
Regarding the organization of pedestrian traffic, if one-way movement and walking-only rules are imposed on bidirectional tracks shared by walkers (80%) and runners (20%), the number of people encountering each other per minute is reduced to one-seventh of its original value and the number of encounters per 100 m is reduced to one-sixth of its original value. If one-way movement is imposed on a walking-only walkway, or sidewalks, for example, the number of encounters is reduced to one-fifth of its original value. The improvements are also significant for running-only tracks. Therefore, establishing one-way walkways and separating runners from walkers are effective measures to reduce the physical encounter of people during contagious epidemics.
To avoid complicating the discussion, this paper focuses on closed paths. Open paths, such as trajectories of pedestrians reaching a destination in cities, or of joggers in roads, may be considered very large closed paths partially traveled by each individual. The frequency of encounters discussed here depends only on the density and the conclusion regarding these quantities hold also for open tracks. For open or very large tracks, the chance of multiple encounters is zero, the diversity coefficient is one, and only the frequency of encounters matters.
From the biological point of view, contagion is also related to the variability of the host [18] and pathogen [19], which depends on the number of people met. On short tracks, measures that reduce the number of crossings also increase the diversity coefficient of the encounters. The product of these two quantities provides the number of different people met. On the one hand, higher diversity increases the chance of meeting someone infected. On the other hand, repeated encounters with the same person increase the pathogen doses received from infected people. This paper provides the tools to quantify these two effects, but proper decisions about the suitability of each measure can only be made considering the dynamics of each disease.
The original contributions presented in the study are included in the article/Supplementary Material, further inquiries can be directed to the corresponding author.
BM proposed the work, developed the model, wrote the code, ran the simulations, did the analysis, and wrote the paper.
The author declares that the research was conducted in the absence of any commercial or financial relationships that could be construed as a potential conflict of interest.
The Supplementary Material for this article can be found online at: https://www.frontiersin.org/articles/10.3389/fphy.2020.00376/full#supplementary-material
Supplementary Video 1. Simulation of two walkers (green and blue) and a runner (red) in a 5,000 m long circular track for one hour. The simulation time and the total number of encounters are shown.
Supplementary Video 2. Simulation of 50 walkers and runners in a 5,000 m long circular track for one hour, moving in both directions. The simulation time and the total number of encounters are shown.
Supplementary Video 3. Simulation of 50 walkers and runners in a 5,000 m long circular track for one hour, moving only in the counter-clockwise direction. The simulation time and the total number of encounters are shown.
Supplementary Video 4. Simulation of 50 walkers in a 5,000 m long circular track for one hour, moving only in the counter-clockwise direction. The simulation time and the total number of encounters are shown.
1. Lee IM, Buchner DM. The importance of walking to public health. Med Sci Sports Exerc. (2008) 40:S512–8. doi: 10.1249/MSS.0b013e31817c65d0
2. Roe J, Aspinall P. The restorative benefits of walking in urban and rural settings in adults with good and poor mental health. Health Place. (2011) 17:103–13. doi: 10.1016/j.healthplace.2010.09.003
3. Sohrabi C, Alsafi Z, O'Neill N, Khan M, Kerwan A, Al-Jabir A, et al. World Health Organization declares global emergency: a review of the 2019 novel coronavirus (COVID-19). Int J Surg. (2020) 76:71–76. doi: 10.1016/j.ijsu.2020.02.034
4. Zacharias J. Pedestrian behavior pedestrian behavior and perception in urban walking environments. J Plann Literat. (2001) 16:3–18. doi: 10.1177/08854120122093249
5. Seitz MJ, Bode NW, Köster G. How cognitive heuristics can explain social interactions in spatial movement. J R Soc Interface. (2016) 13:20160439. doi: 10.1098/rsif.2016.0439
6. von Sivers I, Templeton A, Köster G, Drury J, Philippides A. Humans do not always act selfishly: social identity and helping in emergency evacuation simulation. Transport Res Proc. (2014) 2:585–93. doi: 10.1016/j.trpro.2014.09.099
7. Von Sivers I, Köster G. Dynamic stride length adaptation according to utility and personal space. Transport Res B Methodol. (2015) 74:104–17. doi: 10.1016/j.trb.2015.01.009
8. Seitz MJ, Köster G. Natural discretization of pedestrian movement in continuous space. Phys Rev E. (2012) 86:046108. doi: 10.1103/PhysRevE.86.046108
9. Feliciani C, Nishinari K. An improved Cellular Automata model to simulate the behavior of high density crowd and validation by experimental data. Phys A Stat Mech Appl. (2016) 451:135–48. doi: 10.1016/j.physa.2016.01.057
10. Davidich M, Köster G. Predicting pedestrian flow: a methodology and a proof of concept based on real-life data. PLoS ONE. (2013) 8:e83355. doi: 10.1371/journal.pone.0083355
11. Goodwin P. Transformation of transport policy in Great Britain. Transport Res A Policy Pract. (1999) 33:655–69. doi: 10.1016/S0965-8564(99)00011-7
12. Middleton J. Sense and the city: exploring the embodied geographies of urban walking. Soc Cult Geogr. (2010) 11:575–96. doi: 10.1080/14649365.2010.497913
13. St-Louis E, Manaugh K, van Lierop D, El-Geneidy A. The happy commuter: a comparison of commuter satisfaction across modes. Transport Res F Traffic Psychol Behav. (2014) 26:160–70. doi: 10.1016/j.trf.2014.07.004
14. Chandra S, Bharti AK. Speed distribution curves for pedestrians during walking and crossing. Proc Soc Behav Sci. (2013) 104:660–7. doi: 10.1016/j.sbspro.2013.11.160
15. Smyth B. Fast starters and slow finishers: a large-scale data analysis of pacing at the beginning and end of the marathon for recreational runners. J Sports Anal. (2018) 4:229–42. doi: 10.3233/JSA-170205
16. Blocken B, Malizia F, van Druenen T, Marchal T. Towards aerodynamically equivalent COVID19 1.5 m social distancing for walking and running. Preprint. (2020). Available online at: https://api.semanticscholar.org/CorpusID:215752493
17. Hall CB, Douglas R, Schnabel KC, Geiman JM. Infectivity of respiratory syncytial virus by various routes of inoculation. Infect Immun. (1981) 33:779–83. doi: 10.1128/IAI.33.3.779-783.1981
18. Ajelli M, Moise IK, Hutchings TCS, Brown SC, Kumar N, Johnson NF, et al. Host outdoor exposure variability affects the transmission and spread of Zika virus: Insights for epidemic control. PLoS Negl Trop Dis. (2017) 11:e0005851. doi: 10.1371/journal.pntd.0005851
Keywords: epidemics, pedestrians, jogging, urban mobility, basic reproductive number
Citation: Mello BA (2020) One-Way Pedestrian Traffic Is a Means of Reducing Personal Encounters in Epidemics. Front. Phys. 8:376. doi: 10.3389/fphy.2020.00376
Received: 11 May 2020; Accepted: 03 August 2020;
Published: 10 September 2020.
Edited by:
Víctor M. Eguíluz, Institute of Interdisciplinary Physics and Complex Systems (IFISC), SpainReviewed by:
Nicolas Francisco Lori, University of Minho, PortugalCopyright © 2020 Mello. This is an open-access article distributed under the terms of the Creative Commons Attribution License (CC BY). The use, distribution or reproduction in other forums is permitted, provided the original author(s) and the copyright owner(s) are credited and that the original publication in this journal is cited, in accordance with accepted academic practice. No use, distribution or reproduction is permitted which does not comply with these terms.
*Correspondence: Bernardo A. Mello, YmVybmFyZG9tZWxsb0B1bmIuYnI=
Disclaimer: All claims expressed in this article are solely those of the authors and do not necessarily represent those of their affiliated organizations, or those of the publisher, the editors and the reviewers. Any product that may be evaluated in this article or claim that may be made by its manufacturer is not guaranteed or endorsed by the publisher.
Research integrity at Frontiers
Learn more about the work of our research integrity team to safeguard the quality of each article we publish.