- 1Complex Systems Research Center, Shanxi University, Taiyuan, China
- 2Shanxi Key Laboratory of Mathematical Techniques and Big Data Analysis on Disease Control and Prevention, Taiyuan, China
- 3College of Mathematics, Taiyuan University of Technology, Taiyuan, China
- 4School of Mathematical Sciences, Shanxi University, Taiyuan, China
As of July 21, 2020, the coronavirus SARS-CoV-2 had spread to almost all countries around the world and caused more than 14.8 million confirmed cases, owing to its high transmissibility and fast rate of spread. Of the infected locations, the Diamond Princess cruise ship is special in that it is an isolated system with a population highly concentrated in a limited space, providing particularly favorable conditions for the transmission of the novel coronavirus-associated pneumonia, COVID-19. The Japanese government's emergency measures for controlling the spread of COVID-19 on the cruise ship have also been questioned. In this paper we develop a homogeneous mixed difference system to describe the mechanism of transmission of COVID-19 on the cruise ship, reverse-predict the epidemic transmission trend from January 20 to February 20, 2020, including the daily number of infected people and the peak time of infection, estimate the range of the basic reproduction number of virus transmission on the cruise ship, and assess the effects of prevention and control measures. It is concluded that the isolation of people, along with rapid and comprehensive detection of infections, play an important role in controlling the epidemic. In fact, the Japanese government's emergency measures did have a certain effect on limiting the spread of COVID-19, but the number of infected people could have been reduced by at least 60% if all personnel on the cruise ship had been tested and isolated promptly as early as February 5.
1. Introduction
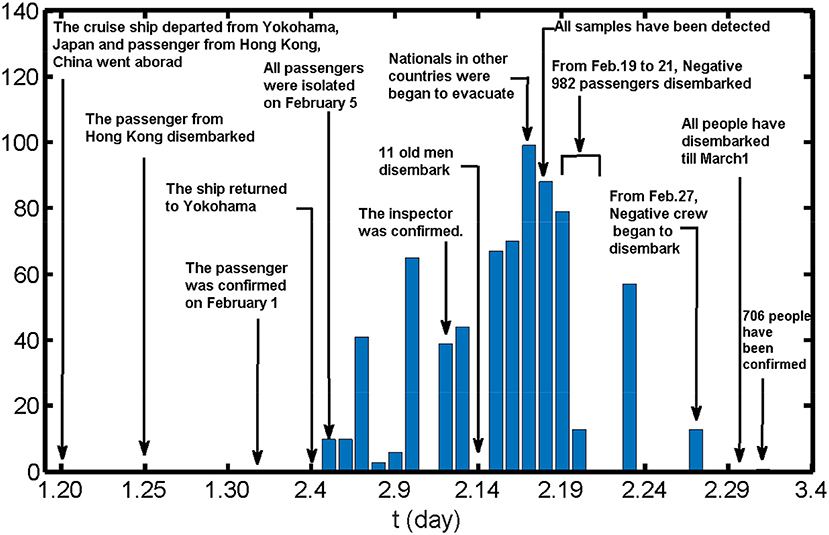
Since December 2019 a new coronavirus pneumonia, named COVID-19, has spread menacingly quickly and invaded more than 200 countries, infecting over 14.8 million people and causing more than 600,000 deaths by July 21, 2020. Among the infected places, the Diamond Princess cruise ship is a special case; the course of development of the epidemic on the ship is shown in Figure 1. On January 20, the Diamond Princess departed from Yokohama, Japan, and a passenger from Hong Kong embarked. The passenger disembarked in Hong Kong on January 25 and was confirmed to be infected with SARS-CoV-2 on February 1. The Diamond Princess, which was scheduled to return to Yokohama on February 5, arrived ahead of time on February 4 and was subjected to quarantine and inspection. According to requirements of the Ministry of Health, Labor and Welfare of Japan, from February 5 all passengers on the Diamond Princess had to be isolated in their cabins for 14 days. During the quarantine period, passengers and crew were tested in batches irregularly, and individuals confirmed to be positive for COVID-19 were to disembark for treatment at designated institutions in Japan. With the comprehensive implementation of systematic detection starting from February 14, all testing work was completed on February 18. Meanwhile, from February 17, other countries began to evacuate their nationals on chartered flights. From February 19, passengers who tested negative and in whose room there were no confirmed cases were allowed to disembark. From February 27, the crew of the cruise ship began to disembark and were sent to Saitama prefecture and Hikari city in Japan to be isolated for 14 days. By March 1, all people had disembarked from the cruise ship. Eventually, a total of 721 on the Diamond Princess were reported to be infected with SARS-CoV-2.
During the initial phase of infection on the cruise ship, the Japanese government did not pay enough attention to the outbreak and did not test, survey, evacuate, or isolate people in a timely fashion, but only asked passengers to isolate themselves in their cabins, and continued to allow air to be circulated on the ship through the central air-conditioning system. Siqi Sun, a lecturer at Shanghai Maritime University and the author of the book Cruise Tourism Law Thesis, has said that this is the most complex crisis in the history of cruises since the Titanic event in 1909 [1]. In the present work, we aim to use mathematical methods [2] to elucidate the mechanism of COVID-19 transmission on the Diamond Princess cruise ship, and thus provide a theoretical basis for guidance on epidemic prevention and control in similar closed systems.
At the early stage of the epidemic on the Diamond Princess, information about the outbreak was limited to daily detected and confirmed cases. However, the sampling method and the proportion of inspected samples were irregular, so it is difficult to capture the pattern of the epidemic during the early stage, let alone use it to predict the later development of the epidemic. However, by May 2020 all cases of infection had been confirmed. Therefore, based on the final cumulative number of confirmed cases, the transmission trend of the epidemic from January 20 to February 20 can be reverse-predicted and evaluated. For this purpose, considering that the mode of contact between people on the ship is close to uniform mixing, we derive a homogeneous mixing difference equation to describe the transmission mechanism of COVID-19 on the ship, with the goal of understanding the characteristics of epidemic transmission in a confined space. In addition, we estimate the number of people infected by the Hong Kong passenger from January 20 to January 25, the number of people who had been infected by February 5 when isolation measures were put in place, and the peak time and peak value of the epidemic on the cruise ship. Moreover, we estimate the basic reproduction number of the spread of COVID-19 on the ship. Finally, we assess the effects of the isolation measures taken by the Japanese government.
2. Materials and Methods
2.1. Materials
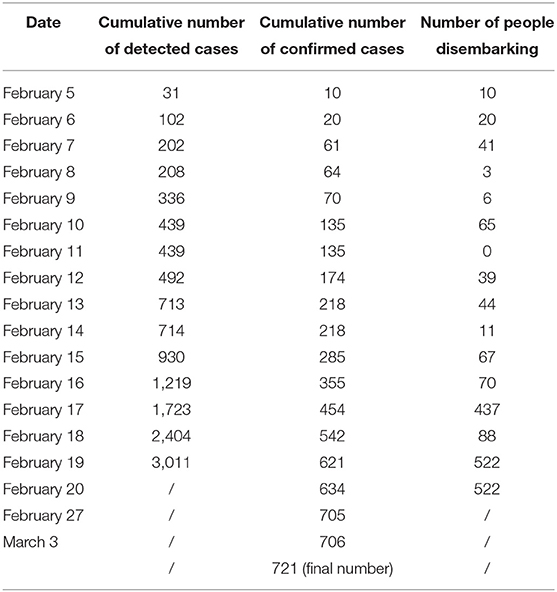
We study the infection status of 3,711 people on the cruise ship, including 2,666 passengers and 1,045 crew members, from January 20 to February 20. The numbers of detected and confirmed cases are shown in Table 1 [1, 3–5], where detected cases refer to individuals who had taken a nucleic acid test of which the result is uncertain (may be negative or positive), and confirmed cases refer to individuals whose tests came back positive.
2.2. Prerequisites
We assume that the first case on the cruise ship is the passenger from Hong Kong, who boarded the ship on January 20 and disembarked on January 25.
We also assume that everyone on the cruise ship has the same contact number per day, denoted by C(t). Since the Japanese government began to test and isolate all individuals on the cruise ship from February 5, the model is divided into two stages: (i) January 20 to February 4, and (ii) February 5 to February 20. The average number of close contacts per person per day is denoted by C1 during the first stage and by C2 during the second stage.
2.3. Dynamical Model
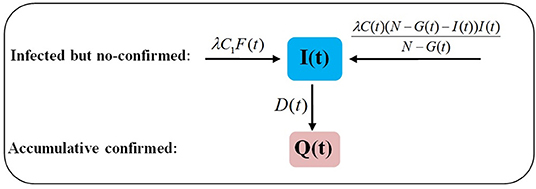
We take January 20 to be the initial time, denoted by t = 1. At time t, the number of infected but not confirmed (INC for short) is denoted by I(t). As given in Figure 2, the variation with time is given by
Let F(t) be the number of imported infected persons at time t. It is assumed that the Hong Kong passenger is the only imported case. Then F(t) = 1 from January 20 to January 25, i.e., for 1 ≤ t ≤ 6, and F(t) = 0 for t > 6. The daily number of close contacts of the Hong Kong passenger is C1, and let λ be the probability of another individual being infected by the passenger after close contact. Then the number of people infected by the Hong Kong passenger at time t is λC1F(t).
At time t, for all infected individuals except the Hong Kong passenger, the close contact number per person per day is C(t). The proportion of uninfected (i.e., susceptible) people is , where N is the total number of people on the cruise ship on February 5, G(t) is the cumulative number of people who have disembarked, and N − G(t) is the total number of people remaining on the cruise ship at time t. Hence, the number of infected people caused by one infected individual at time t is , and the number of infected people caused by all infected individuals at time t is The number of newly confirmed cases at time t is denoted by D(t). The cumulative number of confirmed cases at time t is denoted by Q(t). The cumulative number of infected cases at time t is denoted by A(t).
Hence we have the system of equations
where
and
2.4. Parameter Values
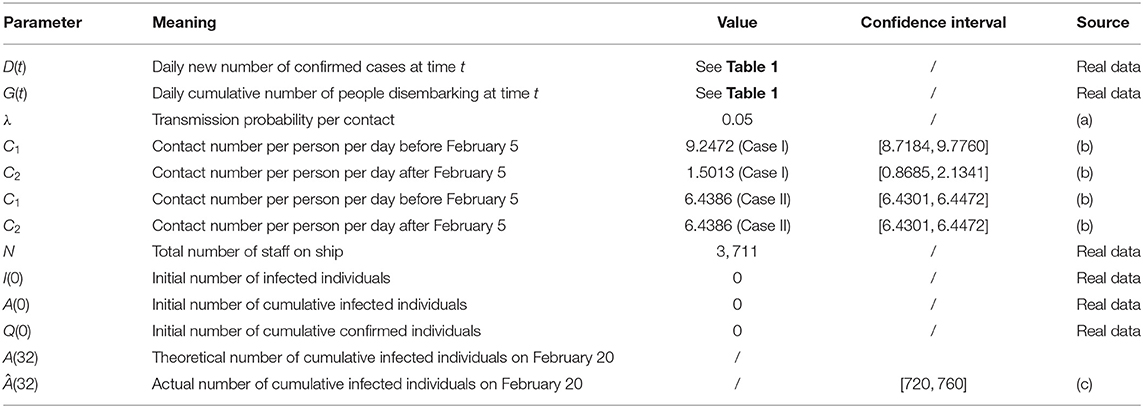
In this subsection, we use real data (see Table 1) to estimate the parameter values in model (1), which are given in Table 2. We describe the process of parameter estimation, which is implemented using the function fminsearch in the optimization toolbox of MATLAB.
(a) The meaning of λ is the transmission probability per contact. We estimate its value by combining information from references [6–8], which studied the spread of the epidemic in Wuhan city, in Shanxi province, and on the Diamond Princess, respectively. In Zhang et al. [6] the transmission probability per contact was found to be 0.0149; in Xue et al. [7] the values 0.01597 and 0.04644 were given; and Liu et al. [8] provided a range of 0.001–0.2 for the transmission probability per contact. Based on these estimates, here we take the value of λ to be 0.05.
(b) We use the least-squares estimation method to obtain the values of C1 and C2 in Case I and the value of C1 = C2 in Case II (see section 3 for description of the cases) by fitting the theoretical value of A(32) in model (1) to the actual cumulative number of infected individuals, denoted by Â(32). Individuals on the cruise ship were isolated, with each passenger staying in their own cabin. Each cabin on the Diamond Princess can accommodate four people [9], so we suppose that the average number of people in each cabin is 3. As for the crew, from February 5 they took meals in the canteen in turn, and the dining room table can accommodate 12 people. Therefore, we assume that the average contact number for each crew member is 12. The proportions of passengers and crew on the ship were 71.8 and 28.2%, respectively, so we calculate that the average contact number per person per day for passengers and crew is between 5 and 6.
(c) According to Japan's health ministry bulletin, all individuals on the ship had been tested and had disembarked by March 1, and the total number of officially reported confirmed cases is 721 [5]. Besides those, 38 passengers tested negative when disembarking but were later confirmed to be positive [10, 11]. Considering that some of these people may have become infected on their way back home, we estimate that on February 20 the actual cumulative number of infected individuals, Â(32), was between 720 and 760.
3. Results
The isolation measures taken by the Japanese government have been controversial, and the actual infection situations before and after the measures were imposed are not clear. In this section, we reverse-predict the infection on the cruise ship in two scenarios.
3.1. Case I
In this scenario it is assumed that the isolation measure is effective by itself, and that circulating air through the central air-conditioning system does not cause spread of the virus. Under isolation, close contacts of passengers were restricted to their cabin mates, and close contacts of crew members were limited to those dining together. Based on the model and parameter values, by calculating and A(t) we can estimate the new daily number and cumulative number of infected people from January 20 to February 20; these values are reported in Figure 3 and Table 3.
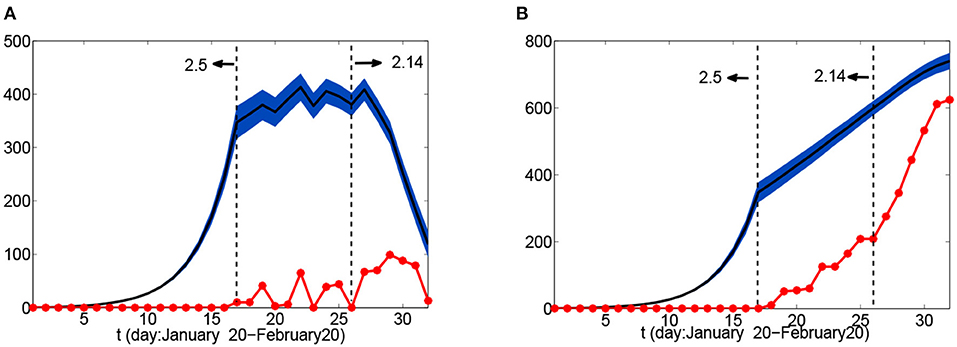
Figure 3. Number of infected people as a function of time from January 20 to February 20 in Case I: (A) daily new number of infected cases; (B) daily cumulative number of infected cases. Red dots represent actual confirmed numbers; black dotted lines indicate critical time nodes; the black solid line represents the theoretical mean value of the number of infected, in (A) and A(t) in (B); the blue area represents the interval of 10,000 times deduction results.
From Figure 3A we observe that the peak time of the epidemic in this case is from February 5 to February 15. As of February 20, there were still 100 infected but not confirmed individuals on the ship. By comparing the red dots with the black solid line, we can see that the number of confirmed cases was far less than the number of infected people before February 14. The comprehensive and systematic testing from February 14 led to a rapid fall in the number of infected persons, and the cumulative number of infected people and the total number of confirmed cases gradually became closer. So we can see that isolating people and conducting comprehensive testing play important roles in epidemic control. From Table 3 we also see that there would have been about 258 ([188, 328]) infected individuals on February 5 when the cruise ship was isolated. It can be concluded that because the Japanese government did not pay enough attention to the epidemic at the initial stage and did not carry out comprehensive testing on all people onboard in time, the final proportion of infected reached nearly 20%. If measures had been taken for the Diamond Princess as promptly as for the Costa Selena cruise ship, which carried 4806 passengers and crew members and for which the Chinese government spent 1 h formulating the response plan, 4 h conducting the sampling work, 5 h producing the test results, and 24 h overall completing the detection, evacuation, and resettlement work [12], the number of infected on the Diamond Princess could have been reduced by at least 60–70%. This shows that the effect of non-pharmaceutical interventions on controlling the spread of COVID-19 is very considerable [13].
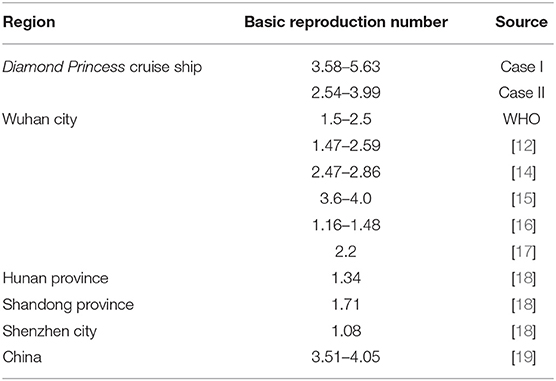
The reproductive number (including the basic reproductive number, or the effective reproductive number) is an index that measures the number of infected people caused by a single infected individual during the infection period. In Case I, the basic reproductive number can be estimated based on the Hong Kong passenger infecting about 3 (2.7742) persons from January 20 to January 25 by the sum , which can be taken as the reproductive number of the Hong Kong passenger. Based on reference [14], the incubation period of COVID-19 is 3–5 days, so we assume that it will take 3–5 days from showing clinical symptoms to becoming a confirmed case on the cruise ship. Then the infection period is assumed to be 6–10 days. Besides, according to reports of the National Institute of Infectious Diseases of Japan, as of February 18 the percentage of infected but symptomless samples among 2,404 respiratory tract specimens was as high as 48%. Assume that the average time between being infected and being confirmed for asymptomatic infection is 10–15 days. Combining symptomatic and asymptomatic infections, we estimate the basic reproduction number of the cruise ship to be 3.66–5.54; see Table 4. For Wuhan city in Hubei province, China, which also became an isolated system after sealing, the basic reproduction number is 1.4–4.0 [15, 17, 19, 20]. For China as a whole, the basic reproduction number is 3.51–4.05 [21]. The basic reproduction number of the cruise ship is larger, which may be due to the higher population density, a more enclosed space, a higher percentage of asymptomatic infections, and delayed testing for all individuals.
3.2. Case II
Japan's emergency measures, which kept passengers isolated in cruise cabins but continued to circulate air through central air-conditioning, was questioned by many experts. Assume that after isolation, the close contact number of each person does not change due to circulation of air in the central air-conditioning system, that is, C1 = C2. Similarly to Case I, based on the model and parameter values we can calculate the new number and cumulative number of infected people from January 20 to February 20, as shown in Figure 4 and Table 3. By inspection of Figure 4A, the infection peak time is from February 15 to February 16. Although the quarantine measure was imposed on February 5, the upward trend in the number of infections remained largely unchanged. Comparing the red dots with the black solid line in Figure 4A, we see that the comprehensive and systematic testing which started on February 14 resulted in a rapid decline in the number of infected people after February 17. We also find that there were about 53 infected individuals on February 5 when the cruise ship was isolated. If the Japanese government had completed response measures, such as detection, evacuation, and resettlement work as quickly as was done for the Costa Selena, the number of infected on the Diamond Princess could have been reduced by at least 90%. In Case II, it can be estimated that the Hong Kong passenger infected about two persons (1.9316) from January 20 to January 25. In this case, then, we estimate the basic reproduction number on the cruise ship to be 2.55–3.99.
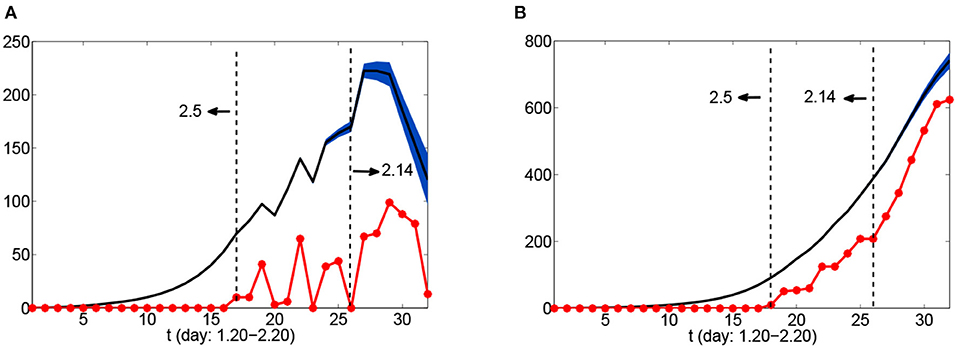
Figure 4. Number of infected people as a function of time from January 20 to February 20 in Case II: (A) daily new number of infected cases; (B) daily cumulative number of infected cases. Red dots represent actual confirmed numbers; black dotted lines indicate critical time nodes; the black solid line represents the theoretical mean value of the number of infected, in (A) and A(t) in (B); the blue area represents the interval of 10,000 times deduction results.
4. Discussion and Conclusion
In this article we have used a mathematical dynamical model to reversely deduce, in two hypothetical cases, the number of people infected with COVID-19 on the Diamond Princess cruise ship from January 20 to February 20, 2020, the peak time of infection, the number of the infections caused by the Hong Kong passenger, and the basic reproduction number, information which can provide the theoretical basis for understanding the spread of the epidemic and developing effective control measures. The results reported in this paper demonstrate that a dynamical model which incorporates a transmission mechanism can be a very useful method for predicting the spread of a disease, especially when actual data are scarce [22–25].
Although the premises of the two cases are different, it can be deduced that quarantining populations and conducting comprehensive testing play an important role in control of the epidemic, and that detection of cases needs to be timely.
According to the report published by the National Institute of Infectious Diseases of Japan, as of February 18, 2,404 samples on the Diamond Princess cruise ship had been tested (including samples for double detection), and 531 cases were confirmed to be positive for COVID-19. Of these, 33 cases showed symptoms before February 6, 151 showed symptoms on or after February 6, and 255 (48%) were asymptomatic. Combining the time of diagnosis of 79 patients with fever before February 6 (only 33 of which were confirmed cases) with the onset time of 151 confirmed cases after February 6, we obtain Figure 5. As can be seen from the figure, the infection peak was reached on February 7. Comparing with Figures 3A, 4A, Case I seems closer to the actual situation, indicating that the role of central air-conditioning in transmission of the disease is relatively small, and that the isolation intervention adopted by the Japanese government had a certain impact on reducing the transmission of the virus from one person to another.
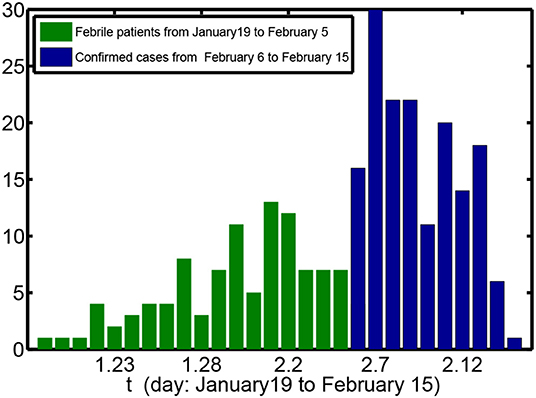
Figure 5. Number of cases plotted against time. The green bars show the number of febrile patients and the blue bars the number of confirmed COVID-19 cases with reported onset times.
By our analysis, we estimate the reproduction number associated with the Hong Kong passenger to be between 1.9290 and 2.9328. In fact, the time period between the date of infection and date of confirmation for other persons on the cruise ship is irregular and cannot be determined, so the period of infection cannot be determined and hence the basic reproduction number cannot be found accurately. Nevertheless, we can give a general range [2.54, 5.63]. If the Japanese government had completed response measures for the Diamond Princess—including detection, evacuation, and resettlement work—as promptly as was done for the Costa Selena cruise ship (within 24 h), the number of infections on the Diamond Princess could have been reduced by at least 60%. In this respect, the response measures taken for the Costa Selena in Tianjin Port provide a positive paradigm. Moreover, 38 Diamond Princess passengers who tested negative on the ship were confirmed to have the disease after they disembarked, indicating that the nucleic acid test had certain errors and led to a proportion of infected people not being detected and thus becoming a potential source of risk for other regions. Therefore, the accuracy of the testing method should also be improved.
Data Availability Statement
All datasets presented in this study are included in the article/supplementary material.
Author Contributions
JZ, G-QS, ML, and ZJ conceived and designed the experiments. JZ and G-QS performed the experiments. JZ, G-QS, and ML developed the dynamical model. RG, XP, and HR collected and analyzed the data. JZ, HR, XP, and RG analyzed the data. JZ, G-QS, and ZJ wrote the manuscript. All authors contributed to the article and approved the submitted version.
Funding
This work is supported by the National Natural Science Foundation of China under Grant (11601292, 61873154, 11671241, 11701348, 11801398, and 11971278), General Youth Fund project in Shanxi Province (201901D211158), the National key research and development project of China (2019YFC1200501), the 1331 Engineering Project of Shanxi Province, Scientific and Technological Innovation Programs of Higher Education Institutions in Shanxi Province (2019L0114), and the Key Research and Development Project in Shanxi Province (202003D31011/GZ).
Conflict of Interest
The authors declare that the research was conducted in the absence of any commercial or financial relationships that could be construed as a potential conflict of interest.
References
1. Adventure of “Virus Cruise”: Infection Development of 621 Individuals on Princess Diamond Cruise Ship. Available online at: http://news.caijingmobile.com/article/detail/412655?source_id=40 (accessed February 20, 2020).
2. Huang S, Peng Z, Jin Z. Studies of the strategies for controlling the COVID-19 epidemic in China: estimation of control efficacy and suggestions for policy makers. Sci Sin Math. (2020) 50:1–14. doi: 10.1360/SSM-2020-0043
3. 31 Days on the Diamond Princess Cruise Ship. Available online at: https://baijiahao.baidu.com/s?id=1659091075715805538&wfr=spider&for=pc (accessed February 21, 2020).
4. About 150 Crew Members Have Not Yet Disembarked From the Diamond Princess After All Its Passengers Disembarked. Available online at: http://news.eastday.com/eastday/13news/auto/news/world/20200227/u7ai9122386.html (accessed February 27, 2020).
5. A New Crew Member of the Diamond Princess Cruise Ship Has Been Confirmed To Be Infected With COVID 19. Available online at: https://baijiahao.baidu.com/s?id=1660062409001457350&wfr=spider&for=pc (accessed March 2, 2020).
6. Zhang J, Sun G, Li M, Zhang W, Chang L, Jia Z, et al. COVID-19 propagation prediction and assessment method with imported cases and infection generations: Shanxi Province as a case. Res Square. (2020). doi: 10.21203/rs.3.rs-16298/v1
7. Xue L, Jing S, Miller JC, Sun W, Li H, Estrado-Franco JG, et al. A data-driven network model for the emerging COVID-19 epidemics in Wuhan, Toronto and Italy. Math Bioenc. (2020) 326:108391. doi: 10.1016/j.mbs.2020.108391
8. Liu F, Li X, Zhu G. Using the contact network model and Metropolis-Hastings sampling to reconstruct the COVID-19 spread on the Diamond Princess. Sci Bull. (2020) 65:1297–305. doi: 10.1016/j.scib.2020.04.043
9. Diamond Princess. Baidubaike. Available online at: https://baike.baidu.com/item/%E9%92%BB%E7%9F%B3%E5%85%AC%E4%B8%BB%E5%8F%B7 (accessed May 17, 2020).
10. Diamond Princess Passengers Returning to Hong Kong Confirmed Case Hong Kong and Media: No Surprise. Available online at: https://news.163.com/20/0224/08/F64TCTC20001899O.html (accessed February 24, 2020).
11. 4 People That Were Tested To Be Negative When Disembarking From “Diamond princess” Cruise Ship Were Confirmed. Available online at: http://n.eastday.com/pvideo/1582783658015276 (accessed February 27, 2020).
12. China's Version of the Horror Cruise Ship Incident. Available online at: https://www.sohu.com/a/376232368_653731 (accessed February 27, 2020).
13. Ali S, Wang L, Lau E, Xu X, Du Z, Wu Y, et al. Evolution of effective serial interval of SARS-CoV-2 by non-pharmaceutical interventions. Res Sq. (2020) rs.3.rs-32486. doi: 10.21203/rs.3.rs-32486/v1
14. Guan W, Ni Z, Hu Y, Liang W, Ou C, He J, et al. Clinical characteristics of 2019 novel coronavirus infection in China. medRxiv. (2020). doi: 10.1101/2020.02.06.20020974
15. Du Z, Wang L, Cauchemez S, Xu X, Wang X, Cowling BJ, et al. Risk for transportation of 2019 novel coronavirus disease from Wuhan to other cities in China. Emerg Infect Dis. (2020) 26:1049–52. doi: 10.3201/eid2605.200146
16. Du Z, Wang L, Xu X, Wu Y, Cowling B, Meyers L. The serial interval of COVID-19 from publicly reported confirmed cases. Emerg Infect Dis. (2020) 26:1341–3. doi: 10.1101/2020.02.19.20025452
17. Wu JT, Leung K, Leung GM. Nowcasting and forecasting the potential domestic and international spread of the 2019-nCoV outbreak originating in Wuhan, China: a modelling study. Lancet. (2020) 395:689–97. doi: 10.1016/S0140-6736(20)30260-9
18. Zhang J, Litvinova M, Wang W, Wang Y, Deng X, Chen X, et al. Evolving epidemiology and transmission dynamics of coronavirus disease 2019 outside Hubei province, China: a descriptive and modelling study. Lancet Infect Dis. (2020) 20:793–802. doi: 10.1016/S1473-3099(20)30230-9
19. Zhao S, Lin Q, Ran J, Musa SS, Yang G, Wang W, et al. Preliminary estimation of the basic reproduction number of novel coronavirus (2019-nCoV) in China from 2019 to 2020: a data-driven analysis in the early phase of the outbreak. Int J Infect Dis. (2020) 92:214–7. doi: 10.1016/j.ijid.2020.01.050
20. Chan JFW, Yuan S, Kok KH, To KKW, Chu H, Yang J, et al. A familial cluster of pneumonia associated with the 2019 novel coronavirus indicating person-to-person transmission: a study of a family cluster. Lancet. (2020) 395:1–21. doi: 10.1016/S0140-6736(20)30154-9
21. Yang Y, Lu Q, Liu M, Wang Y, Zhang A, Jalali N, et al. Epidemiological and clinical features of the 2019 novel coronavirus outbreak in China. medRxiv. (2020). doi: 10.1101/2020.02.10.20021675
22. Wang Z, Xia C, Chen Z, Chen G. Epidemic propagation with positive and negative preventive information in multiplex networks. IEEE Trans Cybern. (2020) 1–9. doi: 10.1109/TCYB.2019.2960605
23. Xia C, Wang Z, Zheng C, Guo Q, Shi Y, Dehmer M, et al. A new coupled disease-awareness spreading model with mass media on multiplex networks. Inform Sci. (2019) 471:185–200. doi: 10.1016/j.ins.2018.08.050
24. Zhang J, Jin Z, Yuan Y. Assessing the spread of foot and mouth disease in mainland china by dynamical switching model. J Theor Biol. (2019) 460:209–19. doi: 10.1016/j.jtbi.2018.09.027
Keywords: COVID-19, Diamond Princess, difference equation, reverse prediction, reproduction number, measures assessment, infection scale
Citation: Zhang J, Sun G-Q, Li M, Gao R, Ren H, Pei X and Jin Z (2020) COVID-19 Reverse Prediction and Assessment on the Diamond Princess Cruise Ship. Front. Phys. 8:353. doi: 10.3389/fphy.2020.00353
Received: 28 May 2020; Accepted: 24 July 2020;
Published: 20 October 2020.
Edited by:
Chengyi Xia, Tianjin University of Technology, ChinaReviewed by:
Lin Wang, University of Cambridge, United KingdomSanling Yuan, University of Shanghai for Science and Technology, China
Copyright © 2020 Zhang, Sun, Li, Gao, Ren, Pei and Jin. This is an open-access article distributed under the terms of the Creative Commons Attribution License (CC BY). The use, distribution or reproduction in other forums is permitted, provided the original author(s) and the copyright owner(s) are credited and that the original publication in this journal is cited, in accordance with accepted academic practice. No use, distribution or reproduction is permitted which does not comply with these terms.
*Correspondence: Zhen Jin, amluemhuQDI2My5uZXQ=
 Juan Zhang1,2
 Zhen Jin