- 1School of Business, East China University of Science and Technology, Shanghai, China
- 2China Academy of Financial Research, Zhejiang University of Finance and Economics, Hangzhou, China
- 3School of Science, East China University of Science and Technology, Shanghai, China
- 4Research Center for Econophysics, East China University of Science and Technology, Shanghai, China
- 5Institute of Physics, Academia Sinica, Taipei, Taiwan
This paper studies the stability of stock networks after crashes based on the entropy method. By measuring network stability using the entropy calculated with the degree distribution, we find that the entropy of a stock network is close to that of the Erdös-Rényi and Watts-Strogatz networks. We further introduce government rescue policies as a natural experiment and use the entropy measurement to study the influence of rescue policies after crashes on the network stability, finding that rescue policies only have short-term effects. Analysis of the relation between stock degrees and government purchasing behavior further confirms the effects of rescue policies on stock network stability.
1. Introduction
The stability of networks after random failures or attacks is a central issue in the study of complex networks [1–7]. A large amount of research has been devoted to this issue for various complex networks, such as biological, physical, social and financial networks, and has successfully revealed the relationship between network structure and stability after external attacks [8–11].
Stock markets are complex systems, which can be well-abstracted and described by complex networks. In research on stock networks, the network stability after stock market crashes has attracted much attention [11, 12]. Studies on network stability elucidate the topological reconfigurations of stock networks after crashes and help to improve our understanding of financial crises. However, these studies cannot be directly used to guide the government in stabilizing the market after crashes.
In recent years, an increasing body of work has concentrated on the question of how rescue policies, which are government policies aimed at stabilizing the stock market at times of crises, influence market stability after crashes [13, 14]. This question has been studied by measuring the market stability in terms of volatility, and it has been found that rescue policies can improve the stability of the stock market after crashes. The complex network method can reduce the immense complexity of financial markets to facilitate investigation while retaining the market's core information, and some researchers have studied market stability after crashes by using the network method [11, 12, 15]. Motivated by the studies mentioned above, we investigate the influence of rescue policies on the stability of stock markets after crashes from the perspective of complex networks.
In network research, most researchers measure the network stability based on network robustness with respect to random node removal or targeted attacks [11, 16, 17]. In this paper, we introduce the network entropy to measure the stability of complex networks. The network entropy calculated with the degree distribution can provide an average measure of network heterogeneity, which is a simple but essential characteristic of complex networks and has a direct relationship with the network's resilience to both random failures and attacks [18–21]. To the best of our knowledge, this work is the first attempt to examine the influence of government rescue policies on stock market stability after crashes from the perspective of network stability.
2. Datasets
The first dataset records the closing prices of all constituent stocks of the SSE 180 index, a benchmark index for the Shanghai market, at the end of every minute between 9:30 and 11:30 a.m. and between 1:00 and 3:00 p.m. on 717 consecutive trading days from 16 December 2013 to 22 November 2016. The dataset was obtained from Wind Information (http://www.wind.com.cn/) and contains ~43,440 records per day on average, with a total size of 31,146,480.
The second dataset records closing prices of the Hang Seng Index (HSI) and all its constituent stocks trading in the Hong Kong Exchange at the end of every minute between 9:30 a.m. and 12:00 p.m. and between 1:00 and 4:00 p.m. on 422 consecutive trading days from 20 October 2014 to 5 July 2016, also from Wind Information. This dataset contains approximately 23,240 records per day on average, and the total size is 9,807,280.
The third dataset, from SinaFinance (http://finance.sina.com.cn/), records 45 news items on rescue policies for the stock market released by the Chinese government for the period from 16 December 2013 to 22 November 2016, with 34 of these news items released in the 2 months after 19 June 2016 during which more than 1,000 A-shares in the Chinese stock market hit the daily downward price fluctuation limit. To take into account the specific government rescue measures for stock market crashes, this dataset also includes information from Eastmoney (http://eastmoney.com/) on the list of stocks purchased by the government between 30 June 2015 and 30 September 2015.
3. Methodology
3.1. Crashes and Identification of Sub-periods
In this paper, crashes are identified by looking for large price changes within different time windows [22–24]. On 19 June 2015, more than 1,000 A-shares in the Chinese stock market hit the daily downward price fluctuation limit, and the SSE 180 index fell by 4.61%. On 7 January 2016, the circuit breakers mechanism was suspended, and the SSE 180 index dropped by more than 5%. By calculating the price changes in the SSE 180 index, we find that during the sampling period the price changes on these 2 days are the largest. Therefore, we identify these two large price changes in the Shanghai stock market as crashes. For the universality test, we also identify one crash occurring on 10 March 2015 in the Hong Kong stock market in a similar way.
Next, for the purpose of analyzing network stability during periods with and without rescue policies, we divide the sampling periods for the Shanghai and Hong Kong stock markets into different sub-periods. For the Shanghai stock market, sub-periods are determined by using the news of rescue policies recorded by SinaFinance. First, after the crash on 19 June 2015, most rescue policies were enacted by the government within the subsequent 2 months. These include: on 27 June, China's central bank, People's Bank of China, cut interest rates by 0.25%; and on 6 July, China Financial Futures Exchange (CFFEX) restricted index futures trading. In contrast, no rescue policies were put in place for months after the crash on 7 January 2016. To compare the stability of the stock network in the period after a crash and in a period when the market is stable, we also identify sub-periods of stable states. We find that the volatility of the SSE 180 index was low and stable from mid-June to early October of 2014 and over the second half of the year 2016. Therefore, for the Shanghai stock market, we divide the sampling period into four sub-periods: a sub-period with government rescue policies after a crash, a sub-period without government rescue policies after a crash, and two stable-state sub-periods. Considering that the impact of a crash would not be obvious when the sub-period is too short, and there may be external noise when the sub-period is too long, we choose the sub-period length to be 60 trading days. Note that sub-period lengths of 50 or 70 trading days give similar results.
For the Hong Kong stock market, for which there had been no rescue policies, we separate the sampling period into three sub-periods. The 60-day period following the crash on 10 March 2015 is the sub-period without government rescue policies. In analogy to the stable-state periods in the Shanghai stock market, we identify the 60-day periods following 22 December 2014 and 5 March 2016 as stable-state sub-periods in the Hong Kong stock market.
3.2. Construction of the Stock Network
The most common method of constructing a stock network is based on correlations of the stock price return. This method calculates the correlation coefficient of the stock price return and converts the coefficient matrix into a distance matrix [25].
Let Pi(t) be the closing price of stock i at time t, and let Ri(t) be the return of stock i at time t, given by
Then the Pearson correlation coefficient ρi,j between stocks i and j can be calculated as
where 〈·〉 refers to the time average over the period analyzed. Following the idea behind the construction of a complex network, we next transform the correlation matrix into a distance matrix D with elements di,j, where the distance between the two stocks i and j is defined as Mantegna [26]
Treating stocks as network nodes, we now construct the stock network with the planar maximally filtered graph (PMFG) method [27, 28], in which network links are added according to the distance between nodes. The PMFG method is used to construct planar graphs and has the algorithmic advantage that planarity tests are relatively simple to perform; planar graphs also provide more information than minimum spanning tree graphs on the internal structure of a stock market. The PMFG procedure is carried out as follows. First, rank the distance elements between all pairs of nodes in ascending order. Second, add a link between the two nearest nodes, i.e., the pair with the smallest distance, if and only if the resulting graph after such a link insertion can still be embedded in a plane without crossing any links. Third, repeat the previous step until no more links can be added. The resulting PMFG contains 3N − 6 links, where N is the number of nodes. The average degree is 〈k〉 = 2(3N − 6)/N, which is roughly equal to 6 when N is large enough.
3.3. Network Entropy
Based on the theory of large deviations, Demetrius et al. [29] derived a fluctuation theorem, which states that network entropy and stability, as measured by the fluctuation decay rate after random perturbations, are positively correlated. By invoking this theorem, Demetrius and Manke [30] showed that the network entropy can quantitatively describe the homeostatic network properties under perturbations, a generic term for robustness. Meanwhile, Wang et al. [20] showed that the network heterogeneity, a simple but essential characteristic of a complex network, is in direct relationship with the network's resilience to both random failures and attacks, and that the heterogeneity can be measured by network entropy. This implies that the greater the entropy, the more stable and heterogeneous the network is. We therefore introduce the network entropy to study the stability of stock networks.
Following the definition of entropy introduced in Wang et al. [20], we define the stock network entropy as the entropy of the degree distribution, which is given by
where N is the total number of nodes in the network and P(k) is the degree distribution, which gives the probability of having a node with k links.
4. Results and Discussion
4.1. Entropy of the Stock Network
To find out which kind of network structure the stock network is close to, we compare the entropy of the stock network to the entropies of several classes of networks, including the Erdös-Rényi (ER) random, Barabási-Albert (BA) scale-free and Watts-Strogatz (WS) small-world networks. Note that the average degree of the network of 180 stocks constructed by the PMFG method is approximately 6. Therefore, to make the entropies of the stock network and of the ER, BA and WS networks comparable, we calculate the entropy of the latter three networks with the same number of nodes, N = 180, and present the statistical characteristics of these networks in Table 1.
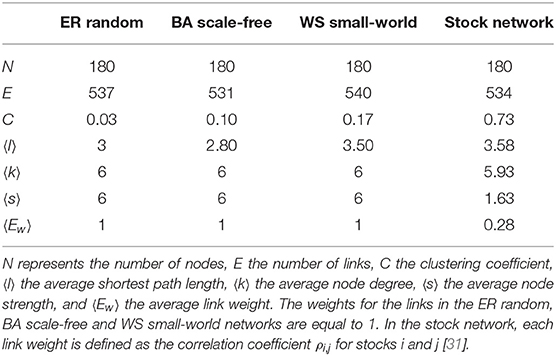
Table 1. Statistical description of the ER random, BA scale-free, and WS small-world networks and the stock network.
First, we calculate the entropy of the ER random network as follows. For the ER network with N nodes and link probability p between each pair of nodes, the degree distribution P(k) is given by the Poisson distribution [32],
and the average degree 〈k〉 is Np. The entropy of the ER network with average degree 〈k〉 = 6 for various N from 20 to 180 is plotted in Figure 1A.
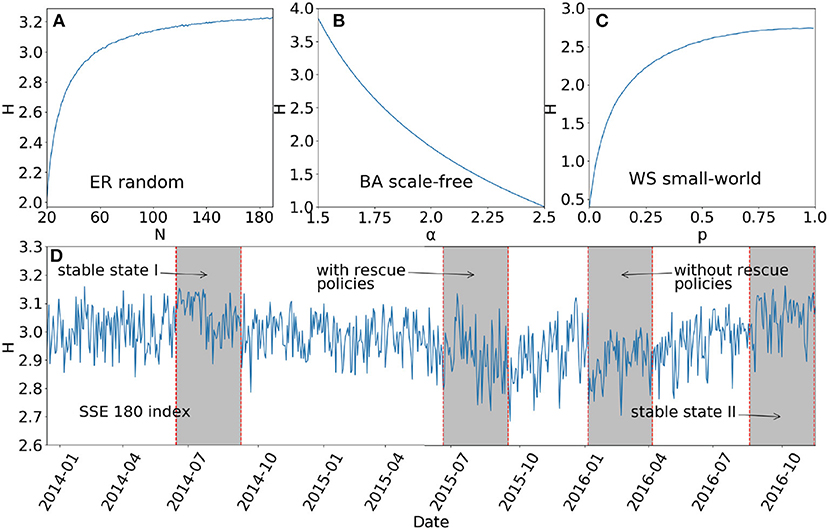
Figure 1. Entropy of (A) the ER random network with Np = 6 for various N; (B) the BA scale-free network for N = 180, m = 1 and various α; (C) the WS small-world network for K = 6, N = 180 and various p; and (D) the stock network for the sampling period from 16 December 2013 to 22 November 2016 in the Shanghai stock market.
Next, for the BA scale-free network with N nodes, minimal connectivity m, and scaling exponent α of the degree distribution, the entropy of the network can be expressed as Wang et al. [20]
and the average degree of the network is given by . The entropy of the BA network with N = 180 and m = 1 for various α from 1.5 to 2.5 is shown in Figure 1B.
For the WS small-world network first proposed in Watts and Strogatz [33], which starts with a ring lattice of N nodes where every node is connected to its first K neighbors and then has each edge of the lattice randomly rewired with probability p such that self-connections and duplicate edges are excluded, the degree distribution is given by Albert and Barabási [34]
and the average degree of the network is 〈k〉 = K. We plot the entropy of the WS small-world network with average degree 〈k〉 = K = 6 and N = 180 for various p from 0 to 1 in Figure 1C.
Using the network construction method and the definition of network entropy proposed in this paper, we present in Figure 1D the entropy of the stock network during the sampling period from 16 December 2013 to 22 November 2016. Note that the stock network is constructed with the intraday stock returns for every trading day. We next compare the entropy of the stock network to that of the ER random, BA scale-free and WS small-world networks with the same average degree and number of nodes.
For the ER network with average degree 〈k〉 = 6, the entropy is approximately 3.2 when N = 180, as shown in Figure 1A. For the BA network with 〈k〉 = 6 and N = 180, the entropy is approximately 2 when α ≈ 1.9484, as shown in Figure 1B. As can be observed in Figure 1C, the entropy of the WS network with 〈k〉 = 6 and N = 180 is always smaller than 2.7 for different values of p. From Figure 1D, one can see that the entropy H of the stock network satisfies 2.7 < H < 3.2 during the sampling period, which is much larger than the entropy of the BA network but smaller than that of the ER network and a little bigger than that of the WS small-world network. This suggests that the topological structure of the stock network is closer to that of the ER and WS networks.
To reveal the influence of crashes on the stability of the stock network, we next analyze the network entropy in the four sub-periods, i.e., the two stable-state sub-periods and the sub-periods with and without rescue policies after a crash. First, the mean values of the entropy for the sub-periods with and without rescue policies after a crash are 2.9203 and 2.8992, respectively, and the mean values of the entropy for the sub-periods of stable states I and II are 3.0602 and 3.0487, respectively. This result suggests that in the periods after a crash the stock network is less stable and heterogeneous than during the stable-state periods, since the entropy measures the network stability and heterogeneity. We also conduct a t-test for the significance of the difference between the entropies of the stock network for different sub-periods, as shown in Table 2; the test finds no significant difference between the mean entropies of the sub-periods with and without rescue policies.
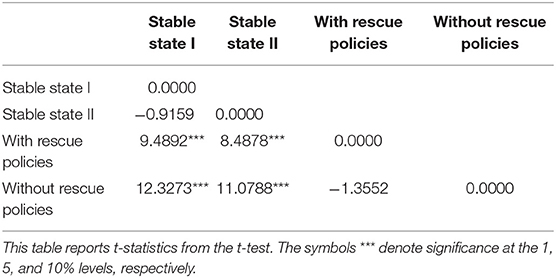
Table 2. Results of t-test for testing the significance of the difference between the entropies of the stock network for different sub-periods in the Shanghai stock market.
4.2. Entropy Evolution of the Stock Network
To examine how the effects of rescue policies on stock network stability change over time, we now analyze the evolution of the entropy of the stock network after a shock during sub-periods with and without rescue policies. One might imagine that these shocks are similar to after shocks following an earthquake.
A shock is defined here as a time at which the volatility V(t) = |R(t)| exceeds a given threshold value Rth = Sδ, where R(t) is the logarithmic price return, δ is the mean volatility over the stable-state period, and the threshold S is positive [35]. Using the same method of shock identification, 43 and 30 shocks are identified with the threshold S = 2 during the sub-periods in the Shanghai stock market with and without rescue policies, respectively. Then, the entropy evolution is defined as the change in the entropy averaged over the shock after its occurrence in the sub-period. We present the entropy evolution of the stock network for these two sub-periods in Figure 2.
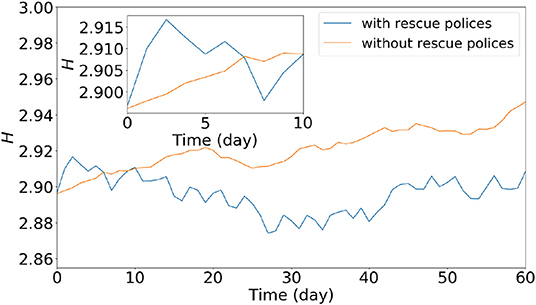
Figure 2. Entropy evolution of the stock network during sub-periods with and without rescue policies after crashes in the Shanghai stock market.
Figure 2 shows that the entropy evolution of the stock network for the sub-period with rescue policies after a crash increases rapidly at the early stage, then decreases and rises again slowly at later times. For the sub-period without rescue policies, the entropy increases slowly throughout the whole period. These results suggest that rescue policies can improve the heterogeneity and stability of the network only for a short time at the initial stage, whereas the heterogeneity and stability of the network will increase slowly over the period after a crash even without rescue policies.
4.3. Further Analysis of Stock Degree
In this section, we study the degrees of all stocks in the stock network over different sub-periods, with the aim of identifying the cause of the effect of rescue policies on the stock network entropy.
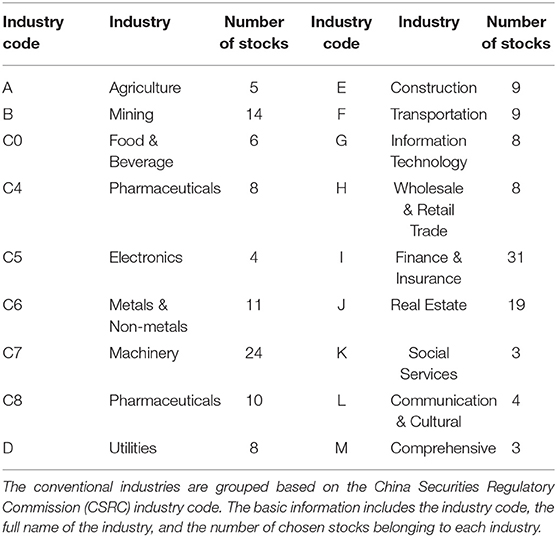
In Table 3 we present the average degree of all stocks of conventional industries in the SSE 180 index during the four sub-periods, i.e., the two stable-state sub-periods and the sub-periods with and without rescue policies. Table 4 presents industry information on constituent stocks in the SSE 180 index, including the industry codes, industry names, and number of stocks belonging to each industry.
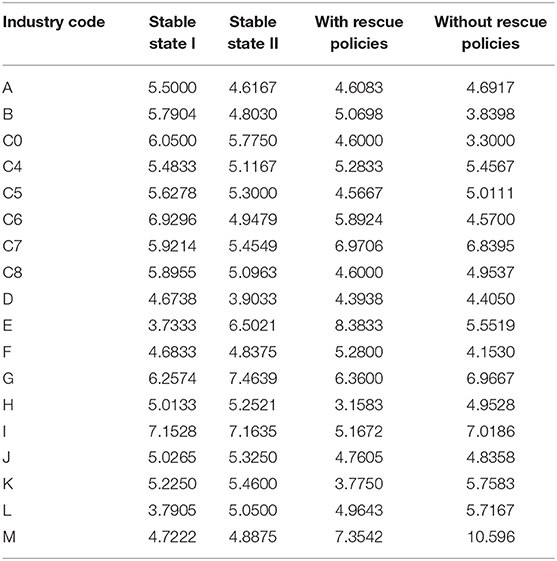
Table 3. Average degrees of constituent stocks in the SSE 180 index for each industry during two stable-state sub-periods and sub-periods with and without rescue policies.
As seen in Table 2, the average degree of stocks in the Finance & Insurance industry is large during the two stable-state sub-periods and the sub-period without rescue policies, but relatively small during the sub-period with rescue policies. On the other hand, the average degree of stocks in the Construction industry is large during the sub-period with rescue policies, and relatively small during the stable-state sub-periods and the sub-period without rescue policies. This suggests that the degrees of both the Finance & Insurance and the Construction industries are greatly influenced by government rescue policies, which ultimately lead to the change in network entropy during the sub-period with rescue policies.
To elucidate the relation between rescue policies and the degrees of stocks, we compare stocks purchased by the government and stocks with large degrees in the stock network.
Table 5 lists the top 10 stocks purchased by the government during the period from 30 June 2015 to 30 September 2015, which closely coincides with the period in which rescue policies were enacted. Table 5 shows that the top stocks purchased by the government belong to the Construction industry during the sub-period with rescue policies, which is consistent with the results in Table 3. In Table 6 we present the top 10 stocks with the highest mean value of stock degrees in the stock network for the two stable-state sub-periods (I and II) and the sub-periods with and without rescue policies.
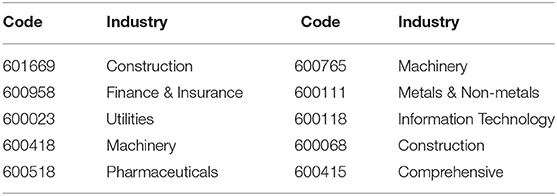
Table 5. Top 10 stocks purchased by the government from 30 June 2015 to 30 September 2015 in the Shanghai stock market.
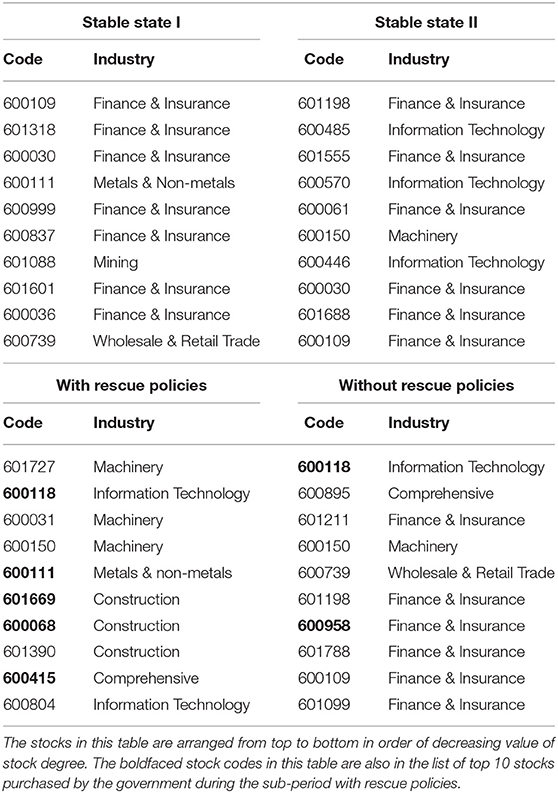
Table 6. Top 10 stocks with the highest mean value of degrees in the stock network for the two stable-state sub-periods and the sub-periods with and without rescue policies in the Shanghai stock market.
From Table 6 one observes that during the stable-state sub-periods, more than half of the top 10 stocks with the highest mean degree belong to the Finance & Insurance industry, which is consistent with the results in Table 3. Furthermore, no stock belongs to the Finance & Insurance industry in the sub-period with rescue policies, whereas more than half of the top 10 stocks belong to the Finance & Insurance industry in the sub-period without rescue policies; this is also consistent with the results in Table 3.
Finally, from Table 6, more than half of the top 10 stocks purchased by the government have large degrees in the sub-period with rescue policies, while only a few stocks purchased by the government have large degrees in the sub-period without rescue policies. All these observations imply that government purchasing behavior greatly affects the degrees of individual stocks and thus changes the entropy of the stock network during the sub-period with rescue policies.
4.4. Universality and Robustness Tests
4.4.1. Universality Test
To test the universality of the empirical results for the Shanghai stock market, we calculate the entropy evolution for the stock network constructed with constituent stocks of the HSI index during the period following the crash on 10 March 2015 in the Hong Kong stock market, for which no government rescue policies existed.
In Figure 3, the entropy evolution of the stock network for the Hong Kong stock market increases slowly throughout the whole period, with a trend similar to the entropy evolution during the period without government rescue policies post-crash in the Shanghai stock market. This implies that the network stability also increases slowly in the Hong Kong stock market, where there were no government rescue policies.
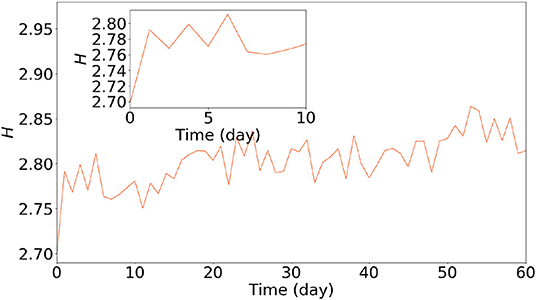
Figure 3. Entropy evolution of the stock network during the 60-day period following the crash on 10 March 2015 in the Hong Kong stock market.
In analogy to the analysis of stock degrees in the Shanghai stock market, we present in Table 7 the top 10 stocks with the highest mean value of degrees in the stock network for the two stable-state sub-periods and the sub-period without rescue polices in the Hong Kong stock market.
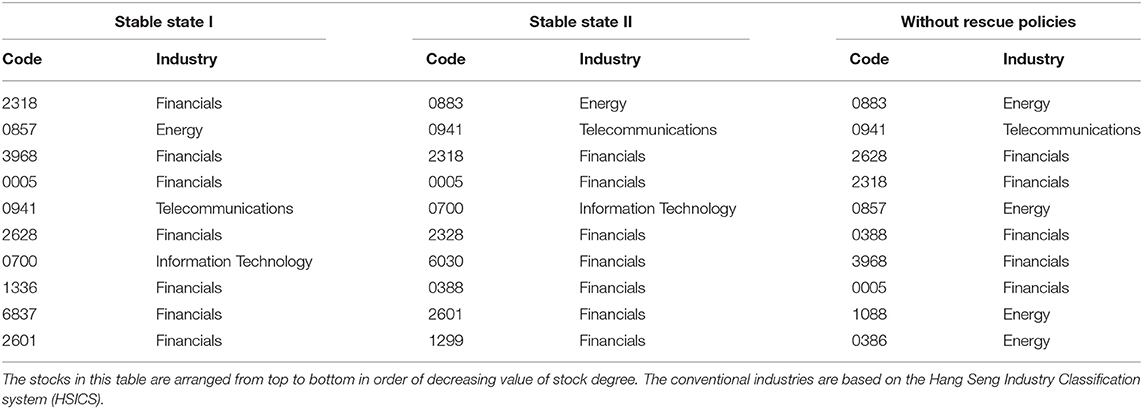
Table 7. Top 10 stocks with the highest mean value of degrees in the stock network for the two stable-state sub-periods and the sub-period without rescue policies in the Hong Kong stock market.
In Table 7, more than half of the stocks belong to the Financials industry during the stable-state sub-periods and the sub-period without rescue policies following the crash that occurred on 10 March 2015 in the Hong Kong stock market, which is consistent with the results on stock degrees during the stable-state sub-periods and the sub-period without rescue policies in the Shanghai stock market.
4.4.2. Robustness Test
To ensure that the previous findings are robust for the network stability measured by entropy calculated with the node degree distribution, here we use another quantity, the relative entropy, to examine the relation between government rescue policies and network stability.
The relative entropy, which is also called the Kullback-Leibler (KL) divergence, is a measure of how a probability distribution differs from another probability distribution [36]. This is useful when we want to compare the degree distributions of, for example, the stable periods and the periods with and without rescue policies after crashes. For complex networks, the relative entropy between two node degree distributions can be defined as
where Q(k) is the node degree distribution during the stable-state period.
Figure 4 presents the relative entropy of the stock network during the sampling period from 16 December 2013 to 22 November 2016 in the Shanghai stock market.
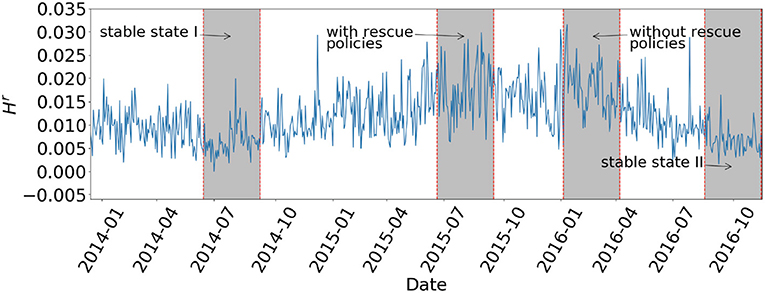
Figure 4. Relative entropy of the stock network for the sampling period from 16 December 2013 to 22 November 2016 in the Shanghai stock market.
As in the analysis of the entropy of the stock network, we find that the mean values of the relative entropy for the sub-periods with and without rescue policies after a crash are 0.0176 and 0.0178, respectively, larger than the mean values of the relative entropy for the stable states I and II (0.0068 and 0.0065, respectively). We also give, in Table 8, the results of a t-test for the significance of the differences between the relative entropies of the stock network during the four sub-periods.
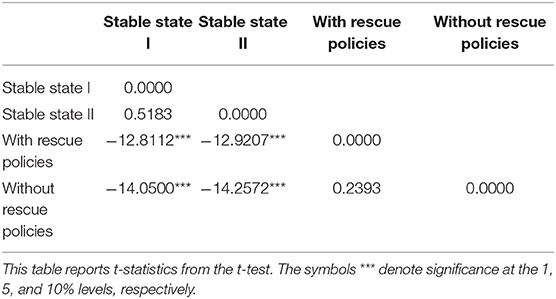
Table 8. Results of t-test for testing the significance of the difference between the entropies of the stock network for different sub-periods in the Shanghai stock market.
Table 8 shows no significant difference between the relative entropies of the stock network for the stable-state sub-periods and the sub-periods with and without rescue policies. These results indicate that the stock network is less heterogeneous and stable during the sub-periods with and without rescue policies, which is consistent with the results obtained from the entropy of the stock network presented above.
Finally, we show in Figure 5 the relative entropy evolution of the stock network for the sub-periods with and without rescue policies. Consistent with the entropy evolution results in Figure 2, the relative entropy evolution of the stock network for the sub-period with rescue policies decreases rapidly at first and much more slowly at later times. For the sub-period without rescue policies, the relative entropy evolution decreases slowly over the whole period. This implies that the rescue policies have only short-term influences on the stock market, and can only increase the heterogeneity and stability of the stock network for a short time. For the sub-period without rescue policies, the heterogeneity and stability of the stock network can also increase slowly.
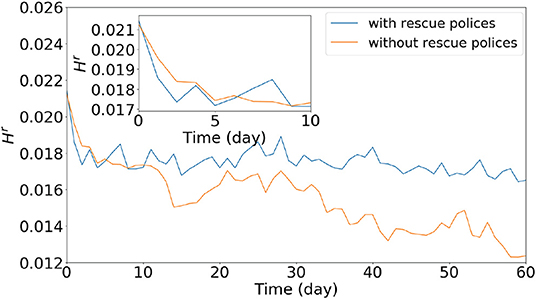
Figure 5. Relative entropy evolution of the stock network during sub-periods with and without rescue policies after crashes in the Shanghai stock market.
5. Conclusion
In this paper, we have studied the influence of government rescue policies on the stability of stock networks after crashes in the Shanghai and Hong Kong stock markets based on the entropy method.
By analyzing the entropy of the stock network in different sub-periods, i.e., stable-state sub-periods and sub-periods with and without rescue policies after a crash, we find that rescue policies have only a short-term influence on the stability of the stock network after a crash, and can improve the network stability for only a short time. Over a longer time, the network stability during a sub-period with rescue policies could increase even more slowly than a sub-period without rescue policies. Further analysis of the relation between stock degrees and government purchasing behavior indicates that government purchasing can lead to significant changes in the degrees of specific stocks during the sub-period with rescue policies, and thus ultimately improve the stability of the stock network.
Our study focuses on the influence of government interventions on network stability measured using entropy. It is of theoretical interest for understanding the relation between external interventions and network topological structure, and further has practical significance for regulators and policymakers who are attempting to stabilize stock markets after crashes.
One can extend the present study to a microscopic analysis by looking at the effects of individual node strengths and link weights on the stability of the stock network after a crash. This can be done by using methods similar to that of Bellingeri et al. [37], for example, and is a topic for future research.
Data Availability Statement
The datasets generated for this study are available on request to the corresponding author.
Author Contributions
M-YY worked on the calculations and drafting. FR and S-PL contributed to the concept design, critical revision, and finalization of the manuscript.
Funding
This work was partially supported by the National Natural Science Foundation of China (grant nos. 71532009, 71790594, and 71871094), the Humanities and Social Sciences Fund sponsored by Ministry of Education of the People's Republic of China (grant no. 17YJAZH067), and the Fundamental Research Funds for the Central Universities (2015).
Conflict of Interest
The authors declare that the research was conducted in the absence of any commercial or financial relationships that could be construed as a potential conflict of interest.
References
1. Holme P, Kim BJ. Growing scale-free networks with tunable clustering. Phys Rev E. (2002) 65:026107. doi: 10.1103/PhysRevE.65.026107
2. Gallos LK, Argyrakis P, Bunde A, Cohen R, Havlin S. Tolerance of scale-free networks: from friendly to intentional attack strategies. Phys A Stat Mech Appl. (2004) 344:504–9. doi: 10.1016/j.physa.2004.06.021
3. Lombardi A, Höfrnquist M. Controllability analysis of networks. Phys Rev E. (2007) 75:056110. doi: 10.1103/PhysRevE.75.056110
4. Li J, Wu J, Li Y, Deng HZ, Tan YJ. Attack robustness of scale-free networks based on grey information. Chinese Phys Lett. (2011) 28:058904. doi: 10.1088/0256-307X/28/5/058904
5. Wu FX, W L, Wang JX, Liu J, Chen LA. Transittability of complex networks and its applications to regulatory biomolecular networks. Sci Rep. (2014) 4:4819. doi: 10.1038/srep04819
6. Dong GG, Du RJ, Hao HF, Tian LX. Modified localized attack on complex network. Europhys Lett. (2016) 113:28002. doi: 10.1209/0295-5075/113/28002
7. Peng J, Lu W, Kurths J. Stochastic basin stability in complex networks. Europhys Lett. (2018) 122:40003. doi: 10.1209/0295-5075/122/40003
8. Zdeborová L, Mézard M. The number of matchings in random graph. J Stat Mech Theor Exp. (2006) 5:05003. doi: 10.1088/1742-5468/2006/05/P05003
9. Liu YY, Slotine JJ, Barabási AL. Controllability of complex networks. Nature. (2011) 473:167–73. doi: 10.1038/nature10011
10. McCowan B, Beisner BA, Capitanio JP, Jackson ME, Cameron AN, Seil S, et al. Network stability is a balancing act of personality, power, and conflict dynamics in Rhesus Macaque societies. PLoS ONE. (2011) 6:e22350. doi: 10.1371/journal.pone.0022350
11. Zhang W, Zhuang X. The stability of Chinese stock network and its mechanism. Phys A Stat Mech Appl. (2019) 515:748–61. doi: 10.1016/j.physa.2018.09.140
12. Heiberger RH. Stock network stability in times of crisis. Phys A Stat Mech Appl. (2014) 393:376–81. doi: 10.1016/j.physa.2013.08.053
13. Arouri M, Estay C, Rault C, Roubaud D. Economic policy uncertainty and stock markets: long-run evidence from the US. Finance Res Lett. (2016) 18:136–41. doi: 10.1016/j.frl.2016.04.011
14. Yang MY, Li SP, Wu Y, Tang J, Ren F. Do government rescue policies reduce the market volatility after crash? Evidence from the Shanghai stock market. Finance Res Lett. (2019) 29:117–24. doi: 10.1016/j.frl.2019.03.020
15. Yan XG, Xie C, Wang GJ. Stock market network's topological stability: evidence from planar maximally filtered graph and minimal spanning tree. Int J Mod Phys B. (2015) 29:1550161. doi: 10.1142/S0217979215501611
16. Albert R, Jeong H, Barabási AL. Error and attack tolerance of complex network. Nature. (2000) 406:378–81. doi: 10.1038/35019019
17. Wang L, Sun YX. Robustness of pinning a general complex dynamical network. Phys Lett A. (2010) 374:15–16. doi: 10.1016/j.physleta.2010.02.024
18. Cancho RFi, Solé RV. Optimization in complex networks. Lect Notes Phys. (2003) 625:114–26. doi: 10.1007/978-3-540-44943-0_7
19. Solé RV, Valverde S. Information theory of complex networks: On evolution and architectural constraints. Lect Notes Phys. (2004) 650:189–207. doi: 10.1007/978-3-540-44485-5_9
20. Wang B, Tang H, Guo C, Xiu Z. Entropy optimization of scale-free networks' robustness to random failures. Phys A Stat Mech Appl. (2006) 363:591–6. doi: 10.1016/j.physa.2005.08.025
21. Billio M, Casarin R, Costola M, Pasqualini A. An entropy-based early warning indicator for systemic risk. J Int Finan Markets Inst Money. (2016) 45:42–59. doi: 10.1016/j.intfin.2016.05.008
22. Mishkin FS, White EN. U.S. stock market crashes and their aftermath: Implications for monetary policy; 2002. NBER working paper No. W8992. Available online at: http://ssrn.com/abstract=315989.
23. Sornette D, Zhou WX. Predictability of large future changes in major financial indices. Int J Forecast. (2006) 22:153–68. doi: 10.1016/j.ijforecast.2005.02.004
24. Choudhry T. World War II events and the Dow Jones industrial index. J Bank Finan. (2010) 34:1022–31. doi: 10.1016/j.jbankfin.2009.11.004
25. Huang WQ, Zhuang XT, Yao S. A network analysis of the Chinese stock market. Phys A Stat Mech Appl. (2009) 388:2956–64. doi: 10.1016/j.physa.2009.03.028
26. Mantegna RN. Hierarchical structure in financial markets. Eur Phys J B. (1999) 11:193–7. doi: 10.1007/s100510050929
27. Tumminello M, Aste T, Di Matteo T, Mantegna RN. A tool for filtering information in complex systems. Proc Natl Acad Sci USA. (2005) 102:10421–6. doi: 10.1073/pnas.0500298102
28. Aste T, Shaw W, Di Matteo T. Correlation structure and dynamics in volatile markets. New J Phys. (2010) 12:085009. doi: 10.1088/1367-2630/12/8/085009
29. Demetrius L, Gundlach V, Ochs G. Complexity and demographic stability in population models. Theor Popul Biol. (2004) 65:211–25. doi: 10.1016/j.tpb.2003.12.002
30. Demetrius L, Manke T. Robustness and network evolution–an entropic principle. Phys A Stat Mech Appl. (2005) 346:682–96. doi: 10.1016/j.physa.2004.07.011
31. Bhattacharjee B, Shafi M, Acharjee A. Investigating the influence relationship models for stocks in Indian equity market: a weighted network modelling study. PLoS ONE. (2016) 11:e0166087. doi: 10.1371/journal.pone.0166087
33. Watts DJ, Strogatz SH. Collective dynamics in 'small-world' networks. Nature. (1998) 393:440–2. doi: 10.1038/30918
34. Albert R, Barabási AL. Statistical mechanics of complex networks. Rev Mod Phys. (2002) 74:47–97. doi: 10.1103/RevModPhys.74.47
35. Lillo F, Mantegna RN. Power-law relaxation in a complex system: omori law after a financial market crash. Phys Rev E. (2003) 68:016119. doi: 10.1103/PhysRevE.68.016119
36. Kullback S, Leibler RA. On information and sufficiency. Ann Math Stat. (1951) 22:79–86. doi: 10.1214/aoms/1177729694
Keywords: stock network, crashes, rescue policies, network stability, entropy, econophysics
Citation: Yang M-Y, Ren F and Li S-P (2020) Stock Network Stability After Crashes Based on Entropy Method. Front. Phys. 8:163. doi: 10.3389/fphy.2020.00163
Received: 11 March 2020; Accepted: 20 April 2020;
Published: 12 June 2020.
Edited by:
Gabjin Oh, Chosun University, South KoreaReviewed by:
Michele Bellingeri, University of Parma, ItalyAbolfazl Ramezanpour, Shiraz University, Iran
Copyright © 2020 Yang, Ren and Li. This is an open-access article distributed under the terms of the Creative Commons Attribution License (CC BY). The use, distribution or reproduction in other forums is permitted, provided the original author(s) and the copyright owner(s) are credited and that the original publication in this journal is cited, in accordance with accepted academic practice. No use, distribution or reproduction is permitted which does not comply with these terms.
*Correspondence: Fei Ren, ZnJlbkBlY3VzdC5lZHUuY24=; Sai-Ping Li, c3BsaUBwaHlzLnNpbmljYS5lZHUudHc=
 Ming-Yuan Yang
 Fei Ren
 Sai-Ping Li