
95% of researchers rate our articles as excellent or good
Learn more about the work of our research integrity team to safeguard the quality of each article we publish.
Find out more
ORIGINAL RESEARCH article
Front. Phys. , 06 May 2020
Sec. Medical Physics and Imaging
Volume 8 - 2020 | https://doi.org/10.3389/fphy.2020.00148
This article is part of the Research Topic Quantification in Nuclear Medicine Imaging View all 11 articles
 Reetta Siekkinen1,2,3*
 Jarmo Teuho1
 Nadia A. S. Smith4
 Andrew Fenwick4
 Anna K. Kirjavainen5
 Kalle Koskensalo1,2
 Antti Saraste1,6
 Mika Teräs2,7
Myocardial perfusion imaging (MPI) with positron emission tomography (PET) allows quantitative temporal measurements of the radioactive tracer distribution in tissue. The quantification for myocardial blood flow (MBF) is conducted with kinetic modeling of the image-derived time-activity curves (TACs) allowing derivation for MBF in units of mL/min per gram of tissue. The ordered-subset expectation maximization (OSEM) reconstruction algorithm with time-of-flight (TOF) and point spread function (PSF) modeling is now routinely employed in cardiac imaging. However, the varying counting statistics of the MPI measurements conducted with short-lived tracers present a challenge for the PET image reconstruction methods. Thus, the effect of the reconstruction methods on the flow quantification needs to be evaluated in a standardized manner. Recently, a novel PET flow phantom modeling the MBF has been developed for investigation of the standardization of the MBF measurements. In this study, the effect of the reconstruction parameters on the image-derived flow values against a known reference flow of the flow phantom was studied with [15O]H2O. The effects were studied by comparison of TACs and relative errors of the image-derived flow values with respect to the phantom-derived reference flow value using 5 repeated PET scans with fixed acquisition parameters using a digital Discovery MI PET/CT system. The reconstruction methods applied were OSEM using both TOF and PSF (OSEM-TOF-PSF) with several matrix sizes (128 x 128, 192 x 192, 256 x 256, 384 x 384), Gaussian filter sizes (4, 8 mm) and OSEM without TOF and PSF (OSEM), with TOF (OSEM-TOF) and with PSF (OSEM-PSF) in addition to recently introduced regularized reconstruction method based on Bayesian-penalized maximum likelihood (Q.Clear). Between repeated measurements, the image-derived flow values showed high repeatability with a SD less than 2 mL/min as well as high accuracy with the maximum error of 7% with respect to the reference flow for all reconstructions. Overall, reconstruction settings had only a small impact on the resulting flow values. In conclusion, due to the small differences detected, any of the implemented reconstruction algorithms on the system can be applied in MPI studies for accurate flow quantification.
Positron emission tomography (PET) is a noninvasive imaging modality allowing quantitative temporal measurements of the radioactive tracer distribution in tissue. By means of myocardial perfusion imaging (MPI) with dynamic PET, the myocardial blood flow (MBF) can be derived by kinetic modeling of the tracer distribution in the myocardium [1–4]. The kinetic modeling employs time-activity-curves (TACs) measured from the blood pool and myocardial tissue, resulting in derivation for MBF in quantitative units of mL/min per gram of tissue. Flow quantification provides important physiologic information, which may be useful to individualize patient therapy. The MPI studies are usually conducted with short-lived radiotracers such as [15O]H2O, [82Rb]Cl or [13N]NH3 [5].
Iterative reconstruction methods in PET, such as ordered-subset expectation maximization (OSEM) algorithm method with time-of-flight (TOF) and point spread function (PSF) modeling are now routinely employed in cardiac imaging [6–8]. In addition, regularized reconstruction methods based on Bayesian-penalized maximum likelihood (Q.Clear) have recently been introduced [9]. However, dynamic scans with short-lived tracers are a challenge for image reconstruction, especially due to ~10 times higher count rates after injection compared to the end of the scan. Moreover, short time frames are used in the beginning of the scan whereas at the end of the scan, the frame times are increased to account for tracer decay and increased noise [7, 10]. Thus, both image quality and quantification need to be preserved in the presence of varying count statistics and image noise.
Previously, Presotto et al. [7] investigated the accuracy of the iterative OSEM reconstruction method, including TOF and PSF, against analytical reconstruction by using a cardiac phantom with [18F]FDG and [13N]NH3. Their study showed an improvement in activity concentration recovery and a decrease in variability when the iterative reconstruction with both TOF and PSF was used. Similarly, Matheoud et al. [11] proved that OSEM reconstruction with TOF and PSF improved the image quality in cardiac [18F]FDG studies. Kero et al. [10] studied the effect of OSEM reconstruction method with TOF on the MBF with [15O]H2O MPI. The authors compared a simultaneous PET/MR system to a PET/CT system. They showed no differences in MBF with or without TOF with the PET/MR system. In addition, O'Doherty et al. [12] studied the Q.Clear reconstruction in [13N]NH3 perfusion studies showing no adverse effect on MBF quantification.
However, technical standardization and investigation of the approaches used for reconstruction of MBF measurements are still required. For oncological [18F]FDG studies, the reports of standardization organizations, such as EARL, have reviewed a large set of factors affecting quantification of standardized uptake value (SUV) [13]. Ferretti et al. [14] investigated the harmonization of the SUVs and discussed that reconstruction methods that allow accurate image-based SUV quantification and not only optimized lesion detection are required. Therefore, it would be of high interest to study the effect of image reconstruction parameters also in flow quantification.
To our knowledge, no such systematic approach has been applied to MBF quantification in PET with [15O]H2O with a reference standard. In previous studies, evaluations of reconstruction method accuracies have been conducted with phantoms in static circumstances using [18F]FDG [7, 11, 15]. The authors investigated both the accuracy of recovery of the activity and parameters that are related to the image quality and detectability of myocardial defects. However, it would be of interest to study also parameters that represent the dynamic state and the kinetics of the MBF. O'Doherty et al. [12] suggested that a phantom representing myocardial perfusion should be used as a standard for kinetic modeling in comparison of reconstruction methods.
Recently, a novel flow phantom has been developed and validated to investigate flow quantification accuracy and precision in dynamic PET studies against a known reference flow value [16]. Consequently, the dynamic phantom offers an ideal standard for investigation of the effect of different image reconstruction methods and reconstruction parameters on the quantified flow values. In this paper, we studied the effect of PET image reconstruction on the image-derived flow values with a wide set of parameters. We used a standard protocol based on the reported factors by EARL to minimize other effects related to image quality and flow quantification. We applied a recently introduced PET flow phantom and [15O]H2O as radiotracer and assessed the effect of image matrix size, Gaussian filter size (GFS), PSF modeling, TOF and regularized reconstruction (Q.Clear) to flow quantification using a recently introduced digital Discovery MI PET/CT system.
This study was conducted with a novel PET flow phantom (DCE Dynamic Flow Phantom, Shelley Medical Imaging Technologies, London, Ontario, Canada). The details of the construction and validation of the phantom are presented in Gabrani-Juma et al. [16]. The phantom set-up includes a peristaltic pump, an injection port, a torso-shaped water-filled shell, flow control valves, flow meters and water containers.
The phantom set-up is represented in Figure 1 [16]. The outer dimensions of the phantom shell are similar to the NEMA image quality phantom. An input chamber (volume of 15.7 mL) as well as an exchange cylinder (volume of 161 mL) with a perforated tube (volume of 35 mL) are located inside the shell of the phantom. The input chamber corresponds to the left ventricle blood pool, while the exchange cylinder and perforated tube mimic the myocardial tissue. The input chamber and exchange cylinder allow to derive image-based input and tissue activity curves. The flow running in the phantom system is adjusted with a peristaltic pump, where the flow is marked as Qpump in units of mL/min. Qpump is assumed to be equal to the flow inside the input chamber. From the input chamber water proceeds to the perforated tube inside the exchange cylinder. Water passes from the perforated tube to the exchange cylinder through small holes. The water flow inside the perforated tube is marked as Qtube and the water flow out from the exchange cylinder is marked as Qcyl. These values can be controlled with two flow control valves. Overall, it is assumed that the sum of Qtube and Qcyl should be equal to Qpump:
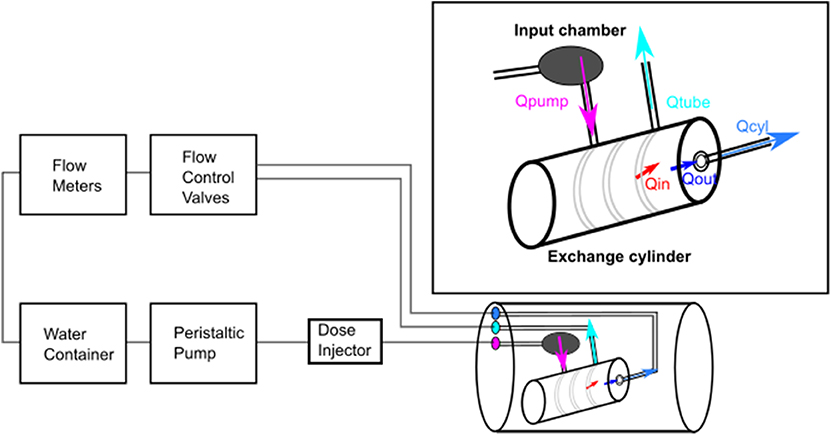
Figure 1. Flow phantom set-up. The peristaltic pump creates the flow inside the phantom with a constant flow rate Qpump. The phantom shell includes an input chamber and an exchange cylinder, where both the image-derived input function and tissue activity curves can be defined by region-of-interest analysis. A perforated tube is located inside the exchange cylinder, where the tracer passes from the tube to the cylinder. The flow inside the perforated tube is Qtube and inside the exchange cylinder Qcyl which are controlled with flow control valves. Qin and Qout are the modeled image-derived flow values. Qin represents flow from the perforated tube to the exchange cylinder and Qout flow out from the exchange cylinder [16].
The actual flow meter readings Qtube and Qcyl are recorded during the image acquisition using two microturbine flow meters (Omega Engineering Inc.) [17]. Flow meter calibration is conducted by following the calibration protocol. The system is run with several flow rates and the flow meter readings are recorded. The recorded values are plotted against the theoretical flow rates. Finally, the reference flow (Qref) to which image derived values are compared is derived based on measured values from Qcyl using a lookup table [16].
The image-derived flow values with the phantom are derived using kinetic modeling with a two-compartmental model [16]. The two-compartmental model is implemented in the software QuantifyDCE provided by the phantom vendor (QuantifyDCE 1.1, Shelley Medical Imaging Technologies, London, Ontario, Canada).
The modeling of image-derived flow values is based on TACs measured by a volume-of-interest (VOI) analysis. VOI delineation is conducted by selecting the center point of the input chamber and exchange cylinder from the PET images. Spherical region-of-interests (ROIs) at the center points with a specific diameter for input chamber and exchange cylinder are automatically produced and the VOI is delineated by searching all pixel values corresponding a certain threshold range within the ROI. Finally, the activity concentrations in the input chamber (CinletVOI(t)) and in the exchange cylinder (CcylVOI(t)) are derived by summing the VOI pixel values, multiplied by the pixel volume and divided by the input chamber and exchange cylinder volumes, respectively [16].
The software models the tracer activity concentration in the exchange cylinder over time as:
where * represents the discrete convolution operation, Ccyl(t) represents the time-dependent tracer concentration in the exchange cylinder, qin represents the tracer wash-in rate to the exchange cylinder (min−1), and qout represents the tracer wash-out rate from the exchange cylinder (min−1). Ctube(t) is equal to the activity concentration in the perforated tube and is estimated based on the CinletVOI(t) where a time delay factor is taken into account. Finally, as Ccyl(t) contributes signal from both the exchange cylinder and the perforated tube, the pure activity concentration in the exchange cylinder is modeled with an input signal fraction (ISF) corresponding to the signal mixing from the perforated tube to the exchange cylinder as:
Thus, the model contains four parameters, delay, ISF, qin and qout which are solved using the standard approach of non-linear least-squares fitting. The modeled parameters for rate constants qin and qout in units of min−1 can be converted to final image-derived flow values Qin and Qout (units of mL/min) when they are multiplied by the cylinder volume (Vcyl = 161mL).
Thus, Qin (Qin = Vcyl × qin) represents the flow from the perforated tube to the exchange cylinder and Qout (Qout = Vcyl × qout) the flow out from the exchange cylinder. Ultimately, they should be equal to Qref as no losses should occur in the phantom:
The phantom was imaged with a digital Discovery MI PET/CT system (DMI, GE Healthcare, Milwaukee, US). The DMI PET detector system consists of 4 rings of detector blocks. One detector ring comprises 136 detector blocks. Each block employs 3 x 6 array of silicon photomultiplier (SiPM) detectors with a 4 x 9 array of lutetium-yttrium oxyorthosilicate (LYSO) crystals with one crystal element size of 3.95 x 5.3 x 25 mm. The axial and transaxial FOV sizes of the DMI are 20 and 70 cm, respectively. The NEMA performance parameters of the DMI are 13.7 cps/kBq for sensitivity, 4.10 cm for radial spatial resolution at 1 cm distance from the FOV center, 193 kcps for peak noise-equivalent count rate (NECR), 21.9 kBq/mL for peak NECR activity, 40.6% for peak NECR scatter fraction, 375 ps for timing resolution and 9.40% for energy resolution [18].
The PET data acquisition was conducted using 5 repeated scans in the PET/CT system using the same phantom set-up. To ensure repeatability, the acquisition parameters were fixed for each measurement as recommended in [19]. The measurements were conducted by following the clinical perfusion protocol used in the Turku PET Centre [20] as follows. The injection and measurement of doses were performed using the Hidex automatic dispenser system (Hidex OY, Turku, Finland). [15O]H2O was injected separately for each measurement with a target dose of 500 MBq. Dynamic PET scan was started after a time delay after the injection and acquired as list-mode. Frame times of 14 x 5 s, 3 x 10 s, 3 x 20 s, and 4 x 30 s were used leading to a total scan time of 4 min and 40 s.
The phantom shell was set on the system table and a CT based attenuation correction (CTAC) scan was acquired using the low-dose protocol with tube voltage of 120 kVp and 63–65 mAs. For each repetition, an individual CTAC was acquired. The PET scan was acquired following the perfusion protocol. The injected doses for repeated measurements were in the range of 463–495 MBq (Table 1). The time delay between the injection and the scan start time are presented in Table 1.
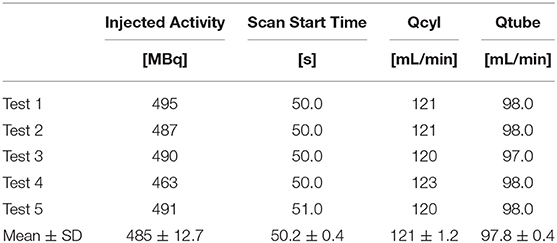
Table 1. Scan parameters for all repeated scans.
For each measurement, a fixed Qpump of 200 mL/min was used. Qcyl was adjusted to 60% of Qpump with a flow rate of ~120 mL/min and Qtube of 98 mL/min. The flow meter readings were recorded between CTAC and dynamic PET scans. The recorded flow values are also presented in Table 1. The flow rates follow what has been reported before [16].
To investigate the effect of image reconstruction to the image-derived flow values, different reconstruction parameters were used and the reconstructions were performed similarly for all repeated measurements.
The OSEM reconstructions with TOF and PSF (OSEM-TOF-PSF) with different matrix sizes and GFS, as well as OSEM without TOF and PSF (OSEM), with TOF (OSEM-TOF) and with PSF (OSEM-PSF) with a single matrix size (192 x 192) and a single GFS (5 mm) were investigated. In all reconstructions, a 3D-OSEM algorithm with 3 iterations, 16 subsets and a FOV size of 50 cm was used. In addition, we studied the effect of regularized reconstruction Q.Clear with β = 350 (QCFX) with an image matrix size of 192 x 192. The default value for β on the Discovery MI system was used, which defines the term to penalize image intensity differences between neighboring pixels, such as image noise. The reconstruction methods are summarized in Table 2.
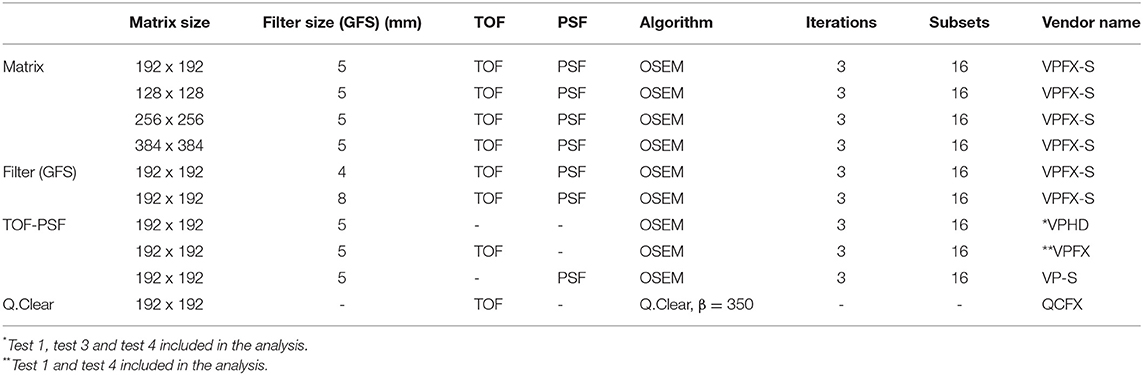
Table 2. Reconstruction parameters applied in the flow phantom study, separated according to matrix and filter (GFS) size, TOF and PSF and regularized Q.Clear reconstruction.
It should be noted that due to technical difficulties in the DICOM data export to QuantifyDCE version 1.1, the OSEM reconstruction (Table 2, VPHD) could not be analyzed for tests 2 and 5 and the OSEM-TOF reconstruction (Table 2, VPFX) could not be analyzed for the test 2, 3, and 5. The phantom vendor has been notified about the issue and will provide an update in the software in the future.
To study the effect of the reconstruction parameters, the input (input cylinder) and tissue (exchange cylinder) TACs from all the reconstructions were derived from the phantom using QuantifyDCE 1.1 software by a semi-automated VOI analysis performed similarly for all reconstructed images. The parameters used to define the VOIs for all the reconstructions were fixed: sphere radius of 4 and 6 cm for input chamber and exchange cylinder, 15% threshold for both, volume of 15.7 mL and 161 mL for input chamber and exchange cylinder and a pixel volume of 19 mm3. The final VOI was defined based on activity concentration values of 15% of the maximum activity concentration within the sphere semi-automatically by QuantifyDCE software. The extracted TACs were visually inspected to investigate their shape between subsequent repeats and reconstructions. The areas under the input and tissue curves (AUC) were computed to analyze the AUC value over all subsequent measurements and reconstructions.
Finally, the phantom-derived flow values Qin and Qout were investigated. The flow values Qin and Qout were derived by the image-based two compartmental kinetic modeling presented in Kinetic Modeling of Flow Values. The mean values and standard deviations (SD) of the AUC and flow values were calculated. The relative errors of the Qin and Qout flow values with respect to the reference flow value Qref were calculated using the following equation
where flow value is either Qin or Qout and Qref is the reference flow value derived from recorded Qcyl values and using a lookup table.
We report the mean and SDs of the input and tissue TACs over all the subsequent measurements and reconstructions. Similarly, we present the AUC values from input and tissue TACs as well as the image-derived Qin and Qout flow values. Qin and Qout errors with respect to Qref are reported over all subsequent measurements per each reconstruction.
The mean input and tissue TACs with their SDs from all reconstructions are shown in Figure 2. No clear difference between the TACs derived from the images reconstructed with OSEM-TOF-PSF with different matrix sizes, GFSs or Q.Clear is noted. Thus, only one input and tissue TAC is presented for those reconstructions in Figure 2A. However, TACs derived from images reconstructed with OSEM, OSEM-TOF or OSEM-PSF show differences in the input and tissue curve shape and thus, all those TACs are presented in Figure 2B. The input peaks of those reconstructions are shown beside the TACs in order to illustrate the difference. Overall, the deviation in TACs between subsequent measurements is similar for all reconstructions.
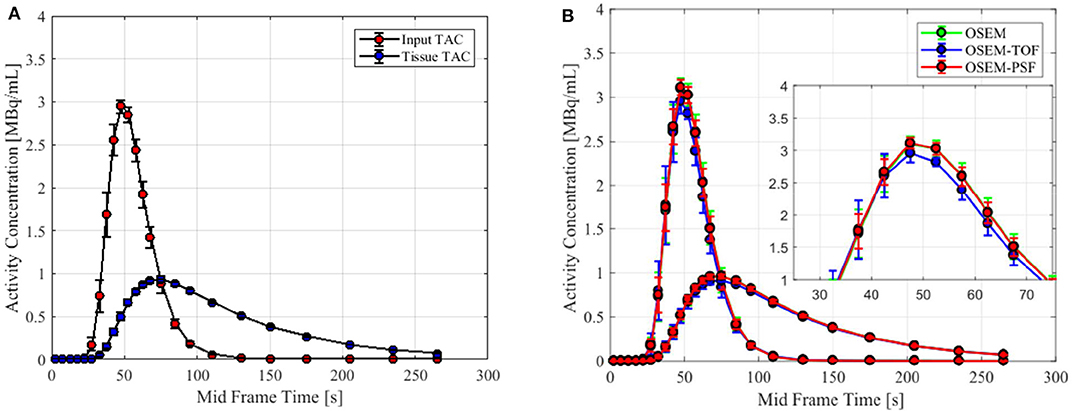
Figure 2. Input and tissue time-activity curves (TAC) presented for the reconstructions. In (A) is shown the TACs of the Q.Clear reconstruction, similar to OSEM-TOF-PSF reconstructions with different matrix sizes and GFS values and thus, are not shown separately. In (B) the TACs of the OSEM, OSEM-TOF, and OSEM-PSF reconstructions are shown with a zoom-in to the input peak. Difference in shape and amplitude between the TACS of the reconstructions is seen. The 50 s delay has not been included in the TACs.
The AUC values of the TACs for all the reconstructions are shown in Figure 3. The input AUC values were higher in comparison to the tissue AUC values over all the reconstructions. The AUCs were similar between the TACs that were derived from the images reconstructed with OSEM-TOF-PSF with different matrix sizes and GFS values. Using the OSEM and OSEM-PSF reconstruction, the AUC values were systematically higher for both the input and tissue TAC when compared to other reconstructions. Q.Clear produced similar AUC values for the tissue curves as the OSEM-TOF-PSF with different matrix sizes and GFS values as well as the OSEM-TOF. However, slightly lower values for the input curves were noted with the Q.Clear and OSEM-TOF reconstruction.
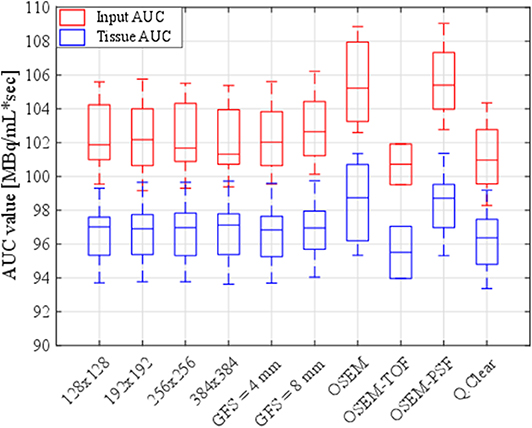
Figure 3. Boxplots of input and tissue AUC values over all the subsequent measurements for all the reconstructions.
The mean values and SDs of both the Qin and Qout flow values and their relative errors with respect to the reference flow over all the subsequent measurements per each individual reconstruction are summarized in Table 3. The values for the reference flow Qref were 140, 140, 139, 142, and 139 mL/min for the five measurements, respectively with a mean value of 140 mL/min. The image-derived wash-in flow Qin is similar over all the reconstructions, whereas the wash-out flow Qout shows the greatest difference to other Qout values when using OSEM and OSEM-PSF reconstruction. This effect is similar to what is seen in the AUC analysis. The error between mean Qin and Qout as well as of the Qin and Qout with respect to Qref are within 5% for all the reconstructions (Table 3).
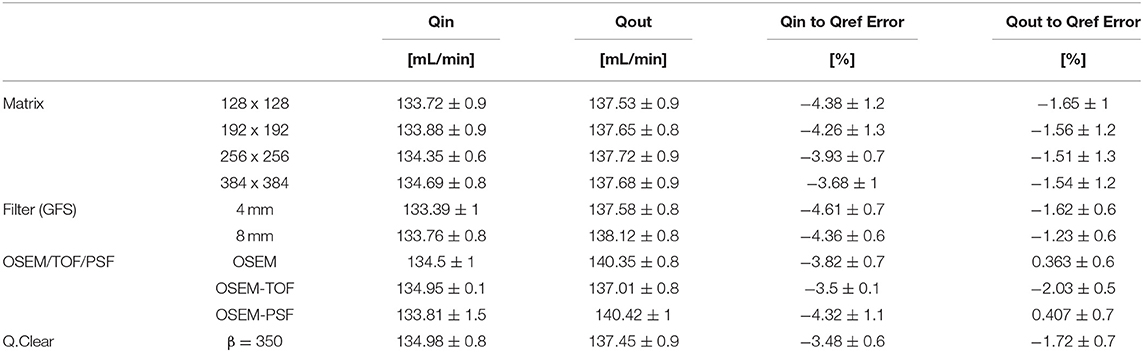
Table 3. The mean and SD values for the Qin and Qout flow values and for their relative differences with respect to the reference flow Qref (mean Qref = 140 mL/min) over all the subsequent measurements for all the reconstructions.
Figure 4 shows the distribution and median of the flow values Qin and Qout and their relative errors with respect to the reference flow value Qref. It can be seen that the wash-in flow Qin varies more across different reconstruction parameters. The wash-out flow Qout is relatively stable across different matrix sizes and GFS values. The largest differences in both Qin and Qout are seen when using OSEM or OSEM-PSF reconstruction, with respect to the other reconstruction parameters. The Q.Clear is comparable to the OSEM-TOF-PSF with different matrix sizes and GFS values as well as to OSEM-TOF. For the Qout error with respect to Qref, the OSEM and OSEM-PSF reconstructions show positive bias towards the reference flow when all the other reconstructions show negative bias. The Qin error with respect to Qref shows negative bias for all the reconstructions.
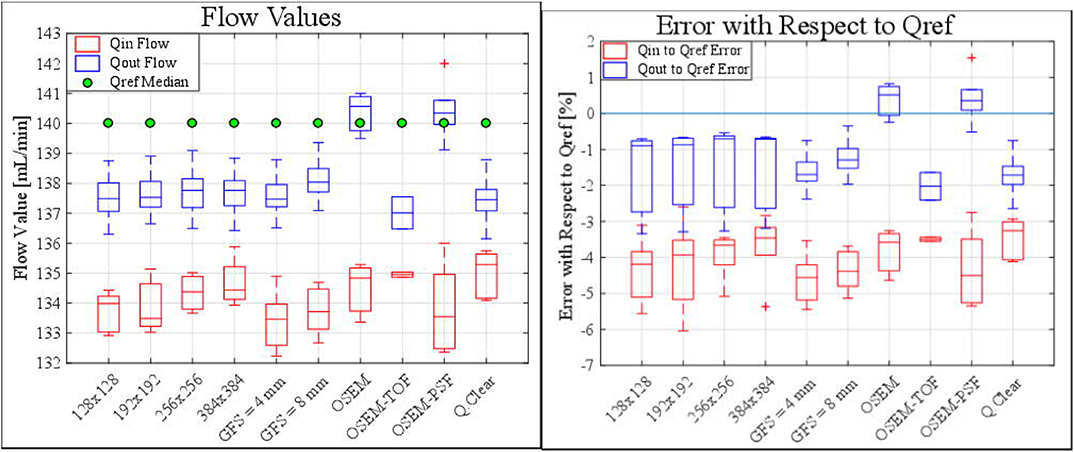
Figure 4. Boxplots show the distribution and median of Qin and Qout (A) flow values and (B) errors with respect to Qref (reference flow) for all the subsequent reconstructions over all the measurements. The median value for the reference flow Qref for all reconstructions was measured as 140 mL/min.
In this study, the effect of reconstruction parameters to the image-derived flow values (Qin, Qout) using a PET flow phantom was investigated. The reconstruction methods were studied in terms of image matrix size, GFS, TOF, PSF modeling, and Q.Clear. The measurements were conducted with a repeated protocol with fixed acquisition parameters. The effects were analyzed in regard to the AUCs of input and tissue curves as well as to the relative errors of the modeled flow against the reference flow.
The shape and amplitude of both the input and tissue TACs were in mutual agreement in regard to the visual analysis of the TACs between reconstructions. However, images reconstructed with OSEM, OSEM-TOF, or OSEM-PSF, showed a slightly different shape and amplitude of the TACs compared to other reconstructions (Figure 2). As a consequence, their measured AUC values deviated from the other AUCs (Figure 3). When reconstructed with OSEM-TOF-PSF with different matrix sizes and GFS values, as well as with Q.Clear, the AUC values were similar. Moreover, as the SD of both the input and tissue TACs was similar over all reconstructions, the measurements showed good reproducibility. Visually, no differences in image noise between repeated measurements were seen.
Qin and Qout flow values were modeled based on the image-derived TACs. The kinetic modeling was conducted by using a two-compartmental model. Generally, smaller values were measured for Qin compared to Qout, systematically (Figure 4, Table 3). Also, Qin showed more variability across repeated measurements for all reconstructions compared to Qout. Qout is determined from the exponential term (Equation 2), which corresponds to a clearance rate (k2), making it less susceptible for variations in activity, as explained in the study of Kero et al. [10]. However, it should be noted that regardless of the measurement or the reconstruction parameter applied, the measured absolute relative errors were smaller than 7% for both Qin and Qout flow values with respect to the reference flow value (Figure 4B). This variation can be considered to be small in context of clinical practice, where a test-retest reproducibility of 16% is still considered acceptable [21]. This suggests that overall, the measurements were both accurate and reproducible despite the effect of reconstruction parameters and protocols. Reproducibility is also attributed to similar behavior of image corrections for all repeated measurements, careful and reproducible measurements and consistent orientation of the phantom.
In line with the AUC analysis, the modeled Qin and Qout flow values were higher when using OSEM and OSEM-PSF reconstructions compared to other reconstructions (Figure 4, Table 3). This produced a positive Qout to Qref error compared to other reconstructions (Figure 4B, Table 3). OSEM-PSF reconstruction produced the highest variation of Qin with an SD of 1.52 mL/min (Table 3). Overall, the difference between Qin and Qout was similar between other reconstructions, while the OSEM and OSEM-PSF reconstructions showed opposite behavior between Qout and Qin values.
It seems that Qin is affected more by the selected reconstruction parameters than Qout and can be due to the fact that the modeled parameter Qin is more sensitive by the slight variation of the TACs between measurements (Figure 4). Moreover, Qin increases slightly with respect to the reconstruction matrix size (Figure 4, Table 3). In these cases, the Qin errors with respect to Qref decrease as the reconstruction matrix sizes increase, while the Qout error remain stable (Figure 4, Table 3). Applying a 4 and 8 mm GFS caused an error of similar magnitude but with less variability for both Qin and Qout when compared to the reconstructions with different matrix sizes. Overall, the matrix size or the applied filter does not seem to affect the wash-out flow Qout, whereas the wash-in flow Qin shows a dependency on both the matrix and filter size. However, this dependency can be assumed to be negligible.
With the Q.Clear reconstruction, Qin and Qout as well as their relative errors remain within the same range with OSEM-TOF-PSF reconstructions with different matrix sizes and GFS values as well as with OSEM-TOF. These results also follow to the measured AUC values. Ideally, both Qin and Qout should be equal to each other as well as to Qref. In this regard, using Q.Clear, the smallest difference between Qin and Qout values as well as Qin and Qout values of similar magnitude with respect to OSEM-TOF-PSF and OSEM-TOF reconstructions were produced. The difference between Qin and Qout flow is attributed by the characteristics of the reconstruction algorithm to handle the accurate activity recovery during both in the presence of high activity in the early frames and during the increase of noise in later frames. In theory, an accurate image reconstruction algorithm should be able to minimize the bias between Qin and Qout. Naturally, the difference between Qin or Qout with respect to Qref is affected by the recovery of activity distribution measured with a PET system. In an ideal PET system and perfect measurement, both Qin and Qout would correspond to each other and Qref fully.
Concerning the effect of different reconstruction parameters to the image quality over the entire scan time in addition to the image-derived flow values, the results indicate that the image quality is stable over the entire dynamic scan, as the SD of the TACs over all the measurements is of similar magnitude for all reconstructions. In addition, the measurements indicate high repeatability, as the SD of the flow values over all the measurements is smaller than 1.6 mL/min for any reconstruction. Moreover, despite of the applied reconstruction parameters, a high accuracy of flow values was achieved, as the absolute relative error was smaller than 7% for any reconstruction and measurement. Overall, the differences were small in terms of AUCs and Qin and Qout flow values. The largest differences for Qin and Qout were in a range of 2% at maximum. This suggests that applied reconstruction parameters had little impact to the resulting flow values. Moreover, the magnitude of these variations can be considered to be small in the clinical context.
Previously, O'Doherty et al. [12] suggested applying a physical reference standard to determine the effects of different PET image reconstruction parameters in dynamic PET studies. We applied a dynamic flow phantom that provides accurate and precise flow measurements by two-compartmental kinetic modeling from image-derived TACs. In relation to the reference flow, the image-derived flow values were used for the analysis of effect of reconstructions over several reconstruction parameters. Moreover, previous evaluations on patients performed by both Kaufmann et al. [22] and Kero et al. [10] have shown that reproducible MBF with [15O]H2O can be measured in patient studies as well. In that regard, our phantom study using [15O]H2O complements such findings.
The results from the analysis of the effect of different reconstruction methods and their parameters are in line with the studies of Matheoud et al. [11] and Presotto et al. [7] who reported improved image quality and activity recovery in [18F]FDG cardiac studies when iterative reconstruction OSEM with TOF and PSF was used. Our study showed that the TACs and thus AUCs remain uniform with reconstructions where both TOF and PSF were applied.
The results of this study show a difference in the AUCs between non-TOF and TOF reconstructions, which is explained by the faster convergence rate of TOF reconstruction compared to PET reconstruction in most objects [23–26]. Therefore, less iterations are needed to obtain the same contrast. Preferably, the amount of iterations in the non-TOF reconstruction should be increased to match better the convergence of TOF. However, in practice this is very hard to achieve due to object-dependent convergence in the OSEM reconstruction.
In addition, the difference in image-derived flow values in non-TOF and TOF reconstructions is also attributed by different noise characteristics of the reconstructed PET images and how well the two-compartmental model handles noise. The data in Kero et al. [10] shows that non-TOF reconstruction produces slightly higher MBF compared to TOF reconstruction. We also noted a similar effect between TOF and non-TOF algorithms. As shown in the study of Iida et al. [4], added noise in the input function will result in more positive bias and variance in the modeled flow value. The slightly higher Qout value seen in non-TOF reconstruction is partly attributed by the lower SNR in the non-TOF reconstruction compared to the TOF reconstruction. Kero et al. [10] also discussed that MBF values are not affected by the additional filtering. The results of our study also show that the image-derived flow values are not considerably affected by the different GFS values.
The reproducibility of MBF values has been recently compared between a PET/CT Discovery STE system (GE Healthcare, Milwaukee, US) and a PET/MR Signa system (GE Healthcare, Milwaukee, US) in the study of Kero et al. [10]. The authors reported no difference on MBF when using TOF or altering filter or reconstruction settings in the PET-MR. This is in line with our study, as the difference between Qin and Qout values with respect to Qref between non-TOF and TOF reconstructions was only 2% at maximum. They also reported an average MBF of 2.74 ± 1.37 on PET/CT stress and average MBF of 2.65 ± 1.15 on PET/MR stress studies. The average difference in the Qin and Qout measurements between different reconstructions are of similar magnitude in our study (Table 3).
Finally, the results from the analysis of Q.Clear reconstructions are in line with the study of O'Doherty et al. [12]. They reported that the Q.Clear noise level is correspondent to the OSEM reconstruction when the value of β = 300 was used. In our study, the Q.Clear AUC values are in relation with the OSEM-TOF-PSF reconstructions that apply different matrix sizes and GFS values as well as with OSEM-TOF reconstruction when the default value of β = 350 was used. The minor difference in the β value might be due to different PET/CT systems applied in our study versus the study in [12]. Similarly, O'Doherty et al. [12] showed that the Q.Clear effect to the quantification of MBF is minor, as can also be seen from our study as the image-derived flow values were similar with the Q.Clear reconstruction compared to other reconstructions.
In this study, a novel flow phantom was used. Some fluctuations in the phantom appear between the repetitive measurements due to the [15O]H2O injections in the system, as can be seen from the reference flow over repeated measurements (140, 140, 139, 142, and 139 mL/min). However, this fluctuation is very small, as it is 3 mL/min at maximum. In an ideal system, the image-derived flow values Qin and Qout should be fully equal to each other, and fully equal to the reference flow Qref value. In this phantom set-up, we detected a maximum difference of 6 mL/min between Qin and Qout and maximum difference of 9 mL/min between Qin, Qout and Qref. This fluctuation can be considered small as well.
The relation between clinically used MBF values and the phantom flow values can be regarded to the rate parameters derived from the two-compartmental model as discussed in Gabrani-Juma et al. [16]. As the K1 and k2 derived from the clinical two-compartmental model are analogous to the qin and qout derived from the two-compartmental model of the phantom, the behavior of Qin and Qout values can be related to correspond to the behavior of MBF in similar circumstances. However, as the phantom does not fully represent the physiology of blood perfusion in myocardial tissue, the correspondence to MBF should be further investigated in the future. The phantom lacks of background activity, as the only source of activity in the shell is coming from the input chamber and exchange cylinder. Thus, addition of background activity and its effect to the flow quantification accuracy could be studied further in the future. Nevertheless, we have shown that the flow phantom offers a feasible solution for simulation and the modeling of the kinetics in myocardial perfusion imaging with PET and provides a physical reference standard to investigate the effect of different reconstruction methods in a reproducible manner.
This study was also limited by conducting the measurements with only one PET/CT system. Also, it was not possible to assess filtered back projection (FBP) algorithm, as it is not implemented on the Discovery MI. The system also implements only one iterative reconstruction algorithm (OSEM). In addition, the analysis was conducted using a single software specifically designed for flow quantification on the phantom. Thus, the results of this study serve as a baseline for the current status in flow quantification when using different reconstruction parameters on the Discovery MI PET/CT system. The methodologies presented here can be further used to study the reproducibility of flow values among different PET/CT systems, or to implement harmonization and optimization protocols in the future.
Accordingly, the presented methodology with the achieved results could be applied as a basis for harmonizing the reconstruction parameters for MPI studies with [15O]H2O and other radiotracers as well. However, the optimization of the reconstruction parameters with different combinations, including other radiotracers, should be conducted as an extension of the current study. Optimally, the reconstruction methods should be fixed in terms of parameters to avoid systematic errors and to increase reproducibility. In the future, the reconstruction parameters should be harmonized between several PET/CT systems to improve both the accuracy and precision in the MBF quantification further.
The effect of different matrix size, Gaussian filter size, TOF and/or PSF as well as Q.Clear reconstruction to image-derived flow values was small. Overall, different reconstruction settings had little impact to the resulting flow values with Discovery MI PET/CT using [15O]H2O. The modeled flow values showed a variation with a SD of less than 2 mL/min as well as absolute relative errors of <7% between subsequent measurements. The differences in measured flow values between reconstruction algorithms were 2% of maximum. In conclusion, the reconstruction algorithms evaluated can be applied in MPI studies for accurate flow quantification.
The datasets generated for this study are available on request to the corresponding author.
RS and JT conceived and designed the study. RS wrote the manuscript with support from JT. RS, JT, and AK carried out the experiments and KK contributed in assisting RS and JT constructing the phantom and collecting the data. NS and AF contributed in the design of the study, evaluation and writing of the manuscript. AS and MT supervised the findings of the work and the project. All authors contributed to the consultation of the results and writing the final manuscript.
This project (15HLT05 PerfusImaging) has received funding from the EMPIR programme co-financed by the Participating States and from the European Union's Horizon 2020 research and innovation programme. This study was funded by the Academy of Finland (grant number 314483, project MINMOTION).
The authors declare that the research was conducted in the absence of any commercial or financial relationships that could be construed as a potential conflict of interest.
Shelley Medical Imaging Technologies are acknowledged for their assistance with this study. The study was conducted within the Finnish Center of Excellence in Molecular Imaging in Cardiovascular and Metabolic Research supported by the Academy of Finland, University of Turku, Turku University Hospital, and Åbo Akademi University.
1. Juneau D, Erthal F, Ohira H, Mc Ardle B, Hessian R, deKemp RA, et al. Clinical PET myocardial perfusion imaging and flow quantification. Cardiol Clin. (2016) 34:69–85. doi: 10.1016/j.ccl.2015.07.013
2. Moody JB, Lee BC, Corbett JR, Ficaro EP, Murthy VL. Precision and accuracy of clinical quantification of myocardial blood flow by dynamic PET: a technical perspective. J Nucl Cardiol. (2015) 22:935–51. doi: 10.1007/s12350-015-0100-0
3. Iida H, Rhodes CG, Desilva R, Yamamoto Y, Araujo LI, Maseri A, et al. Myocardial tissue fraction - correction for partial volume effects and measure of tissue viability. J Nucl Med. (1991) 32:2169–75.
4. Iida H, Rhodes CG, de Silva R, Araujo LI, Bloomfield PM, Lammertsma AA, et al. Use of the left ventricular time-activity curve as a noninvasive input function in dynamic oxygen-15-water positron emission tomography. J Nucl Med. (1992) 33:1669–77.
5. DeGrado TR, Bergmann SR, Ng CK, Raffel DM. Tracer kinetic modeling in nuclear cardiology. J Nucl Cardiol. (2000) 7:686–700. doi: 10.1067/mnc.2000.111127
6. Søndergaard HM, Madsen MM, Boisen K, Bøttcher M, Schmitz O, Nielsen TT, et al. Evaluation of iterative reconstruction (OSEM) versus filtered back-projection for the assessment of myocardial glucose uptake and myocardial perfusion using dynamic PET. Eur J Nucl Med Mol Imaging. (2007) 34:320–9. doi: 10.1007/s00259-006-0198-z
7. Presotto L, Gianolli L, Gilardi MC, Bettinardi V. Evaluation of image reconstruction algorithms encompassing time-Of-Flight and point spread function modelling for quantitative cardiac PET: phantom studies. J Nucl Cardiol. (2015) 22:351–63. doi: 10.1007/s12350-014-0023-1
8. Le Meunier L, Slomka PJ, Dey D, Ramesh A, Thomson LEJ, Hayes SW, et al. Enhanced definition PET for cardiac imaging. J Nucl Cardiol. (2010) 17:414–26. doi: 10.1007/s12350-010-9193-7
9. Teoh EJ, McGowan DR, Macpherson RE, Bradley KM, Gleeson F V. Phantom and clinical evaluation of the bayesian penalized likelihood reconstruction algorithm q.Clear on an lYSO PET/CT system. J Nucl Med. (2015) 56:1447–52. doi: 10.2967/jnumed.115.159301
10. Kero T, Nordström J, Harms HJ, Sörensen J, Ahlström H, Lubberink M. Quantitative myocardial blood flow imaging with integrated time-of-flight PET-MR. EJNMMI Phys. (2017) 4:1–13. doi: 10.1186/s40658-016-0171-2
11. Matheoud R, Lecchi M, Lizio D, Scabbio C, Marcassa C, Leva L, et al. Erratum to: comparative analysis of iterative reconstruction algorithms with resolution recovery and time of flight modeling for 18F-FDG cardiac PET: a multicenter phantom study (J nUCL cARDIOL, 10.1007/S12350-015-0385-Z). J Nucl Cardiol. (2017) 24:1101. doi: 10.1007/s12350-016-0415-5
12. O' Doherty J, McGowan DR, Abreu C, Barrington S. Effect of bayesian-penalized likelihood reconstruction on [13N]-NH3 rest perfusion quantification. J Nucl Cardiol. (2017) 24:1457. doi: 10.1007/s12350-017-0892-1
13. Aide N, Lasnon C, Veit-Haibach P, Sera T, Sattler B, Boellaard R. EANM/EARL harmonization strategies in PET quantification: from daily practice to multicentre oncological studies. Eur J Nucl Med Mol Imaging. (2017) 44:17–31. doi: 10.1007/s00259-017-3740-2
14. Ferretti A, Chondrogiannis S, Rampin L, Bellan E, Marzola MC, Grassetto G, et al. How to harmonize sUVs obtained by hybrid PET/CT scanners with and without point spread function correction. Phys Med Biol. (2018) 63:aaee27. doi: 10.1088/1361-6560/aaee27
15. Mananga ES, El Fakhri G, Schaefferkoetter J, Bonab AA, Ouyang J. Myocardial defect detection using PET-CT: phantom studies. PLoS ONE. (2014) 9:e88200. doi: 10.1371/journal.pone.0088200
16. Gabrani-Juma H, Clarkin OJ, Pourmoghaddas A, Driscoll B, Wells RG, Dekemp RA, et al. Validation of a multimodality flow phantom and its application for assessment of dynamic sPECT and PET technologies. IEEE Trans Med Imaging. (2017) 36:132–41. doi: 10.1109/TMI.2016.2599779
17. Driscoll B, Keller H, Jaffray D, Coolens C. Development of a dynamic quality assurance testing protocol for multisite clinical trial dCE-CT accreditation. Med Phys. (2013) 40:8. doi: 10.1118/1.4812429
18. Hsu DFC, Ilan E, PETerson WT, Uribe J, Lubberink M, Levin CS. Studies of a next-Generation silicon-Photomultiplier-Based time-of-Flight PET/CT system. J Nucl Med. (2017) 58:1511–8. doi: 10.2967/jnumed.117.189514
19. Boellaard R. Standards for PET image acquisition and quantitative data analysis. J Nucl Med. (2009) 50:11S−20S. doi: 10.2967/jnumed.108.057182
20. Maaniitty T, Stenström I, Bax JJ, Uusitalo V, Ukkonen H, Kajander S, et al. Prognostic value of coronary cT angiography with selective PET perfusion imaging in coronary artery disease. JACC Cardiovasc Imaging. (2017) 10:1361–70. doi: 10.1016/j.jcmg.2016.10.025
21. El Fakhri G, Kardan A, Sitek A, Dorbala S, Abi-Hatem N, Lahoud Y, et al. Reproducibility and accuracy of quantitative myocardial blood flow assessment with 82Rb PET: comparison with 13N-ammonia PET. J Nucl Med. (2009) 50:1062–71. doi: 10.2967/jnumed.104.007831
22. Kaufmann PA, Gnecchi-Ruscone T, Yap JT, Rimoldi O, Camici PG. Assessment of the reproducibility of baseline and hyperemic myocardial blood flow measurements with 15O-labeled water and PET. J Nucl Med. (1999) 40:1848–56.
23. Surti S, Karp JS, Popescu LM, Daube-Witherspoon ME, Werner M. Investigation of time-of-flight benefit for fully 3-D PET. IEEE Trans Med Imaging. (2006) 25:529–38. doi: 10.1109/TMI.2006.871419
24. Karp JS, Surti S, Daube-Witherspoon ME, Muehllehner G. Benefit of time-of-flight in PET: experimental and clinical results. J Nucl Med. (2008) 49:462–70. doi: 10.2967/jnumed.107.044834
25. Surti S. Update on time-of-flight PET imaging. J Nucl Med. (2015) 56:98–105. doi: 10.2967/jnumed.114.145029
Keywords: PET, myocardial perfusion imaging, quantification, flow phantom, reconstruction, myocardial blood flow
Citation: Siekkinen R, Teuho J, Smith NAS, Fenwick A, Kirjavainen AK, Koskensalo K, Saraste A and Teräs M (2020) Study of the Effect of Reconstruction Parameters for Myocardial Perfusion Imaging in PET With a Novel Flow Phantom. Front. Phys. 8:148. doi: 10.3389/fphy.2020.00148
Received: 24 October 2019; Accepted: 14 April 2020;
Published: 06 May 2020.
Edited by:
Ivo Rausch, Medical University of Vienna, AustriaReviewed by:
David B. Stout, Independent Researcher, Culver City, United StatesCopyright © 2020 Siekkinen, Teuho, Smith, Fenwick, Kirjavainen, Koskensalo, Saraste and Teräs. This is an open-access article distributed under the terms of the Creative Commons Attribution License (CC BY). The use, distribution or reproduction in other forums is permitted, provided the original author(s) and the copyright owner(s) are credited and that the original publication in this journal is cited, in accordance with accepted academic practice. No use, distribution or reproduction is permitted which does not comply with these terms.
*Correspondence: Reetta Siekkinen, cmVldHRhLnNpZWtraW5lbkB0eWtzLmZp
Disclaimer: All claims expressed in this article are solely those of the authors and do not necessarily represent those of their affiliated organizations, or those of the publisher, the editors and the reviewers. Any product that may be evaluated in this article or claim that may be made by its manufacturer is not guaranteed or endorsed by the publisher.
Research integrity at Frontiers
Learn more about the work of our research integrity team to safeguard the quality of each article we publish.