
94% of researchers rate our articles as excellent or good
Learn more about the work of our research integrity team to safeguard the quality of each article we publish.
Find out more
ORIGINAL RESEARCH article
Front. Phys., 28 April 2020
Sec. Chemical Physics and Physical Chemistry
Volume 8 - 2020 | https://doi.org/10.3389/fphy.2020.00130
This article is part of the Research TopicAre There Common Origins in Heterogeneous Dynamics and Structures in Ionic and Non-Ionic Systems?View all 7 articles
Spatiotemporal heterogeneity is one of the hallmarks of the relaxation dynamics associated with the glass transition. A key question in this regard is whether the dynamical heterogeneity has a structural origin. We report differential scanning calorimetry (DSC) data that reveal the presence of extreme spatial heterogeneity in the freezing dynamics of water (D2O) and the glass transition dynamics in the supercooled molecular liquid ortho-terphenyl (OTP), when these liquids are confined in nano-architected mesoporous silica with interconnected pores of different geometry. The results demonstrate, for the first time, that despite connectivity between the pores, nanoconfined water and OTP display distinct freezing/melting points and glass transition temperatures characteristic of each pore type. Viewed as a whole, these experimental results point to the coexistence of strong spatial heterogeneities over length scales of a few nanometers in the structure and dynamics of these liquids, suggesting a close mechanistic connection between them.
The remarkable slowdown of the primary or α relaxation in supercooled liquids appears to necessitate the existence of a growing or even diverging length scale as the temperature approaches the glass transition temperature Tg upon cooling [1]. In fact, most of the experimental and simulation studies have indicated that a growing dynamical length scale is responsible for the sharp rise in the α-relaxation timescale near the glass transition [2–7]. Multi-point space-time correlation functions and related measurements suggest the appearance of long-lived spatially correlated dynamical clusters or regions of fast and slow dynamics that persist on the timescale of structural relaxation and the length scale of these clusters grows upon cooling [8]. These spatially heterogeneous dynamics are now believed to be a hallmark of the glass transition that can be linked to the non-linear, non-Arrhenius, and non-exponential nature of the relaxation process [9, 10].
Although there is a possibility that the origin of the dynamical heterogeneity can be purely kinetic in the trajectory space and unrelated to any corresponding structural fluctuation [11], a number of simulation studies suggest that such heterogeneities may be closely associated with structural fluctuations at length scales corresponding to intermediate range order, i.e., they have a thermodynamic origin [2, 12]. For example, clusters of slow dynamics have been identified in metallic glass-forming liquids with the appearance of interconnected regions of icosahedral ordering, while those in colloidal liquids are characterized by hexagonally close-packed structures with bond orientational order. However, direct experimental observation of such correspondence between structural and dynamical heterogeneity remains challenging. In this regard it is interesting to note that liquids such as water display pronounced structural and dynamical heterogeneity under nanoconfinement and freeze in a stepwise fashion [13–15].
The differences in the dynamical behavior between a liquid in bulk form and under nanoconfinement arises primarily from (i) the thermodynamic effect of curvature of the confined space and the fact that the length scale of confinement becomes comparable to or smaller than some characteristic length scale of the liquid as well as (ii) the structural effects exerted by the pore-liquid interface, such as oscillations in the molecular packing density of the liquid as a function of distance from the interface [16]. Extensive experimental and simulation studies in the recent past have indicated that such heterogeneity in the case of water confined in the pores of silica with pore diameters ranging between 2 and 20 nm can be linked to strong density layering [17]. In particular, water molecules remain strongly structured by the pore walls of silica up to a distance of ~1 nm from the wall and are characterized by significantly lower mobility and higher density, compared to bulk water. On the other hand, the density and mobility of the water molecules in the region beyond ~1 nm from the pore wall is believed to become increasingly similar to that of bulk water toward the center of the pore. Again, a direct demonstration of the connection between the structural and dynamical heterogeneity in a confined liquid remains somewhat scarce in the literature, although recent simulation studies on partially pinned systems under neutral confinement provide interesting insights into such connections [18–21].
Here we present experimental evidence for extreme spatial heterogeneity in the freezing dynamics of water and in the glass transition dynamics in the van der Waals bonded supercooled molecular liquid ortho-terphenyl (C18H14, OTP), when these liquids are nanoconfined in architected mesoporous silica with interconnected pores of different geometry. Such heterogeneity is reminiscent of glassy dynamics and is manifested in the very first observation of two distinct freezing points for water and two glass transition temperatures (Tg) for supercooled OTP, where each transition corresponds to a specific pore geometry.
Mesoporous silica powders with bimodal pores (FDU-5 and SBA-16) and with uniform cylindrical pores (SBA-15) were synthesized according to acidic reaction methods as previously reported [22–24]. To synthesize SBA-16, 3.0 g of triblock copolymer poly(ethylene oxide)106-poly(propylene oxide)70-poly(ethylene oxide)106 (Pluronic® F127, Aldrich) were dissolved in 144 mL of deionized (DI) water and 144 mL of 2 M hydrochloric acid. Subsequently, 11 mL of butyl alcohol and 15 mL of tetraethyl orthosilicate (TEOS, Aldrich) were added. The solution was then kept in an oven at 45°C for 24 h, followed by a hydrothermal treatment at 100°C for 24 h. The resulting white precipitate was then washed with DI water and ethanol, dried in an oven at 70°C and calcined at 500°C for 3 h. SBA-15 was synthesized by dissolving 4.0 g of triblock copolymer poly(ethylene oxide)20-poly(propylene oxide)70-poly(ethylene oxide)20 (Pluronic® P123, Aldrich), in 30 mL of DI water and 120 mL of 2 M hydrochloric acid. Then, 9.1 mL of TEOS was added to the solution, which was kept at 37°C for 20 h. Subsequently, the mixture was placed in an oven at 70°C for hydrothermal treatment for 16 h. The resulting white precipitate was then washed with DI water and ethanol, dried in an oven at 70°C and calcined at 500°C for 3 h. The synthesis of FDU-5 followed a procedure described in [22]. Briefly, 1.0 g of Pluronic® P123 and 0.115 g of sodium dodecyl sulfate were dissolved in a mixture of 26 g DI water and 12 g of 2 M hydrochloric acid at room temperature. 2.08 g of TEOS was added to this solution under vigorous stirring. The solution was kept at 30°C for 24 h, and then transferred into a Teflon autoclave and heated at 100°C for another 24 h. The precipitated solid was washed with DI water, dried in an oven at 70°C and calcined at 550°C for 3 h.
The phase identification and lattice parameter determination of the mesoporous silica samples were carried out using powder x-ray diffraction (Figure 1). The mesopore arrangement and pore size were evaluated, respectively, by transmission electron microscopy (TEM) and nitrogen adsorption-desorption analysis. Details of these experiments can be found in previous publications [19, 20]. For TEM imaging, powders were dispersed in ethanol. A small amount of this dispersion was placed on a TEM grid by drop-casting and dried in air. TEM images of mesoporous materials were taken by a FEI Tecnai 12 transmission electron microscope (Figure 2). Nitrogen adsorption/desorption isotherms were obtained using a Sorptometer (ASAP 2020, Micromeritics) at 77 K. The mesoporous materials were degassed at 523 K for 6 h (3 mTorr) prior to adsorption. The specific surface areas of the samples were calculated by the Brunauer-Emmett-Teller (BET) method, and pore size distributions were calculated by the Barrett-Joyner-Halenda (BHJ) and density functional theory (DFT) methods.
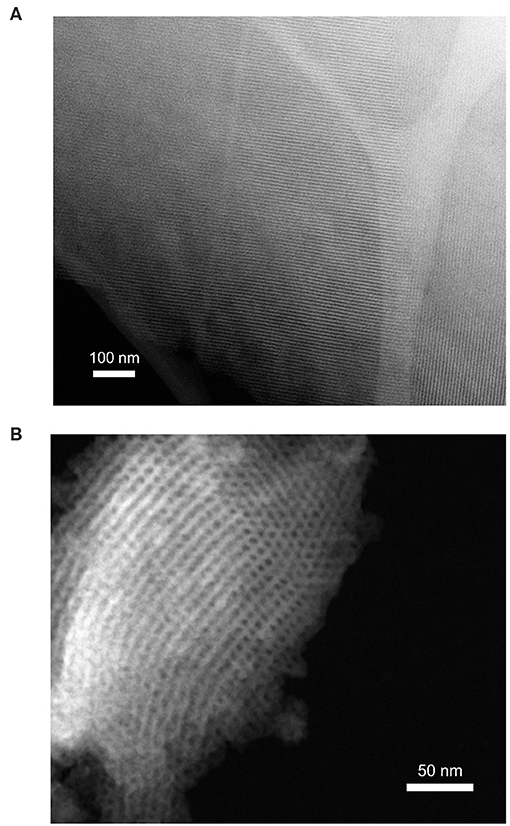
Figure 2. Scanning TEM images of (A) SBA-16 and (B) FDU-5 showing nano-sized ordered mesoporous structures.
Mesostructure geometries and pore sizes for SBA-15, SBA-16, and FDU-5 were determined by a combination of TEM imaging, nitrogen adsorption/desorption analysis using BJH and DFT methods, and X-ray diffraction. Results from these three characterization methods were then compared to published results [23–27]. In detail, the cage-structured SBA-16 is characterized by large spherical pores (5.5 nm diameter) that are body-centered-cubic arranged (Figure 3) and connected by narrow cylindrical openings (3.2 nm diameter and 1.5–2 nm in length). 3D large-pore FDU-5 possesses an Ia3d-type bicontinuous cubic mesostructural order with cylindrical pores of 8.7 nm in diameter. As shown in Figure 3, at the crossing locations of the cylindrical pores, larger “pore-openings” occur. From Ia3d unit-cell analysis and pore size analysis, we estimate the length of the diagonal at the crossing of two identical cylinders to be 12.4 nm. Finally, the two mesostructured SBA-15 samples are characterized by cylindrical pores with diameters of 4 and 5 nm, arranged in a honeycomb-type hexagonal lattice (Figure 3).
The Vycor-5, Vycor-109 and Vycor-145 porous silica glasses with average pore sizes of 5, 10.9, and 14.5 nm, respectively, were obtained from Corning Inc. in the form of buttons of dimensions 6.9 mm diameter and 2.5 mm height. “Thirsty” Vycor glass was prepared by baking all samples at 200°C overnight to remove any adsorbed organic impurities.
D2O was added to excess amount of as-prepared mesoporous silica powder and the mixture was stirred to obtain partially hydrated samples for DSC and NMR experiments. The thirsty Vycor glass buttons were immersed in pure D2O (Aldrich) for 10 min to obtain fully hydrated samples. These samples were subsequently dried at ambient condition for 1 h to remove any freezable bulk water on the sample surface through water evaporation, crushed into powder and used in DSC and NMR experiments.
Reagent grade OTP (Aldrich) was melted at 130°C without further purification. Mesoporous silica powder and Vycor buttons were submerged in the OTP melt and equilibrated for 24 h in a furnace. Precipitated powder and buttons were transferred into hermetically sealed aluminum pans and subsequently quenched in liquid nitrogen for DSC measurements.
The DSC measurements were carried out using a Mettler Toledo DSC1 differential scanning calorimeter. About 10–25 mg samples were hermetically sealed in 40 μL aluminum pans. Scans were taken in a flowing nitrogen environment with a heating rate of 5 K/min. Melting point and Tg were determined to within ± 2°C as the onset of the corresponding endotherms. Measurements were repeated on multiple samples to ensure reproducibility. The temperature scale was calibrated to the onset of the melting endotherm of pure bulk D2O at 277.0 K.
DSC heating curves for D2O in mesoporous silica SBA-15, SBA-16, and FDU-5 are shown in Figure 4. While SBA-15 displays only one endothermic melting peak of water in the nanopores, two endothermic peaks are observed for SBA-16 and FDU-5 corresponding to the melting of water confined in the two pore types in these bimodal pore structures. The depression of the melting temperature Tm of confined D2O in these systems, corresponding to the onset of the DSC endothermic peak, with respect to the bulk value TmB approximately obeys the Gibbs-Thompson (G-T) relation as ΔTm = (TmB − Tm) varies nearly linearly with the inverse of the effective pore size R (Figure 5). This result is consistent with those reported in previous studies of similar behavior of water under nanoconfinement in monodispersed pores and suggests that the volume to interface ratio dominates the freezing point depression behavior of water in mesoporous silica [28, 29]. However, and more interestingly, the observation in the present study of two different freezing points for the two pore sizes in SBA-16 and FDU-5 with interconnected pores implies that under nanoconfinement the dynamical characteristics of water molecules in each pore type can be preserved in spite of the fact that these pores are completely interconnected. Therefore, the nanoconfined water is dynamically heterogeneous, even over distances on the order of a few nanometer (see below). Moreover, the difference in the volume to interface ratio between the two pore types would also imply corresponding differences in the length scale of structuring of the water molecules. Thus, these results, when taken together, suggest a close connection between the structural and dynamical heterogeneities in nanoconfined liquids.
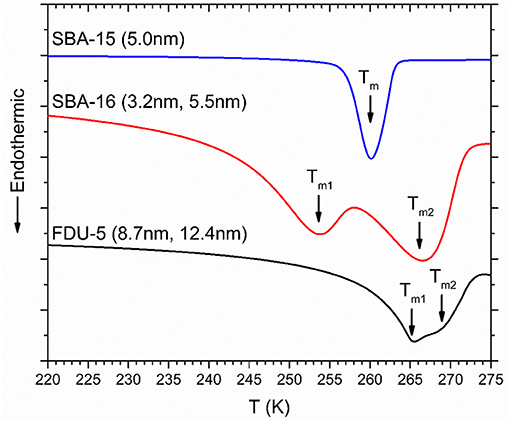
Figure 4. DSC melting scans for D2O confined in SBA-15, SBA-16, and FDU-5. Corresponding pore diameters are given alongside the scans. ΔTm corresponding to melting in nanopores are indicated by solid arrows.
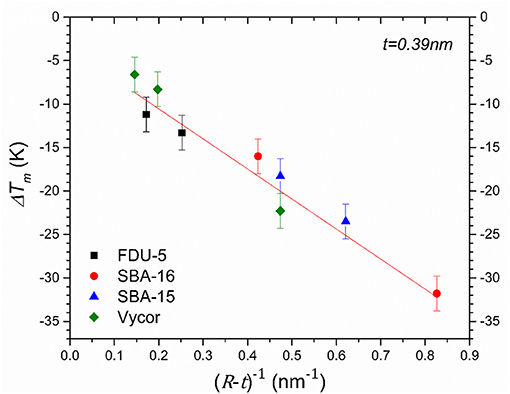
Figure 5. Depression of melting point as a function of inverse of effective pore radius. Red straight line through the data points is a linear least-squares fit of the simplified Gibbs-Thomson equation ΔTm = K/(R − t) where t is the thickness (0.39 nm) of the statistical monolayer of water molecules attached to the pore wall. Data for Vycor-5, Vycor-109, and Vycor-145 samples are taken from a previous study [15].
DSC heating curves for glassy OTP confined in dual pore SBA-16 and FDU-5 samples are shown in Figure 6A. In each case, two Tg peaks are observed, both of which are below the bulk OTP glass transition temperature of ~299 K, corresponding to the glass transition in the two pore types. On the other hand, the SBA-15 and Vycor samples with nearly unimodal pore sizes display only one Tg (Figure 6B). Interestingly, and in contrast with the melting/freezing transition of water, the glass transition of OTP does not display an approximately universal dependence of ΔTg = (TgB − Tg) on the pore size R (Figure 7), in spite of the chemical similarity of the host structures. Instead, two separate linear trends are observed for the crystalline mesoporous silica and amorphous vycor samples in accordance with the G-T relationship. This result may be suggestive of the differences in the strength of the pore-liquid interfacial interaction and the interface roughness between the crystalline and the amorphous structures [16].
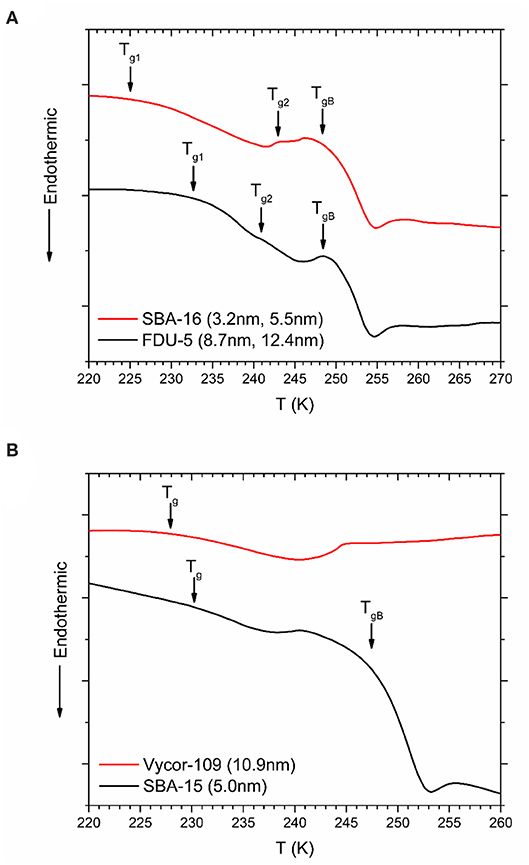
Figure 6. DSC heating scans for OTP confined in (A) SBA-16 and FDU-5, (B) SBA-15, and Vycor-109. Scans for other vycor samples are not shown. Tg corresponding to glass transition in nanopores and signals from bulk OTP (TgB) are indicated by solid arrows.
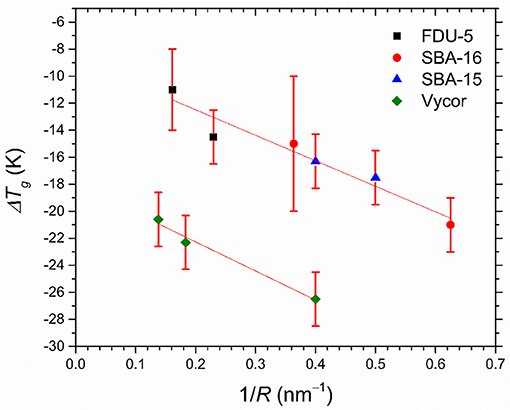
Figure 7. Depression of Tg of OTP nanoconfined in FDU-5 (black square), SBA-16 (red circle), SBA-15 (blue triangles), and Vycor samples (green diamonds) determined from the DSC scans, as a function of the inverse of pore radius R. Straight lines through the data are guide to the eye.
It is well-known that similar to the thermodynamic freezing/melting transition, the kinetic process of glass transition of supercooled liquids could also be strongly affected by confinement of the liquid to nanometer length scales. However, the corresponding response is known to be non-universal in the sense that Tg can either increase or decrease with the dimensionality and extent of confinement [16]. Nanoconfinement can affect the dynamics of a supercooled liquid in two ways. First, if the length scale of confinement becomes comparable to or smaller than that of the cooperatively rearranging regions (CRR) responsible for structural or α-relaxation, then the effect of cooperative molecular dynamics and the temperature dependence of configurational entropy are greatly diminished, which would result in an enhancement in the liquid dynamics, resulting in a lowering of Tg [30]. The volume of the CRRs near glass transition is expected to have the dimension of 100–200 molecules [31], which corresponds to a characteristic length scale of the CRRs on the order of ~6 molecular diameters, which for OTP is ~4.5 nm. Therefore, the pore sizes of the mesoporous silica samples studied here may indeed satisfy this condition, which is consistent with the observed depression in Tg. Second, the relative effects of the pore-liquid interface on the structuring of the liquid become stronger as the length scale of confinement decreases and the interface:bulk ratio increases, although the sign of change in Tg from the interface effect cannot be predicted a priori and can be positive or negative. However, both configurational entropy and interface effects are expected to influence the structure of the confined liquid. Therefore, similar to the two Tm for the freezing transition of water, the observation of two Tg for OTP confined in the interconnected two-pore structures suggests coexistence of structural and dynamical heterogeneities and their preservation over length scales that are on the order of the pore dimensions. The self-diffusion coefficient for OTP molecules near Tg is ~10−16 cm2/s [32] and the relaxation timescale is on the order of ~100 s, which yields a characteristic molecular diffusion distance of ~1 nm during relaxation. Therefore, the diffusion distances during structural relaxation are of the same order of magnitude as the pore dimensions in SBA-16 and FDU-5, and yet the structural and dynamical heterogeneities can be preserved over the same length scales and timescales. This observation indicates that the preservation of the dynamical heterogeneity is only possible because the liquid structure in each pore type is unique and cannot be homogenized, thus suggesting a close connection between the structure and dynamics in liquids under nanoconfinement.
In summary, we report a systematic study of the melting and freezing dynamics of D2O and the glass transition dynamics of supercooled OTP confined in the nanopores of glassy and crystalline solid silica matrices using DSC. The observation of two distinct melting points for water and two glass transition temperatures for OTP nanoconfined in the interconnected pores of two different diameters in mesoporous silica SBA-16 and FDU-5 indicates the coexistence of structural and dynamical heterogeneity in these liquids at length scales on the order of a few nanometer. Collectively, these results suggest a close mechanistic connection between structure and dynamics in both liquids.
All datasets generated for this study are included in the article/supplementary material.
SS, YX, and SR initiated the concept. YX and SS designed and performed the DSC experiments and performed the data analyses and interpretation. HC and MB synthesized and characterized the mesoporous silica samples. SS, YX, MB, and SR wrote the manuscript. All authors revised the manuscript and provided helpful comments.
This work was supported as part of the EFRC-MUSE, an Energy Frontier Research Center funded by the U.S. Department of Energy, Office of Science, Basic Energy Sciences under Award #DE-SC0019285.
The authors declare that the research was conducted in the absence of any commercial or financial relationships that could be construed as a potential conflict of interest.
1. Cavagna A. Supercooled liquids for pedestrians. Phys Rep. (2009) 476:51–124. doi: 10.1016/j.physrep.2009.03.003
2. Razul MSG, Matharoo GS, Poole PH. Spatial correlation of the dynamic propensity of a glass-forming liquid. J Phys Condens Matter. (2011) 23:235103. doi: 10.1088/0953-8984/23/23/235103
3. Schmidt-Rohr K, Spiess HW. Nature of nonexponential loss of correlation above the glass transition investigated by multidimensional NMR. Phys Rev Lett. (1991) 66:3020–3. doi: 10.1103/PhysRevLett.66.3020
4. Chandler D, Garrahan JP. Dynamics on the way to forming glass: bubbles in space-time. Annu Rev Phys Chem. (2010) 61:191–217. doi: 10.1146/annurev.physchem.040808.090405
5. Berthier L, Biroli G, Bouchaud JP, Cipelletti L, van Saarloos W. Dynamical Heterogeneities in Glasses, Colloids, and Granular Media. Oxford: Oxford University Press (2011). doi: 10.1093/acprof:oso/9780199691470.001.0001
6. Karmakar S, Dasgupta C, Sastry S. Growing length and time scales in glass-forming liquids. Proc Natl Acad Sci USA. (2009) 106:3675–9. doi: 10.1073/pnas.0811082106
7. Kim K, Saito S. Multiple length and time scales of dynamic heterogeneities in model glass-forming liquids: a systematic analysis of multi-point and multi-time correlations. J Chem Phys. (2013) 138:12A506. doi: 10.1063/1.4769256
8. Berthier L, Biroli G. Theoretical Perspective on the glass transition and amorphous materials. Rev Mod Phys. (2011) 83:587–645. doi: 10.1103/RevModPhys.83.587
9. Dyre JC. Colloquium: the glass transition and elastic models of glass-forming liquids. Rev Mod Phys. (2006) 78:953–72. doi: 10.1103/RevModPhys.78.953
10. Ediger MD. Spatially heterogeneous dynamics in supercooled liquids. Annu Rev Phys Chem. (2000) 51:99–128. doi: 10.1146/annurev.physchem.51.1.99
11. Hedges LO, Jack RL, Garrahan JP, Chandler D. Dynamic order-disorder in atomistic models of structural glass formers. Science. (2009) 323:1309–13. doi: 10.1126/science.1166665
12. Kawasaki T, Tanaka H. Structural origin of dynamic heterogeneity in three-dimensional colloidal glass formers and its link to crystal nucleation. J Phys Condens Matter. (2010) 22:232102. doi: 10.1088/0953-8984/22/23/232102
13. Lusceac SA, Vogel MR, Herbers CR. 2H and 13C NMR studies on the temperature-dependent water and protein dynamics in hydrated elastin, myoglobin and collagen. Biochim Biophys Acta. (2010) 1804:41–8. doi: 10.1016/j.bbapap.2009.06.009
14. Sattig M, Vogel M. Dynamic crossovers and stepwise solidification of confined water: a 2H NMR study. J Phys Chem Lett. (2014) 5:174–8. doi: 10.1021/jz402539r
15. Xia Y, Cho H, Deo M, Risbud SH, Bartl MH, Sen S. Layer-by-layer freezing of nanoconfined water. Sci Rep. (2020) 10:5327. doi: 10.1038/s41598-020-62137-1
16. Napolitano S, Glynos E, Tito NB. Glass transition of polymers in bulk, confined geometries, and near interfaces. Rep Prog Phys. (2017) 80:036602. doi: 10.1088/1361-6633/aa5284
17. Bourg IC, Steefel CI. Molecular dynamics simulations of water structure and diffusion in silica nanopores. J Phys Chem C. (2012) 116:11556–64. doi: 10.1021/jp301299a
18. Kob W, Roldán-Vargas S, Berthier L. Non-monotonic temperature evolution of dynamic correlations in glass-forming liquids. Nat Phys. (2012) 8:164–7. doi: 10.1038/nphys2133
19. Klameth F, Henritzi P, Vogel M. Static and dynamic length scales in supercooled liquids: insights from molecular dynamics simulations of water and tri- propylene oxide. J Chem Phys. (2014) 140:144501. doi: 10.1063/1.4870089
20. Hocky GM, Markland TE, Reichman DR. Growing point-to-set length scale correlates with growing relaxation times in model supercooled liquids. Phys Rev Lett. (2012) 108:225506. doi: 10.1103/PhysRevLett.108.225506
21. Horstmann R, Sanjon EP, Drossel B, Vogel M. Effects of confinement on supercooled tetrahedral liquids. J Chem Phys. (2019) 150:214704. doi: 10.1063/1.5095198
22. Zhao D, Qiu S, Tang Y, Yu C. Recent progress in mesostructured materials. In: Proceedings of the 5th International Mesostructured Materials Symposium (IMMS 2006), Vol. 165. Shanghai (2007).
23. Zhao D, Huo Q, Feng J, Chmelka BF, Stucky GD. Nonionic triblock and star diblock copolymer and oligomeric surfactant syntheses of highly ordered, hydrothermally stable, mesoporous silica structures. J Am Chem Soc. (1998) 120:6024–36. doi: 10.1021/ja974025i
24. Maheshwari H, Roehling JD, Turner BA, Abdinor J, Tran-Roehling TB, Deo MD, et al. Robust mesoporous silica compacts: multi-scale characterization of microstructural changes related to physical–mechanical properties. J Mater Sci. (2016) 51:1–11. doi: 10.1007/s10853-016-9759-0
25. Ishii Y, Nishiwaki Y, Al-Zubaidi A, Kawasaki S. Pore size determination in ordered mesoporous materials using powder X-ray diffraction. J Phys Chem C. (2013) 117:18120–30. doi: 10.1021/jp4057362
26. Carniato F, Paul G, Bisio C, Caldarelli S, Marchese L. On the organic/inorganic interface between mesoporous SBA-16 silica and its structural directing polymer: a combined FT-IR and solid state NMR study. RSC Adv. (2012) 2:1153–60. doi: 10.1039/C1RA00460C
27. Liu X, Tian B, Yu C, Gao F, Xie S, Tu B, et al. Room-Temperature synthesis in acidic media of large-pore three-dimensional bicontinuous mesoporous silica with Ia3d symmetry. Angew Chem Int Ed Engl. (2002) 41:3876–8. doi: 10.1002/1521-3773(20021018)41:20<3876::AID-ANIE3876>3.0.CO;2-R
28. Kittaka S, Takahara S, Matsumoto H, Wada Y, Satoh TJ, Yamaguchi T. Low temperature phase properties of water confined in mesoporous silica MCM-41: thermodynamic and neutron scattering study. J Chem Phys. (2013) 138:204714. doi: 10.1063/1.4807593
29. Morishige K, Yasunaga H, Matsutani Y. Effect of pore shape on freezing and melting temperatures of water. J Phys Chem C. (2010) 114:4028–35. doi: 10.1021/jp910759n
30. Alcoutlabi M, McKenna GB. Effects of confinement on material behaviour at the nanometre size scale. J Phys Condens Matter. (2005) 17:R461–524. doi: 10.1088/0953-8984/17/15/R01
31. Stevenson JD, Schmalian J, Wolynes PG. The shapes of cooperatively rearranging regions in glass-forming liquids. Nat Phys. (2006) 2:268–74. doi: 10.1038/nphys261
Keywords: freezing transition, nanoconfinement, structural and dynamical heterogeneity, glass transition (glasses), mesoporous silica
Citation: Xia Y, Cho H, Risbud SH, Bartl MH and Sen S (2020) Coexistence of Structural and Dynamical Heterogeneity in Liquids Under Nanoconfinement. Front. Phys. 8:130. doi: 10.3389/fphy.2020.00130
Received: 23 February 2020; Accepted: 03 April 2020;
Published: 28 April 2020.
Edited by:
Carlos Leon, Complutense University of Madrid, SpainReviewed by:
Michael Vogel, Darmstadt University of Technology, GermanyCopyright © 2020 Xia, Cho, Risbud, Bartl and Sen. This is an open-access article distributed under the terms of the Creative Commons Attribution License (CC BY). The use, distribution or reproduction in other forums is permitted, provided the original author(s) and the copyright owner(s) are credited and that the original publication in this journal is cited, in accordance with accepted academic practice. No use, distribution or reproduction is permitted which does not comply with these terms.
*Correspondence: Sabyasachi Sen, c2JzZW5AdWNkYXZpcy5lZHU=
Disclaimer: All claims expressed in this article are solely those of the authors and do not necessarily represent those of their affiliated organizations, or those of the publisher, the editors and the reviewers. Any product that may be evaluated in this article or claim that may be made by its manufacturer is not guaranteed or endorsed by the publisher.
Research integrity at Frontiers

Learn more about the work of our research integrity team to safeguard the quality of each article we publish.