 Fuhong Cai
 Min Gao1
 Jingwei Li
 Wen Lu
95% of researchers rate our articles as excellent or good
Learn more about the work of our research integrity team to safeguard the quality of each article we publish.
Find out more
ORIGINAL RESEARCH article
Front. Phys. , 28 April 2020
Sec. Medical Physics and Imaging
Volume 8 - 2020 | https://doi.org/10.3389/fphy.2020.00110
This article is part of the Research Topic Optics and Ultrasound in Biomedicine: Sensing, Imaging and Therapy View all 16 articles
The combining of reflected endoscopic imaging with spectral data has recently attracted much attention. In this study, we used an optical fiber bundle probe, a galvo-scanning module and an imaging spectrometer module to realize a dual-channel endoscope that is capable of simultaneously acquiring real-time video data and high-throughput hyperspectral data. The frame per second of the video channel is 30, and the wavelength range in the hyperspectral channel is 400–750 nm, with a 3 nm spectral resolution at 547 nm. To achieve fast hyperspectral imaging, we extracted the region of interest (ROI) from the video channel and utilized it as guidance to drive the galvo-scanning module to obtain the hyperspectral data in the ROI. In this way, the hyperspectral imaging speed for a selected ROI area can be reduced to about 1 second, making it possible to achieve rapid detection. Utilizing this system, we acquired the hyperspectral image of fingerprints, dorsum of the hand, and skin melanin nevus, demonstrating that compact dual-channel endoscopy has broad implications for research and therapeutics.
The importance of histopathological evaluation for disease remains critical. However, the acquisition and recognition of traditional pathological data are time-consuming and must be obtained by a well-trained observer. In order to achieve rapid intraoperative diagnosis, examination of frozen pathological sections from patients during operation has been developed and widely used in the clinical field. However, some dysplasia is invisible, inevitably leading to misdiagnosis. To circumvent this problem, some in vivo diagnostic techniques based on endoscopic tools have been developed [1–3]. For example, Qiu et al. [3] utilized light scattering endoscopic imaging for esophageal precancer diagnosis. Their work demonstrated that spectral technology is compatible with endoscopic diagnosis. In order to obtain high-throughput spectral information, hyperspectral endoscopy has been developed [4–6]. In hyperspectral imaging, the spectrum of each pixel in the image can be obtained, and then the chemical components of various kinds of tissue can be analyzed through spectral information [7, 8], which helps to improve the accuracy of diagnosis [9–14]. Nevertheless, motion artifacts during medical endoscopy may affect clinical diagnosis. From the perspective of imaging, increasing the imaging speed contributes to reducing motion artifacts. Hence, imaging speed is important for accuracy in clinical applications [15]. In general, a straightforward way to improve the imaging speed is to reduce the integral time of the sensor. However, the signal-to-noise ratio (SNR) is usually poor, with short integral time. At present, it is critical to resolve the issue of reducing spectral resolution to improve the SNR of spectral data in order to develop a fast-spectral detection system with less exposure time. Another way to improve imaging speed is to reduce the spectral resolution of the system. However, in the visible and near-infrared band, the absorption spectra of different biomolecules usually overlap. This reduces the reconstruction accuracy of biomolecules' content. Higher spectral resolution data can help to distinguish different biomolecules and contribute to a more accurate medical/chemical analysis [16]. Thus, a hyperspectral endoscopy system with high imaging speed and rich spectral information is required to perform accurate clinical diagnoses.
In our previous work [17], we developed a fiber bundle probe-based hyperspectral endoscope that utilized a galvo mirror to achieve spatial scanning. This hyperspectral endoscope is relatively cost-efficient and portable, making it suitable for field use. However, the previous endoscopic prototype required several tens seconds to obtain one three-dimensional (3D, 2D spatial, and 1D spectral) spectral image cube, which certainly limits its clinical application during operation. Additionally, the spectral image cube obtained suffered because of severe motion artifacts. In this study, we developed a compact dual-channel endoscope to accomplish rapid hyperspectral imaging in order to obtain a hyperspectral image of a region of interest (ROI) in about 1 s. This rapid imaging undoubtedly expanded its use in the histopathological evaluation. The system combines a traditional endoscopic imaging system and galvo-scanning imaging spectrometer to generate two channels of imaging data, i.e., high-speed two-dimensional (2D) spatial video data and a 3D hyperspectral cube. These two channels both detect the same target through endoscope imaging. Utilizing the high-speed spatial image and an image processing algorithm, ROIs can be rapidly located. By controlling the scanning angle of the galvo mirror, we can acquire fast-spectral imaging on the ROI. In the present study, the system was used to detect fingerprints, dorsum of hand, and skin melanin nevus, demonstrating its broad implications for research and therapeutics.
In this work, a dual-channel endoscope was assembled to simultaneously acquire video and hyperspectral imaging data. Figures 1a,b shows the optical schematic diagram and photo of the dual-channel endoscope, respectively. A fiber bundle probe was used to transmit an image of the sample. When detecting the spectra of samples, an imaging lens was used to focus the image of the sample onto the far end face of the fiber bundle, while the proximal end face of the fiber bundle was in the focal plane of the objective. In this way, the real image of the sample was relayed to the detection module. After passing through the objective (RMS10X, THORLABS), the sample's real image was divided into two paths by a beam splitter (BSX10, THORLABS). After lens focusing (AC254-050-A, THORLABS), one path was captured by a custom video camera, thus obtaining the spatial image of the sample. The other path was first reflected by the galvo mirror (GVS001, THORLABS) and then focused into the homemade imaging spectrometer by another doublet lens (AC254-050-A, THORLABS). The homemade imaging spectrometer consisted of a custom slit with a 30 μm width, a collimating lens (AC254-050-A, THORLABS), a custom prism-grating-prism module, a focusing lens (AC254-050-A, THORLABS), and a CMOS camera. By changing the angle of the galvo mirror with the help of a data acquisition/generation card (USB6008, NI), the real image was scanned across the slit. For each angle, a spectral image was captured by the camera of the imaging spectrometer. A hyperspectral image cube of the sample was formed by combining a sequence of spectral images [18]. By outputting voltage with different values from USB6008, we controlled the angle of the galvo mirror. Both the video camera and spectral camera were connected to a computer using USB 3.0 cables. Through the USB cables, camera control and data transfer were accomplished. Notably, this compact dual-channel endoscope—including the driver circuit, data acquisition card, wire box, and a power outlet—can be contained in a suitcase whose size is 68 cm × 32 cm × 17 cm.
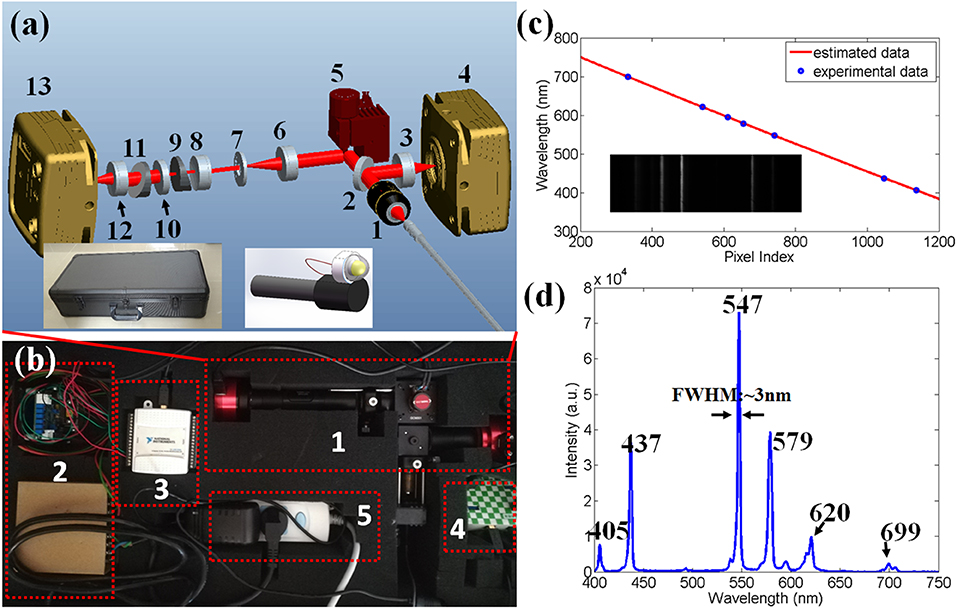
Figure 1. (a) Schematic drawing of the compact dual-channel endoscopy. 1, microscopic object; 2, beam splitter; 3, lens; 4, video camera; 5, galvo mirror; 6, imaging lens; 7, slit; 8, collimating lens; 9, prism; 10, grating; 11, prism; 12 doublet lens; 13, CMOS camera. One inset is the enclosing capsule, which is used to contain the compact dual-channel endoscopy. Another inset shows the far end face of the fiber bundle. (b) Photo of the compact dual-channel endoscopy. 1, compact dual-channel endoscopy; 2, driver circuit of the galvo mirror; 3, data acquisition/generation card; 4, wire box; 5, power outlet. (c) Relationship between the pixel index of CMOS camera and the calibrated wavelength. Inset is the spectral image of the calibration source. (d) Spectrum of the calibration source measured by our system.
We then performed the spectral calibration by utilizing a custom-made mercury lamp. Inset of Figure 1c was a spectral image captured by the camera of imaging spectrometer. The horizontal axis indicated spectral axis, while the vertical axis represented spatial axis, which was also perpendicular to the scanning direction. According to reporting by Das et al. [8], the wavelength of the spectrometer was assumed to be a polynomial function of the pixel index of the spectral axis. Thus, a least squares polynomial fit method was employed to investigate the relationship between wavelength and pixel index. Here, the wavelength of the calibration source at 406, 437, 547, 579, 620, 699 nm [19], and their corresponding pixel indexes at 1,136, 1,047, 741, 654, 611, 541, 333 were utilized in the fitting process. The solid line of Figure 1c shows the relationship between the wavelength and pixel index derived from the fitting result. Figure 1d is the spectrum of the calibration source obtained by our homemade spectrometer, with approximate 3 nm spectrometer at 547 nm. The wavelength range of this homemade imaging spectrometer was 400–750 nm.
We first presented the imaging results of a test fiber bundle to check the consistency of the spatial image and hyperspectral image. A collimated LED lamp was adopted to illuminate the far end face of the fiber bundle probe. The spectrum of the LED lamp was shown in Figure 2a. The radiance of the LED lamp was about 500 lumens. The LED was driven by an electrical signal, so that the LED was turned on during the hyperspectral scanning process. With this working mode, we were able to avoid the heating problem of LED caused by long-time illumination. In the test experiment, a uniform white board was selected as an imaging sample, whose spatial image and hyperspectral cube were acquired synchronously. Figure 2b shows the image obtained by the video channel. Herein, there were several flaw pixels in the fiber bundle, since some region of the fiber bundle could not deliver the LED light. A hyperspectral cube was synchronously acquired from the spectral channel. The spatial image extracted from the hyperspectral cube is shown in Figure 2c. Observing the flaw pixels region, we found the spectral channel had good spatial consistency with the imaging result of the video channel.
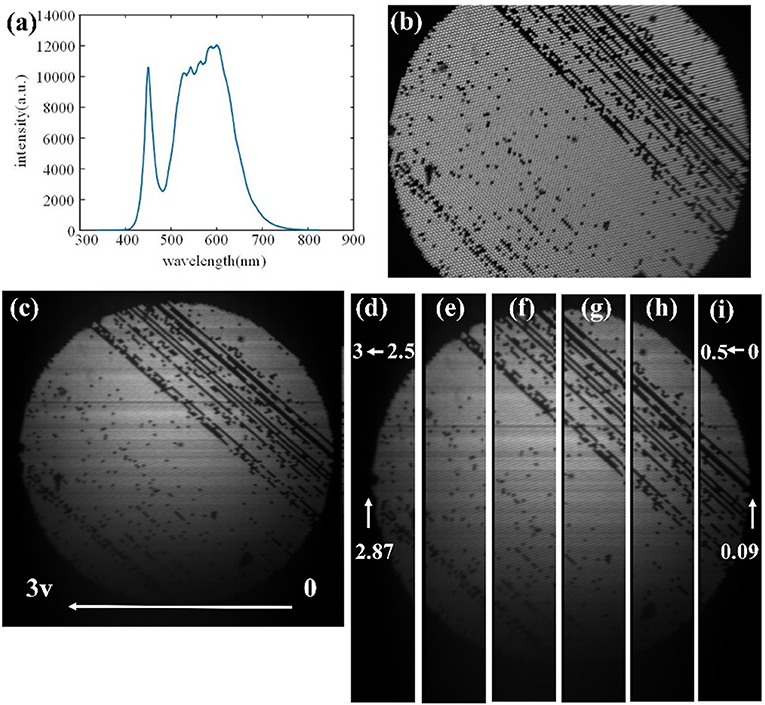
Figure 2. (a) The spectrum of the LED source. (b) Spatial image of the fiber bundle end face derived from video channel. (c) Spatial image of the fiber bundle end face, extracted from the spectral cube from spectral channel with 0–3 v driving voltage. (d–i) The corresponding relationship between driving voltage of galvanometer and pixel position of hyperspectral image, indicating regional scan is consistent with global scan.
Second, we attempted to demonstrate that the scanning result of the spectral channel was linearly related with the control voltage from USB6008. For this purpose, we performed a spectral scanning experiment with six voltage ranges (i.e., 2.5–3.0 v, 2.0–2.5 v, 1.5–2.0 v, 1–1.5 v, 0.5–1 v, 0–0.5 v). Six spectral cubes were acquired after six scanning experiments, and the corresponding six spatial images are shown in Figures 2d–i. The combination of these six pictures is consistent with that of Figure 2c, indicating that the regional scan is consistent with global scan. This result shows that we can scan the region of interest through appropriate voltage output. By analyzing the spectral image of the end face of the fiber bundle probe in Figures 2d–i, the corresponding driving voltages to the left and right edge were 2.87 and 0.09 v, respectively. Meanwhile, the width of the spatial image of Figure 2b was 1,280 pixels, and the width of proximal end face of the fiber bundle was 1,264 pixels. Therefore, we can get the relationship between the driving voltage and the horizontal pixel index of the image by the following formula: driving voltage = −0.0022 × pixel position + 2.87.
Next, we utilized this system to image the hand of the first author. The LED lamp described above was used as an illumination source. Figures 3a,b shows spatial images derived from the video and spectral channel, respectively, when the fiber probe was aimed at human fingerprints. Figure 3c presents the average spectrum of fingerprints inside the red circle in Figure 3b. Two absorption bands, caused by the absorption of hemoglobin, can be seen near 543 and 580 nm [indicated by two arrows in the Figure 3c]. Figure 3d presents images of the finger at three spectral channels (543, 580, and 606 nm). Among the three images, the image brightness at 580 nm channel is the weakest due to the absorption of hemoglobin. Similarly, Figures 3e,f shows spatial images of the dorsum of the human hand derived from the video and spectral channel, respectively. Figure 3g presents the average spectrum of the blue circle in Figure 3f. Compared with the spectrum of the fingerprint, only the absorption band at 580 nm can be seen [indicated by the arrow in the Figure 3g], indicating that the hemoglobin content in the dorsum of the hand is less than that in the fingerprint. Figure 3h presents images of dorsum of the hand at three spectral channels (543, 580, and 606 nm).
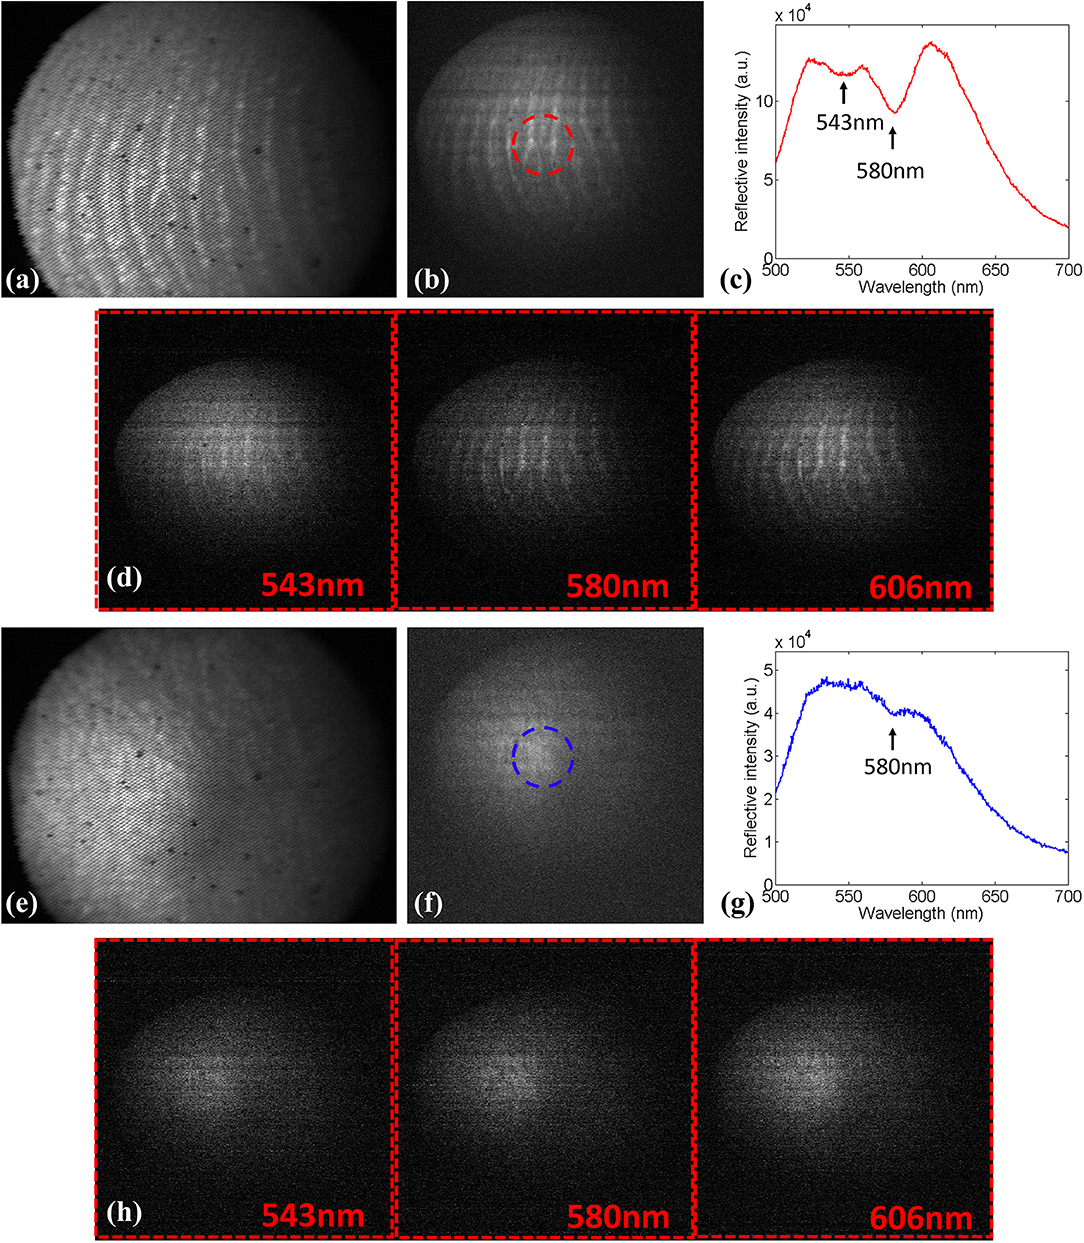
Figure 3. (a) Spatial image of finger derived from video channel. (b) The corresponding spatial image extracted from the spectral cube from the spectral channel. (c) The average spectrum of the finger inside the red circle. (d) Images of finger at three spectral channels (543, 580, and 606 nm). (e) The spatial image of dorsum of the hand. (f) The corresponding spatial image extracted from the spectral cube from the spectral channel. (g) The average spectrum of dorsum of hand inside the blue circle. (h) Images of dorsum of the hand at three spectral channels (543, 580, and 606 nm).
It is worth nothing that for each spectral image, the exposure time of the camera was 20 ms and that 300 spectral images were collected during the experiment. Hence, the overall scanning time was about 6 s. During the scanning process, the spectral images were stored in the computer memory, rather than in a hard disk, to reduce the data storage time. While the computer was collecting spectral images, a new thread was created in the program to deal with the spectral data in the memory of the computer. All the programs were written in C# code.
However, even though the carrying out of the scan and the processing of spectral images occurred simultaneously by creating dual threads in the program, the total processing time, 6 s, is impractical for in vivo application since it is quite slow. By analyzing hyperspectral images, we found that we often paid more attention to a key area rather than the whole area when processing hyperspectral data. In order to further improve the scanning speed, we determined the ROI by spatial image first. Then, we scanned the region of interest by setting the initial voltage and the end voltage of galvanometer scanning because there was a linear relationship between the driving voltage and the horizontal pixel index of the intensity image. Figure 4a shows the spatial image of a melanin nevus on the skin's surface of the first author. It took 6 s to obtain the reflection hyperspectral image of this area according to the system described earlier in this article. A melanin nevus in the middle of the image is visible. If the reflectance spectrum of this region is only necessary, the spectral data of skin tissue outside the nevus prove redundant. By processing the spatial image, we extracted the ROI and used it to generate the appropriate driving voltage of the galvo mirror to scan the region. In this way, the scanning time was reduced to a great extent. In order to extract the location of melanin, we used the expansion function in MATLAB to process Figure 4a and obtained Figure 4b. Figure 4b was an intensity image. In order to identify the melanin nevus, we used the binary algorithm to process the image. In the binary algorithm, pixels with intensity greater than a threshold value were set to digital 1, and the pixels below the threshold were set to the digital 0. In our work, the binarization function in MATLAB was used to binarize the image, and the binary image is thusly shown in Figure 4c. In the binary image, the white region represented the common skin tissue, and the black region inside the white region represented the melanin nevus area. In this study, it took about 0.5 s to complete this image processing. In Figure 4c, we obtained the pixel index range of the black region in the middle, which presented a range of 680 to 810. The original width of the image was 1,280, and the extracted width was ~10% of the original width. According to the relationship driving voltage = −0.0022 × pixel position + 2.87, the corresponding voltage range of the black area is 1.0880 to 1.3740. By setting the driving voltage range of the galvo mirror, it enabled a rapid scan of the melanin nevus. The hyperspectral image of the melanin nevus is shown in Figure 4d. With the same exposure time, the scanning time reduced to ~0.6 s, indicating much less scanning time by focusing on the ROI. The entire scanning process was about 1.1 s when the image processing time is also considered. If multithreading is used to perform the image processing in the future, this time can be further shortened. Figure 4e shows the spectrum of melanin nevus. Compared with the reflective spectrum of common skin, whose hemoglobin's characteristic absorption peak was at 580 nm, the absorption drop at 580 nm was absent in the reflective spectrum of melanin nevus. We can distinguish the melanin region from common skin region based on this characteristic. Meanwhile, the SNR of the melanin nevus was lower than those in Figure 3 due to the strong absorption in the visible light band of melanin.
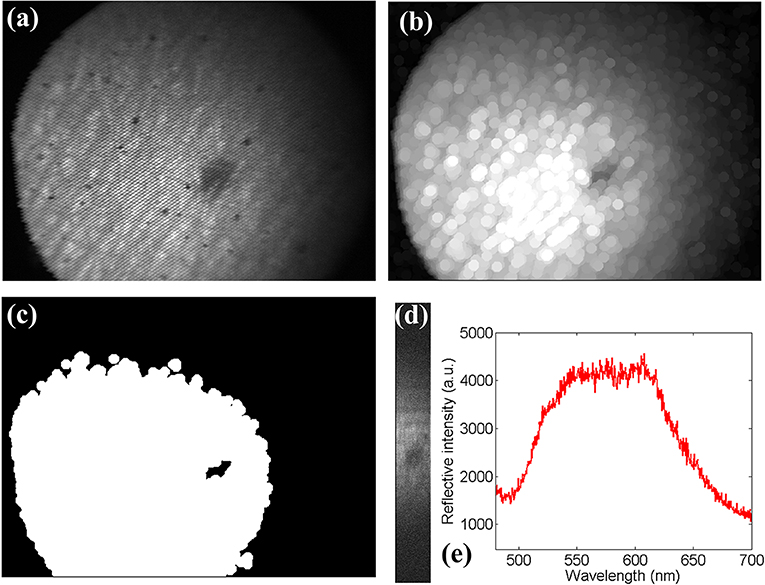
Figure 4. (a) The spatial image of skin. (b) The corresponding spatial image extracted from the spectral cube from spectral channel. (c) The intensity image after threshold segmentation. (d) The spectral image of hyperspectral image of a ROI (skin melanin nevus). (e) The spectrum of skin melanin nevus.
In this study, a compact dual-channel endoscope was presented, and in vivo biomedical applications of the endoscopy were explicated. In the system, the image of the sample was relayed to the detection module, which consists of a video camera and homemade imaging spectrometer by a custom fiber bundle probe. The frame rate of the video camera was 30 per second, and the wavelength range of the imaging spectrometer was 400–750 nm, with an approximate 3 nm spectral resolution at 547 nm. This hyperspectral endoscope enables the obtainment of real-time video data and high-throughput hyperspectral data simultaneously. More importantly, by utilizing the spatial image captured by video camera to locate the ROI, this system is able to accomplish hyperspectral imaging of an ROI in about 1 s, giving it great potential to be used in clinical applications. We first demonstrated the spatial consistency between the video channel and the hyperspectral channel by acquiring the spatial image and hyperspectral cube of the end face of the fiber bundle. Thereafter, we investigated the relationship between the input voltage of the galvo mirror and the pixel index of the spatial image, which exhibited a linear relationship between them. Using a LED lamp as an illumination source, we obtained the hyperspectral cube of fingerprints and dorsum of the hand. The result apparently indicates different hemoglobin content in fingerprints and dorsum of the hand. To note, it takes 6 s to acquire the whole hyperspectral cube. In order to increase the speed of hyperspectral imaging, using the spatial image as guidance and extracting the pixel index of the ROI, we obtained the hyperspectral cube of the skin melanin nevus within 0.6 s, which demonstrates the system's capability of rapid detection. In the future, we can adopt more professional image segmentation methods [20] to obtain accurate ROI. Therefore, we believe this compact dual-channel (hyperspectral and video) endoscope is promising for biomedical applications in disease diagnosis. In addition, our system can also be extended to a double-fiber bundle, combined with binocular vision technology [21, 22], and the system can be extended to a four-dimensional (3D spatial and 1D spectral) detection system.
All datasets generated for this study are included in the article/supplementary material.
The studies involving human participants were reviewed and approved by the Medical Ethics Committee of Hainan Medical University and the Medical Ethics Committee of Hainan University.
WL and CW conceived the study. FC designed the optical system. MG and JL performed the experiments and analyzed data. FC developed the algorithm. JL, WL, and CW wrote the paper. All authors reviewed the results and approved the final version of the manuscript.
The work was supported by the high level talent support project of basic and applied basic research plan (Natural Science Field) of Hainan Province (2019RC080 to FC), the National Natural Science Foundation of China (31600863 to WL), the Scientific Research Fund of Hainan University (KYQD1653,) and the start-up fund of Hainan Medical University to WL.
The authors declare that the research was conducted in the absence of any commercial or financial relationships that could be construed as a potential conflict of interest.
1. Waterhouse DJ, Fitzpatrick CRM, di Pietro M, Bohndiek SE. Emerging optical methods for endoscopic surveillance of Barrett's oesophagus. Lancet. (2018) 3: 349–62. doi: 10.1016/S2468-1253(18)30030-X
2. Lan L, Xia Y, Li R, Liu K, Mai J, Medley JA, et al. A fiber optoacoustic guide with augmented reality for precision breast-conserving surgery. Light Sci Appl. (2018) 7:2. doi: 10.1038/s41377-018-0006-0
3. Qiu L, Chuttani R, Pleskow DK, Turzhitsky V, Khan U, Zakharoy YN, et al. Light Sci. Appl. (2018) 7:17174. doi: 10.1038/lsa.2017.174
4. Akbari H, Uto K, Kosugi Y, Kojima K, Tanaka N. Cancer detection using infrared hyperspectral imaging. Cancer Sci. (2011) 102:852–7. doi: 10.1111/j.1349-7006.2011.01849.x
5. Zhang H, Yuan J, Fu L. Imaging Fourier transform endospectroscopy for in vivo and in situ multispectral imaging. Opt Express. (2012) 20:23349–60. doi: 10.1364/OE.20.023349
6. Kester RT Bedard N, Gao L, Tkaczyk TS. Real-time snapshot hyperspectral imaging endoscope. J Biomed Opt. (2001) 16:056005–12. doi: 10.1117/1.3574756
7. Yao X, Cai F, Zhu P, Fang H, Li J, He S. Non-invasive and rapid pH monitoring for meat quality assessment using a low-cost portable hyperspectral scanner. Meat Sci. (2009) 152:73–80. doi: 10.1016/j.meatsci.2019.02.017
8. Das AJ, Wahi A, Kothari I, Raskar R. Ultra-portable, wireless smartphone spectrometer for rapid, non-destructive testing of fruit ripeness. Sci Rep. (2016) 6:32504. doi: 10.1038/srep32504
9. Halicek M, Fabelo H, Oretega S, Callico GM, Fei B. In-vivo and ex-vivo tissue analysis through hyperspectral imaging techniques: revealing the invisible features of cancer. Cancers. (2019) 11:756. doi: 10.3390/cancers11060756
10. Halicek M, Little JV, Wang X, Chen AY, Fei B. Optical biopsy of head and neck cancer using hyperspectral imaging and convolutional neural networks. J Biomed Opt. (2019) 24:036007. doi: 10.1117/1.JBO.24.3.036007
11. Steelman ZA, Ho DS, Chu KK, Wax A. Light-scattering methods for tissue diagnosis. Optica. (2019) 6:479–89. doi: 10.1364/OPTICA.6.000479
12. Wu IC, Syu HY, Jen CP, Lu MY, Chen YT, Wu MT, et al. Early identification of esophageal squamous neoplasm by hyperspectral endoscopic imaging. Sci Rep. (2018) 8:13797. doi: 10.1038/s41598-018-32139-1
13. Luthman AS, Water house DJ, Ansel-Bollepalli L, Yoon J, Gordon GSD, Joseph J, et al. Bimodal reflectance and fluorescence multispectral endoscopy based on spectrally resolving detector arrays. J Biomed Opt. (2018) 24:031009. doi: 10.1117/1.JBO.24.3.031009
14. Yoon J, Joseph J, Waterhouse DJ, Luthman AS, Gordon GSD, Pietro M, et al. A clinically translatable hyperspectral endoscopy (HySE) system for imaging the gastrointestinal tract. Nat Commun. (2019) 10:1902. doi: 10.1038/s41467-019-09484-4
15. Fabelo H, Ortega S, Ravi D, Kiran BR, Sosa C, Bulters D, et al. Spatio-spectral classification of hyperspectral images for brain cancer detection during surgical operations. PLoS ONE. (2018) 13:e0193721. doi: 10.1371/journal.pone.0193721
16. Hair JW, Hostetler CA, Cook AL, Harper DB, Ferrare RA, Mack TL, et al. Airborne high spectral resolution lidar for profiling aerosol optical properties. Appl Opt. (2008) 47:6734–52. doi: 10.1364/AO.47.006734
17. Cai F, Wang Y, Gao M, He S. The design and implementation of a low-cost multispectral endoscopy through galvo scanning of a fiber bundle. Opt Commun. (2018) 428:1–6. doi: 10.1016/j.optcom.2018.07.044
18. Li Q, He X, Wang Y, Liu H, Xu D, Guo F. Review of spectral imaging technology in biomedical engineering: achievements and challenges. J Biomed Opt. (2013) 18:100901. doi: 10.1117/1.JBO.18.10.100901
19. Sansonetti CJ, Salit ML, Reader J. Wavelengths of spectral lines in mercury pencil lamps. Appl Opt. (1996) 35:74–7. doi: 10.1364/AO.35.000074
20. Kharmyssov C, Ko MWL, Kim JR. Automated segmentation of optical coherence tomography images. Chin Opt Lett. (2019) 17:041701. doi: 10.3788/COL201917.011701
21. Yu N, Wang S. Enhanced autonomous exploration and mapping of an unknown environment with the fusion of dual RGB-D sensors. Engineering. (2019) 5:164–72. doi: 10.1016/j.eng.2018.11.014
Keywords: optical fiber bundle probe, galvo-scanning module, dual-channel, region of interest, hyperspectral
Citation: Cai F, Gao M, Li J, Lu W and Wu C (2020) Compact Dual-Channel (Hyperspectral and Video) Endoscopy. Front. Phys. 8:110. doi: 10.3389/fphy.2020.00110
Received: 12 February 2020; Accepted: 23 March 2020;
Published: 28 April 2020.
Edited by:
Chao Tian, University of Science and Technology of China, ChinaReviewed by:
Jiaxin Yu, University of Shanghai for Science and Technology, ChinaCopyright © 2020 Cai, Gao, Li, Lu and Wu. This is an open-access article distributed under the terms of the Creative Commons Attribution License (CC BY). The use, distribution or reproduction in other forums is permitted, provided the original author(s) and the copyright owner(s) are credited and that the original publication in this journal is cited, in accordance with accepted academic practice. No use, distribution or reproduction is permitted which does not comply with these terms.
*Correspondence: Wen Lu, c3dreGx3QDE2My5jb20=; Chengde Wu, Y2hlbmdkZXd1QHllYWgubmV0
Disclaimer: All claims expressed in this article are solely those of the authors and do not necessarily represent those of their affiliated organizations, or those of the publisher, the editors and the reviewers. Any product that may be evaluated in this article or claim that may be made by its manufacturer is not guaranteed or endorsed by the publisher.
Research integrity at Frontiers
Learn more about the work of our research integrity team to safeguard the quality of each article we publish.