- 1Department of Engineering Sciences, Faculty of Advanced Technologies, University of Mohaghegh Ardabili, Namin, Iran
- 2Department of Engineering Sciences, Faculty of Advanced Technologies, Sabalan University of Advanced Technologies (SUAT), Namin, Iran
- 3Department of Physics, Faculty of Sciences, University of Mohaghegh Ardabili, Ardabil, Iran
- 4Physics Department, Faculty of Science, Imam Khomeini International University, Qazvin, Iran
The non-linear thermo-optical response of MoS2 nanoflakes was investigated using the Z-scan technique, employing TM00-mode with a CW-laser diode operating at a wavelength of 532 nm. The systems were found to display a strong non-linear response, dominated by non-linear refraction. The effect of the thickness of the MoS2 layer, deposited on a glass substrate, on the non-linear susceptibility was studied. Furthermore, in this study, the effects of modifying the thickness of the MoS2 nanoflakes on the non-linear optical phenomena, such as self-focusing and self-defocusing was investigated for the first time. In all cases, the non-linear absorption and refraction were determined. The corresponding third-order susceptibilities and second-order hyperpolarizability were calculated to be as large as 10–7 (esu) and 10–32 (esu), under laser excitation, respectively. Showing large third-order optical non-linearity suggests the potential of the MoS2 nanoflakes in photonics applications.
Introduction
For the past few decades, the subjects that have stolen the spotlight of the theoretical and experimental interests are the linear and non-linear optical response of semiconductors [1, 2]. Recently, among the novel two-dimensional (2D) materials, transition metal dichalcogenides (TMDCs) with the general formula MX2, where M refers to a transition metal and X refers to a chalcogen (S, Se, or Te), has shown particularly promising electronic and optoelectronic properties [3–5]. Molybdenum disulfide (MoS2) is one of the most typical TMDCs. A monolayer of MoS2 is a semiconductor with a direct bandgap of 1.8 eV [6]. This property of MoS2 can largely compensate for the weakness of the gapless graphene, which is an essential factor in making it possible to be used in the next-generation switching, optoelectronic and photonic devices, such as optical limiters, mode-lockers, and Q-switchers [7, 8]. A wide range of research has been conducted on the non-linear properties of few-layer MoS2 structures including saturable absorption, non-linear absorption and non-linear refraction [9–11].
However, realizing the photophysical properties and discovering the potential for usage of few-layer MoS2 compounds in optical applications come hand in hand with studying the non-linear optical properties of these structures. There are various techniques for measuring the non-linear refractive index. The Z-scan is a sensitive and standard technique that offers simplicity and high sensitivity and was the technique employed for measuring the sign and the magnitude of the non-linear refractive index, as well as the non-linear absorption coefficient [12–15].
A methodical first-principles study of the second-order non-linear optical properties of the MX2 (M =Mo, Wand X = S, Se) was carried out by Chung-Yu Wang et al. [16]. They demonstrated that the second-order non-linear optical susceptibility [χ(2)] of the MX2 monolayer, over the whole range of the optical photon energy, is large and comparable to that of GaAs. Zhang et al. [17] used the Z-scan technique at various wavelengths, with femtosecond pulses. They examined the layer number and the excitation wavelength effects on the optical non-linearity of mono- and few-layers of WS2 and MoS2, and discovered that the monolayer WS2 exhibited high optical non-linearities, having a two-photon absorption coefficient of ~1.0 × 104 cm/GW. Moreover, Nitesh Dhasmana et al. demonstrated a dual absorption characteristic of the exfoliated MoS2 dispersed in 1-Methyl-2-pyrrolidinone using an open aperture Z-scan technique [18]. They showed that, due to non-linear optical scattering, a saturable absorption in MoS2, at low fluences, and a deviation from this saturable absorption, at higher fluences, can be observed. Zhang et al. experimentally verified that MoS2 has a broadband saturable absorption response from visible to the near-infrared band [19]. They also demonstrated the first ultrafast photonics application of MoS2 saturable absorber for passive laser mode-locking operation, and experimentally, generated nanosecond pulses. They showed that, contrary to other saturable absorbers similar to graphene, the MoS2 saturable absorber has excellent mode-locking ability. Non-linear optical properties of WS2 and MoS2, obtained from both open and closed aperture Z-scan techniques using a picosecond mode-locked Nd: YAG laser operating at a wavelength of 1,064 nm, were investigated by Bikorimana et al. [20]. Both WS2 and MoS2 showed non-linear saturable absorption, whereas WSe2 and Mo0.5W0.5S2 exhibited non-linear two-photon absorption. A large two-photon absorption coefficient, β, as high as +1.91 × 10⁻⁸ cm/W was attained for Mo0.5W0.5S2, and a non-linear refractive index of n2 = −2.47 × 10⁻⁹ cm2/W was determined for the WSe2 sample.
In the previous works, the structural and optical properties of the MoS2 nanoflakes, grown on different substrates, such as silicon and quartz, by one-step thermal chemical vapor deposition were studied [21, 22]. In addition, the Z-scan technique was employed to study the non-linear optical properties of the obtained nanoflakes [22].
Here, the non-linear thermo-optical properties of MoS2 nanoflakes, deposited on a glass substrate with various layer thickness, using the Z-scan technique, employing CW-laser diodes operating at 532 nm wavelength, were investigated. From the open-aperture Z-scan data it was realized that these two-dimensional structures exhibit two-photon absorption. The sign and the magnitude of the third-order non-linearity, by the means of the closed aperture Z-scan, was estimated.
Experimental
Preparation of Materials
Thin films containing mono and few-layer MoS2 were synthesized by one-step thermal chemical vapor deposition on Si/SiO2 substrate. Details of the experimental procedures were described elsewhere [22]. First, in order to remove the native oxides from the silicon substrates, these substrates were soaked in hydrofluoric acid (HF) (10%). Then, by means of RF magnetron sputtering, 200 nm SiO2 was sputtered on the substrates. Afterward, the MoO3 powder (MERCK 99.5%, 50 mg) was collected in a ceramic boat and put in the highest-temperature thermal zone of the tube. The sulfur powder (TITRACHEM 99,0%, 500 mg) in another ceramic boat, near gas flow direction, was placed at the lower-temperature entrance of the tube (150–200°C). The substrate was placed face down on top of the boat containing MoO3 in the hot zone. The furnace was heated from the room temperature up to 900°C within 20 min (45°C/min), in Ar gas flow (400 sccm) for 30 min. In order to start the reaction of the precursors under the Ar gas flow of 200 sccm as the carrier gas, the final temperature was kept constant for 1 h, and finally, the furnace was cooled to room temperature.
For the Z-scan measurement and the subsequent investigation of the effect of the MoS2 layer's thickness on the non-linear optical properties, the following procedures were carried out. First, the prepared thin film was immersed in the solution of ethanol (64%) and DI water (36%) and treated by an ultrasonic homogenizer, with the power of 80 W for 15 min. The treated solution was drop cast on a glass substrate and dried in atmospheric condition. In principle, film thickness depends on the volume of the solution dispersed. In this work, films with thicknesses of 150, 230, and 420 nm (sample 1, sample 2, and sample 3, respectively) were achieved using different volumes of the solution.
Characterization Techniques
Structure and the Bragg reflections of the MoS2 nanoflake were characterized by X-ray diffraction (XRD) (Cu Kα X-ray radiation source, Ital structure model MPD 3000), with 2θ within the range of 2–70°. The scanning speed and step intervals were 1°/min and 0.02°, respectively. UV–visible diffuse reflectance spectra (UV–Vis DRS) were recorded on a Sinco S4100 spectrophotometer. The thickness of the thin films of the MoS2 structure was measured using Dektak XT Profilometer (Bruker). Scanning electron microscopy (SEM) (LEO 1430VP) and atomic force microscopy (AFM) (Nanosurf) were used to determine the morphology and roughness of the thin films of the MoS2 nanoflake, respectively.
Non-linear Optical Measurement
The third-order non-linear optical properties of the two-dimensional MoS2 structure were measured using the single-beam Z-scan technique. Briefly, the Z-scan technique depends on the evaluation of the transmission of a sample when it is irradiated by a focused Gaussian laser beam and its position is translated through the beam waist along the propagation direction. As the sample experiences different laser intensities at different positions, the recordings of the transmission, as a function of the Z coordinate, provide information about the third-order non-linear effects [12]. The two measurable quantities are non-linear absorption and non-linear refraction. The non-linear absorption is determined by the “open-aperture” Z-scan, while the non-linear refraction is measured using the “closed-aperture” Z-scan. Furthermore, this technique gives the real and the imaginary parts of the third-order susceptibility, χ(3), second-order hyperpolarizability, γ, and also provides important information regarding the non-linear optical properties of the materials [12]. A diode laser operating at a wavelength of 532 nm was used as the light source. The laser beam was focused using a 100 mm focal length lens onto the sample's surface. These experimental conditions produced an intensity of 1.236 × 10³ Wcm−2 at the focal point. The laser beam radii at the focal point were measured using a CCD camera and were found to be ω0 = 39.3 μm. The Raleigh length, , was determined to be Z0 = 9.11 mm, i.e., a value much larger than the film's thickness, which is an essential prerequisite for the Z-scan experiments. The sample was moved along the Z-axis using a translation stage. An aperture with a diameter of 2 mm was located before the photodetector placed away from the beam's focus. The transmittance of the aperture, S, was determined to be ~0.54 by . In this equation, ra is the radius of the aperture, and ωa is the beam waist on the aperture. Closed aperture data were obtained by measuring the transmitted beam intensity from the sample as a function of the sample's position along the propagation direction. The measurements were repeated after removing the aperture in order to obtain the open aperture data [12]. In this work, the third-order non-linear optical parameters of the MoS2 nanoflakes with different thicknesses were studied. In order to evaluate the effect of glass substrate to the Z-scan results, measuring the non-linearity of substrate without MoS2 nanoflakes is performed and results show that glass substrate couldn't show measurable effect on the Z-scan results.
Results and Discussion
Structural Studies
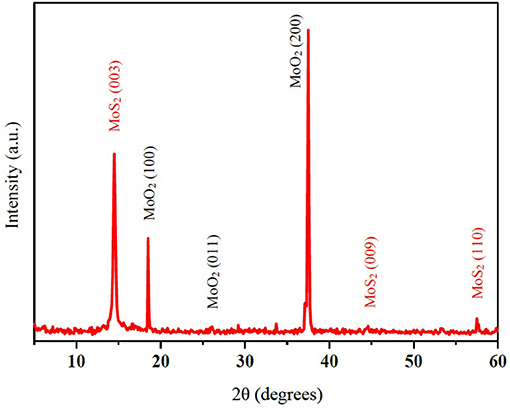
The structural properties of the nanoflakes were investigated by XRD analysis. The X-ray diffraction pattern of the MoS2 nanoflakes is shown in Figure 1. The main peak at 2θ = 14.4° is attributed to the (003) plane of 3R-MoS2. The other corresponded peaks observed at 2θ = 44.2° and 58.2° are related to the (009) and (110) planes, respectively (RefCode: 01–077-0341). Furthermore, the peak at 2θ = 37.3° corresponds to the (200) plane of MoO2, while another peak at 2θ = 18.4° is attributed to the (100) plane of MoO2 (RefCode: 01–086-0135).
SEM micrographs of the MoS2 nanoflakes, with different magnifications, are shown in Figures 2A,B. These images show the nanoflakes are grown with sharp edges and are in great abundance. On the other hand, AFM is applied in order to characterize the topography and surface quality of the prepared samples. Figures 2C,D represent the phase profile of the MoS2 film and the corresponding height profile as typical. It indicates that the MoS2 film is continuous and the average roughness is about 80 nm. This sample's surface roughness or optical path is appropriate for z-scan measurement.”
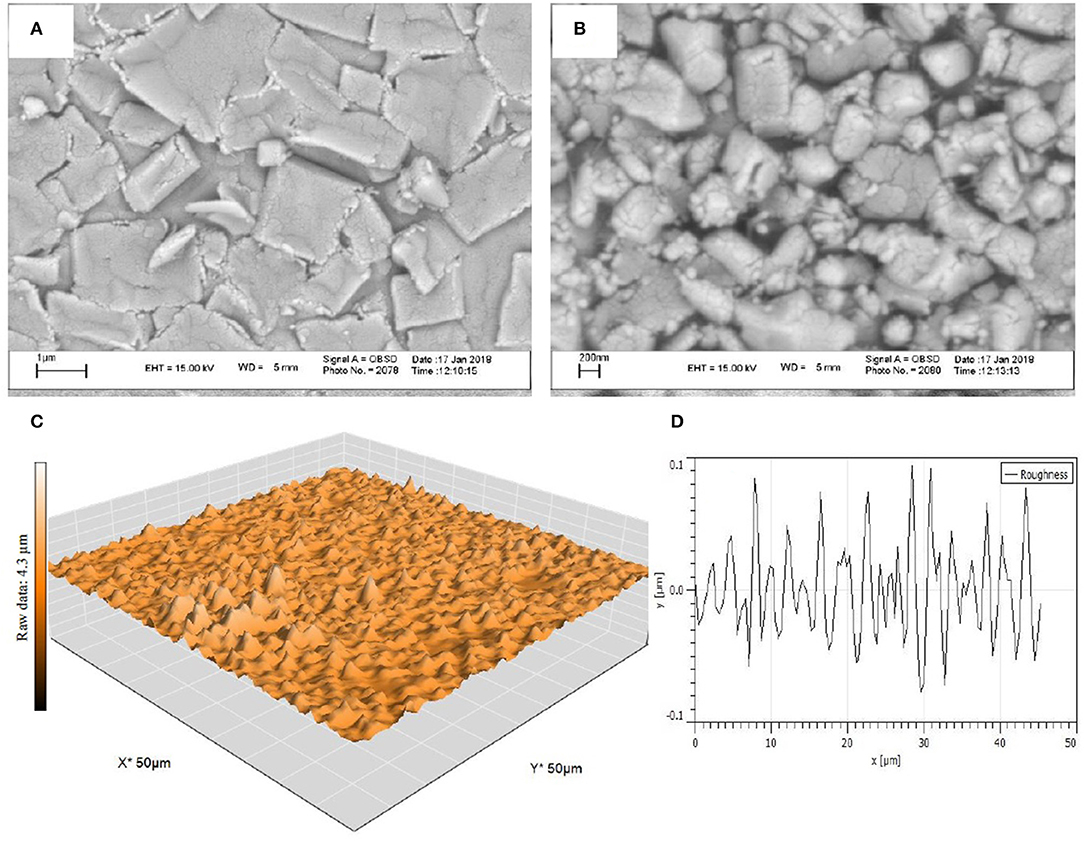
Figure 2. (A,B) SEM micrographs of the MoS2 nanoflakes with different magnificence. (C) Phase profile of the MoS2 film and (D) the corresponding height profile as typical.
Furthermore, the optical diffuse reflectance spectra were used to calculate the values of the optical band gap energies for the MoS2 nanoflakes. Figure 3A presents the diffuse reflectance spectra of the MoS2 nanoflakes as a function of the wavelength. The results confirmed that the valence to conduction band transport of electrons, as a result of the absorption of the incident photon, leads to the reduction of the intensity of light at the relevant wavelength. Consequently, the relative percentage of the transmission to reflectance is diminished [23]. As it can be seen in Figure 3A, for the MoS2 nanoflakes, by reducing the wavelength of the incident photons from 493 to 354 nm, the reflectance is decreased.
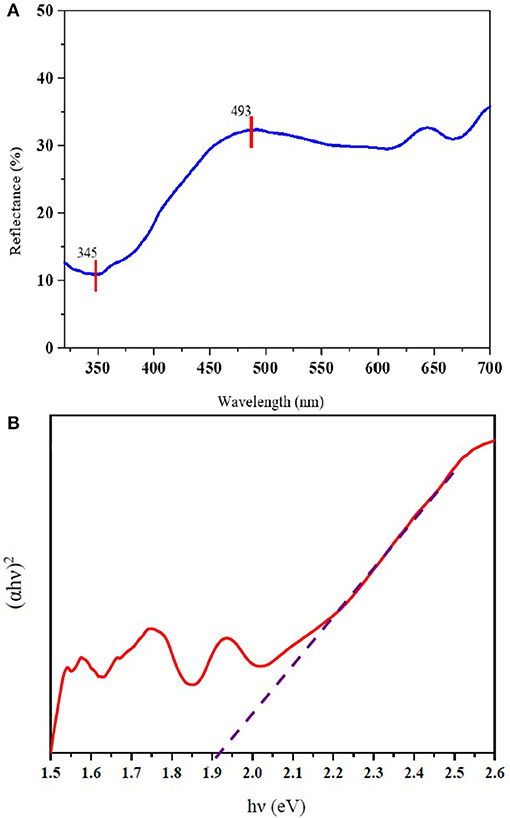
Figure 3. (A) Diffuse reflectance spectra of the MoS2 nanoflakes. (B) Tauc's plot of (αhν)2 as a function of photon energy (hν) for the MoS2 nanoflakes.
The band gap energy was calculated using a reflectance technique by the Mott and Davis theory [24]. Experimental values for the bandgap were attained by extrapolating the linear region of the curves to the zero absorption at (αhν)2 = 0, for the direct allowed transitions [12, 23]. Figure 3B displays the plot of (αhν)2 as a function of the incident photon energy (hν), for the direct allowed transitions of the MoS2 nanoflakes. The optical band gap for the MoS2 nanoflakes is calculated to be 1.91 eV.
Non-linear Optical Studies
In Figure 4, the closed aperture Z-scan curves of the MoS2 nanoflakes are presented. In order to investigate the effect of samples' thickness on the non-linear optical properties, films with different thicknesses of 150, 230, and 420 nm (sample 1, sample 2, and sample 3, respectively) were used. As can be seen, both films of the MoS2 nanoflakes with thicknesses of 150 and 230 nm exhibit a pre-focal peak followed by a post-focal valley. Thus, inferring a negative value of the non-linear refractive index, indicating a self-defocusing behavior, for these samples [25, 26]. As the thickness of the film of the MoS2 nanoflakes reaches to 420 nm, a pre-focal valley and a post-focal peak represent a positive value for the non-linear refractive index that signifies a self-focusing behavior in this sample.
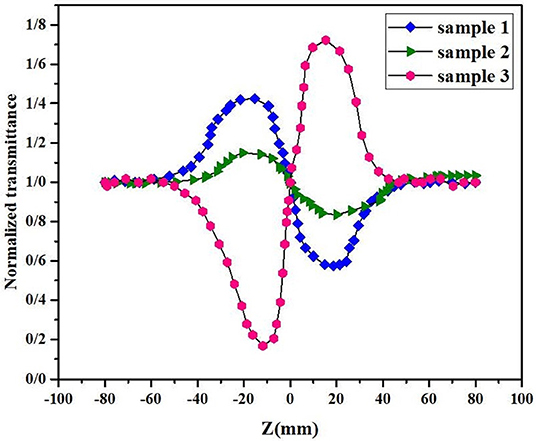
Figure 4. Closed aperture Z-scan traces of MoS2 nanoflakes with various thickness: 150 nm (sample 1), 230 nm (sample 2), and 420 nm (sample 3).
Using the theoretical fit, via the experimental data of the closed aperture Z-scan curve, ΔTP−V = TP − TV can be obtained. After the ΔTP−V is derived from the difference of the transmittance between the peak and valley, the magnitude of the phase shift |Δφ0| is given by:
Here, S is the fraction of the beam transmitted through the aperture [25]. The non-linear refractive index, n2, can be calculated as:
Where I0 is the peak on-axis irradiance at the focal point, and the effective thickness can be expressed by the following form:
Where the linear absorption coefficient is , in which l is the thickness of the thin film, I and I0 are the transmitted and the incident intensities, respectively [12, 25]. The results of the calculations are tabulated in Table 1. The linear absorption coefficient was measured through the conventional method, in the linear regime of the experiment. By changing the thickness of the film from 150 to 230 and 420 nm (sample 1, sample 2, and sample 3, respectively), the linear absorption coefficient varies from 9.51 × 104 cm−1 to 6.91 × 104 cm−1 and 4.21 × 104 cm−1, respectively. The closed aperture Z-scan results showed that the non-linear refractive index decreases substantially in the MoS2 nanoflakes as the thickness of the films is increased from 150 to 230 nm. By further increasing the thickness of the film up to 420 nm, the sign of the non-linear refractive index changes from negative to positive, and also the magnitude of the non-linear refractive index increases to 3.92 × 10⁻³ (cm2/W). It is worth mentioning that a CW laser was used and so a thermal effect is also accompanied by the non-linear optical properties. This fact induces an enhancement in the obtained non-linear refractive index. So obviously, the thermo-optical non-linear response of the nanoflakes was investigated.
Recently, Jiang et al. investigated the role of the dipole moment in characterizing the non-linear optical behavior of materials [27]. To better understand the relevance between the dipole moments and the NLO responses, a flexible dipole model was suggested. This model clearly confirmed that the induced dipole oscillations via the external field, rather than the intrinsic dipole moments, determine the NLO responses. Therefore, in order to attain a large SHG effect, the focus should be on the non-centrosymmetric crystals containing flexible chemical bonds and not merely on the crystals with large polarity, since for the non-centrosymmetric crystals, the microscopic second-order susceptibility of the relevant active groups is additively superposed. So, the large third-order non-linear optical susceptibility in the MoS2 nanoflakes could depend on the intrinsic dipole moments in the centrosymmetric crystal. On the other hand, the open-aperture Z-scan curves of the MoS2 nanoflakes, with three different thicknesses (150, 230, and 420 nm) in Figure 5, show a transmission minimum, when the samples reach the focal point. A normalized transmittance valley, indicating the existence of a two-photon absorption behavior, corresponding to positive sign non-linear absorption (β > 0).
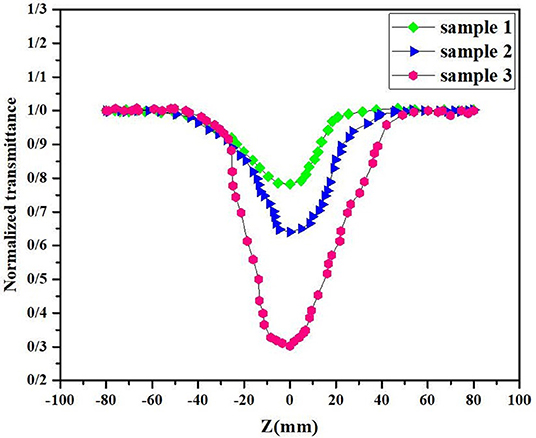
Figure 5. Open aperture Z-scan traces of MoS2 nanoflakes with various thickness: 150 nm (sample 1), 230 nm (sample 2), and 420 nm (sample 3).
The saturable absorption coefficient, β, can be determined by:
q0 can be obtained by fitting the experimental plots with the theoretical plots, where, the normalized change in the transmitted intensity (ΔT(Z)= T(Z)-1) can be approximated by the following equation:
Van Stryland et al. [25] the obtained values of the non-linear absorption coefficient, β, for the MoS2 layers with different thicknesses are shown in Table 1.
Interestingly, the non-linear absorption coefficient increases substantially by augmenting the thickness of the MoS2 layers.
The real and the imaginary parts of the third-order susceptibility, χ(3), can be given in the following forms [28]:
and
Where, ε0 and c describe the vacuum permittivity and the speed of light in vacuum, respectively. Based on this theory, the results of the experiments are used to calculate the third-order susceptibility of the MoS2 layers with different thicknesses. The results of these calculations are also presented in Table 1.
Finally, the corresponding second-order hyperpolarizability, γ, (i.e., the polarizability per molecule) is defined as:
Where N is the number of molecules per unit volume, and the local field correction factor, L, can be given by [29].
The values of γ, for the MoS2 nanoflakes, are given in Table 1. The obtained values of χ(3) and γ show that these two-dimensional structures exhibit large second-order hyperpolarizability and signify their potential applications as NLO materials. Our study concluded that these two-dimensional materials are potential candidates for non-linear optical applications.
Conclusion
In conclusion, in this study, the non-linear thermo-optical response of the MoS2 nanoflakes was investigated by means of the Z-scan technique. It was found that by increasing the thickness of the MoS2 layers, the non-linear refractive index is increased, and the TPA process can occur with high probability, leading to the focusing of the Gaussian beam. Also, the MoS2 nanoflakes were found to exhibit very large values of third-order non-linear susceptibility. Furthermore, the MoS2 nanoflakes presented a self-defocusing behavior (i.e., negative non-linear refraction) in low thicknesses and a self-focusing behavior (positive non-linear refraction) in high thicknesses. Also, these nanoflakes showed two-photon absorption in all samples. Thus, the magnitude and the sign of the non-linear refractive index can be tuned by modifying the thickness of the MoS2 nanoflakes. Also, the strong non-linear optical properties observed in these samples can be attributed to the intrinsic dipole moments in the centrosymmetric crystal. It has been demonstrated that these two-dimensional MoS2 structures provide a suitable medium to observe and quantify two-photon absorption. It is concluded that the MoS2 nanoflakes development, as non-linear optical materials and devices, is a new and exciting opportunity.
Data Availability Statement
All datasets generated for this study are included in the article/supplementary material.
Author Contributions
All authors listed have made a substantial, direct and intellectual contribution to the work, and approved it for publication.
Conflict of Interest
The authors declare that the research was conducted in the absence of any commercial or financial relationships that could be construed as a potential conflict of interest.
References
1. Irimpan L, Krishnan B, Nampoori VPN, Radhakrishnan PJ. Luminescence tuning and enhanced nonlinear optical properties of nanocomposites of ZnO–TiO2. Colloid Interface Sci. (2008) 324:99–104. doi: 10.1016/j.jcis.2008.04.056
2. El Ouazzani H, Dabos-Seignon S, Gindre D, Iliopoulos K, Todorova M, Bakalska R, et al. Novel styrylquinolinium dye thin films deposited by pulsed laser deposition for nonlinear optical applications. J Phys Chem. (2012) 116:7144–52. doi: 10.1021/jp2118218
3. Lee HS, Min SW, Chang YG, Park MK, Nam T, Kim H, et al. MoS2 nanosheet phototransistors with thickness-modulated optical energy gap. Nano Lett. (2012) 12:3695–700. doi: 10.1021/nl301485q
4. Yin Z, Li H, Jiang L, Shi Y, Sun Y, Lu G, et al. Single-layer MoS2 phototransistors. ACS Nano. (2011) 6:74–80. doi: 10.1021/nn2024557
5. Dashora A, Ahuja U, Venugopalan K. Electronic and optical properties of MoS2 thin films: feasibility for solar cells. Comput Mater Sci. (2013) 69:216–21. doi: 10.1016/j.commatsci.2012.11.062
6. Ganatra R, Zhang Q. Few-layer MoS2: a promising layered semiconductor. ACS Nano. (2014) 8:4074–99. doi: 10.1021/nn405938z
7. Bao QL, Zhang H, Wang Y, Ni Z, Yan Y, Shen ZX, et al. Atomic-layer graphene as a saturable absorber for ultrafast pulsed lasers. Adv Funct Mater. (2009) 19:3077–83. doi: 10.1002/adfm.200901007
8. Zhang H, Tang DY, Zhao LM, Bao QL, Loh KP. Large energy mode locking of an erbium-doped fiber laser with atomic layer graphene. Opt Exp. (2009) 17:17630–5. doi: 10.1364/OE.17.017630
9. Li P, Liang B, Su M, Zhang Y, Zhao Y, Zhang M, et al. 980-nm Q-switched photonic crystal fiber laser by MoS2 saturable absorber. Appl Phys. (2016) 122:150. doi: 10.1007/s00340-016-6433-9
10. Khudyakov DV, Borodkin AA, Lobach AS, Mazin DD, Vartapetov SK. Optical nonlinear absorption of a few-layer MoS2 under green femtosecond excitation. Appl Phys B. (2019) 125:73. doi: 10.1007/s00340-019-7167-2
11. Li Y, Dong N, Zhang S, Zhang X, Feng Y, Wang K, et al. Two photon absorption in monolayer MoS2. Laser Photonics Rev. (2015) 9:427–34. doi: 10.1002/lpor.201500052
12. Mirershadi S, Ahmadi-Kandjani S, Zawadzka A, Rouhbakhsh H, Sahraoui B. Third order nonlinear optical properties of organometal halide perovskite by means of the Z-scan technique. Chem Phys Lett. (2016) 674:7–13. doi: 10.1016/j.cplett.2016.01.04
13. Abdallah B, Zidan MD, Allahham A. Deposition of ZnS films by RF magnetron sputtering: structural and optical properties using Z-scan technique. Int J Mod Phys. (2019) 33:1950348. doi: 10.1142/S021797921950348X
14. Majlesara MH, Dehghani Z. (2012). Measurement of nonlinear responses and optical limiting behavior of Tio2/Ps nano-composite by single beam technique with different incident intensities. Int J Mod Phys B. 5:277–83. doi: 10.1142/S2010194512002139
15. Arun Gaur DK, Sharma KS, Singh N. Photoexcited carrier lifetime in direct and indirect band gap crystals on the Z-Scan technique at 532 nm. Int J Mod Phys. (2007) 21:3029–34. doi: 10.1142/S021797920703751X
16. Chung-Yu W, Guang-Yu G. Nonlinear optical properties of transition-metal dichalcogenide MX2 (M = Mo, W; X = S. Se) monolayers and trilayers from first-principles calculations. J Phys Chem C. (2015) 119:13268–76. doi: 10.1021/acs.jpcc.5b01866
17. Zhang S, Dong N, McEvoy N, O'Brien M, Winters S, Berner NC, et al. Direct observation of degenerate two-photon absorption and its saturation in WS2 and MoS2 monolayer and few-layer films. ACS Nano. (2015) 9:7142–50. doi: 10.1021/acsnano.5b03480
18. Dhasmana N, Fadil D, Kaul AB, Thomas J. Investigation of nonlinear optical properties of exfoliated MoS2 using Photoacoustic Zscan. MRS Adv. (2016) 1:1–7. doi: 10.1557/adv.2016.456
19. Zhang H, Lu SB, Zheng J, Du J, Wen SC, Tang DY, et al. Molybdenum disulfide (MoS2) as abroadband saturable absorber for ultra-fast photonics. Opt Exp. (2014) 22:7249–60. doi: 10.1364/OE.22.007249
20. Bikorimana S, Lama P, Walser A, Dorsinville R, Anghel S, Mitioglu A, et al. Nonlinear optical responses in two-dimensional transition metal dichalcogenide multilayer: WS2, WSe2, MoS2 and Mo0.5W0.5S2. Opt Exp. (2016) 24:20685–95. doi: 10.1364/OE.24.020685
21. Bayesteh S, Mortazavi SZ, Reyhani A. Investigation on nonlinear optical properties of MoS2 nanoflakes grown on silicon and quartz substrates. J Phys D. (2018) 51:195302–10. doi: 10.1088/1361-6463/aab808
22. Bayesteh S, Mortazavi SZ, Reyhani A. Role of precursors' ratio for growth of two-dimensional MoS2 structure and investigation on its nonlinear optical properties. Thin Solid Films. (2018) 663:37–43. doi: 10.1016/j.tsf.2018.08.013
23. Mirershadi S, Sattari F, Golghasemi Sorkhabi S, Shokri AM. Pressure-induced optical band gap transition in methylammonium lead halide perovskites. J Phys Chem. (2019) 123:12423–8. doi: 10.1021/acs.jpcc.9b02744
25. Van Stryland EW, Sheik-Bahae M, Kuzyk MG, Dirk CW. Z-Scan Measurements of Optical Nonlinearities Characterization Techniques and Tabulations for Organic Nonlinear Materials. Marcel Dekker, Inc (1998). p. 655–692.
26. Joshi JH, Kalainathan S, Kanchan DK, Joshi MJ, Parikh KD. Effect of l-threonine on growth and properties of ammonium dihydrogen phosphate crystal. Arab J Chem. (2020) 13:1532–50. doi: 10.1016/j.arabjc.2017.12.005
27. Jiang X, Zhao S, Lin Z, Luo J, Bristwe PD, Guan X, et al. The role of dipole moment in determining the nonlinear optical behavior of materials: ab initio studies on quaternary molybdenum tellurite crystals. J Mater Chem. (2014) 2:530–7. doi: 10.1039/C3TC31872A
28. Golian Y, Dorranian D. Effect of thickness on the optical nonlinearity of gold colloidal nanoparticles prepared by laser ablation. Opt Quant Electron. (2014) 46:809–19. doi: 10.1007/s11082-013-9792-z
Keywords: Z-scan technique, non-linearity, refractive index, MoS2, non-linear susceptibility, hyperpolarizability
Citation: Mirershadi S, Sattari F, Alipour A and Mortazavi SZ (2020) Non-linear Thermo-Optical Properties of MoS2 Nanoflakes by Means of the Z-Scan Technique. Front. Phys. 8:96. doi: 10.3389/fphy.2020.00096
Received: 15 January 2020; Accepted: 13 March 2020;
Published: 03 April 2020.
Edited by:
Samit K. Ray, Indian Institute of Technology Kharagpur, IndiaReviewed by:
Jianming Wen, Kennesaw State University, United StatesYilin Sun, Tsinghua University, China
Copyright © 2020 Mirershadi, Sattari, Alipour and Mortazavi. This is an open-access article distributed under the terms of the Creative Commons Attribution License (CC BY). The use, distribution or reproduction in other forums is permitted, provided the original author(s) and the copyright owner(s) are credited and that the original publication in this journal is cited, in accordance with accepted academic practice. No use, distribution or reproduction is permitted which does not comply with these terms.
*Correspondence: Soghra Mirershadi, cy5taXJlcnNoYWRpQHVtYS5hYy5pcg==
†These authors have contributed equally to this work
 Soghra Mirershadi
 Farhad Sattari3†