 Shigang Wen
 Yu Tan
 Mengge Li
 Yunke Deng
 Chuangxia Huang*
95% of researchers rate our articles as excellent or good
Learn more about the work of our research integrity team to safeguard the quality of each article we publish.
Find out more
ORIGINAL RESEARCH article
Front. Phys. , 02 April 2020
Sec. Social Physics
Volume 8 - 2020 | https://doi.org/10.3389/fphy.2020.00085
This article is part of the Research Topic From Physics to Econophysics and Back: Methods and Insights View all 31 articles
Remittance, one money flow between immigrants and their relatives, is a major source of foreign exchange revenue for economies. Consisting of economies linked by the money flows, global remittance constitutes a network. In this paper, we use bilateral remittances of 210 economies for the time period 2010–2016 to construct a global remittance network (GRN) and then investigate the network's structural properties. We study the degree distribution of the network and find that it is of heterogeneity. Analyses of centrality measures reveal that some key economies, such as the United States, France, India and China, are always ranked the highest. We also detect 6 communities in the network, where economies in the same regional economy cooperative organizations tend to be classified in the same community. Intra-community flows account for 66.07% of total remittances, indicating that economies present the characteristic of regionalization. In addition, the results of the topological stability test show that GRN is fragile to node removal, particular the selective removal based on betweenness centrality.
With the intensifying globalization, human migration is an increasing social phenomenon over the world. It leads to a huge transfer in the flow of capital, labor, and knowledge across international boundaries [1]. From a capital view, one special money flow associated with migration is well known as remittance. According to the World Bank, global remittances reach $613 billion in 2017 and involve more than 258 million migrants all over the world [2]. Since the remittance flows among numerous suppliers and recipients present complicated relationships, as far as global remittances are concerned, it is rather natural to count as a complex system.
Complex networks have proven to be a very powerful approach to characterize and analyze a broad array of different complex systems [3–7], such as human migration [8–10], biological mathematics [11, 12], technological [13–17] and finance systems [18–24]. These highly inter-coupled systems have been the focus of a great number of researches, which have investigated influential nodes of the systems. The analysis of key nodes for complex systems is of crucial importance, as it can help in ensuring the more efficient spread of information for technological system [13, 14], hindering crisis propagation for finance systems, and so on [19, 25–27]. In addition to the above discussed complex systems, recently, the global remittance has been incipiently investigated from a complex network perspective [28, 29].
Existing studies on remittance network mainly focused on node degree and strength, degree distribution and circular pattern [28, 29]. These complex network analysis tools can well identify influential remittance suppliers and recipients as well as collaboration pattern between two economies. However, some economies may also play important roles as bridge in the network [30]. The ability of an economy to transfer the remittance from one economy to another has not been studied yet. On the other hand, in addition to the circular pattern between economy pair, community has been regarded as another important topology structure in networks [8, 30]. Yet little attention has been paid so far to uncover the community structure of global remittance and it still remains as a challenging open problem. Such research not only allows a deep and clear understanding of local properties of the remittance network itself, but also provides good guidance for the remittance management of policy makers and ensures greater regional cooperation.
Motivated by the above discussion, in this paper, by employing bilateral remittance of 210 economies over the period from 2010 to 2016, we construct a global remittance network (GRN). Moreover, we present a detailed study of the key economies for GRN, including degree, degree distribution, node strength, betweenness centrality, community structure, topological stability and so on. The main contributions of this paper can be summarized as follows: (1) Differing somewhat from previous studies that identify influential remittance suppliers and recipients, we also evaluate the importance of economies by taking fully into consideration of the intermediary roles of economies. (2) Literature dealing with the collaboration mechanism of economies in GRN mainly focuses on circular pattern between economy pairs; analysis of economies in community appears to be scarce. Our research intends to fill the existing gap in the literature. (3) This paper originally investigates the effect of key node removal on the topological stability of GRN, and finds that the network is fragile to node removal, particular the selective removal based on betweenness centrality.
The remainder of the paper is arranged as follows. In section 2, the employed methodology related to the empirical investigation is proposed. Section 3 provides details about the bilateral remittance data. Section 4 presents the empirical results and relates them to economic theory. Finally, conclusions are drawn in section 5.
This section first proposes a network modeling approach to characterize the global remittance. Then, it introduces a variety of complex network analysis tools, such as degree, degree distribution, node strength, betweenness centrality, community structure and so on.
The global remittance network is represented by a set G = (V, E), where economies V = (v1, v2, ···, vn) are denoted as the network nodes and remittance flows set E as the network edges [31]:
where eij is accumulated remittance from economy i to economy j (i ≠ j) during a certain period, while self-loops (i = j) are not permitted. Therefore, an adjacency matrix E is constructed to characterize the directed weighted network.
Degree ki of a node is the number of edges that the node is connected to. In directed networks, the notion of degree can be further extended to the in-degree and out-degree , which are defined as follows [20]:
where aij denotes the indicator function that yields 1 if there is a directed edge from node i to j, and 0, otherwise. While N is the total number of nodes in the network. Moreover, the identity holds.
Since different nodes have various degrees, the degree distribution is used to describe the probability distribution of these degrees over the network. The degree distribution is given by:
where nk is the number of nodes with degree k.
In weighted networks, the edges between nodes are no longer treated as binary interactions, but are measured by their magnitudes. Thus, node strength si is proposed to measure the sum of edge weights of i toward its neighbors. Likewise the degree, the notion of node strength can be decomposed into the in-strength and out-strength . The in-strength and out-strength in (4) below are extended from (2), respectively [20]:
where represents the sum of edge weights inbound to node i, while computes the sum of edge weights outbound from node i.
Intuitively, a node will be critical if a large number of shortest paths pass through the node. Therefore, betweenness Bi is proposed to measure the intermediality or bridge property of a node—the ability to transfer flows from one node to another [32]. The formulas in directed network are as follows:
where Njl is the number of shortest paths from node j to l; Njl(i) is the number of these shortest paths that pass through node i. CB(vi) is normalized to a range from 0 to 1.
Numerous real-world networks take the form of community structures, within which the connections between nodes are stronger than connections between nodes of different communities. In order to detect reasonable communities, Louvain algorithm is utilized [8, 33], which is based on modularity optimization. The notion of modularity evaluates the density of connections inside communities compared to connections between communities. In the case of weighted directed network, the modularity Q is defined as [8]:
where . The function δ(σi, σj) only yields 1 in case σi = σj, and 0 otherwise.
The procedure of Louvain algorithm is described as follows [33]:
Step 1, all nodes are assigned a different community. For each node i, we calculate the gain of modularity ΔQ when i is placed in its neighbors' communities. By comparing the ΔQ, one can detect the optimal community for node i. If ΔQ is maximum and positive, then node i is placed in the new community. Otherwise, i stays in its original community. The formula of ΔQ is as follows:
where stands for the sum of the weights of the links inside the new community, denotes the sum of weights of the links incident to all nodes in the new community, , si,in is the sum of the weights of the links from i to nodes in the new community.
Step 2, a new network is constructed whose nodes are now the communities found during the Step 1. In the new network, the weights of the links between nodes are given by the sum of the weights of the links between nodes in the corresponding two communities. We reapply Step 1 to the resulting weighted network.
Step 3, the above steps are iterated until the maximum Q is obtained.
The global remittance matrices are available from the World Bank1, containing 210 countries or regions of the world over the period from 2010 to 2016. The calculation of bilateral remittance is based on International Monetary Fund (IMF) Balance and Payments Statistics database as well as data released from central banks, national statistical agencies, and World Bank country desks [2].
The global remittance consists of 210 economies and their bilateral remittance flows. As far as the economies with low remittances are concerned, it is natural to categorize them as either low population countries or isolated regions, because they take low levels of participation in remittance system. The zero-value remittances of these economies make few contributions to the total remittance flow [28]. Thus, specific thresholds are set to filter out zero-value flows and ensure enormous remittance flows in the network. In order to identify a reasonable threshold, we analyze the magnitudes of all accumulated remittance flows.
Figure 1 shows the cumulative distribution of all accumulated remittance flows. One should focus on the significant changes of slope below and above 95th percentile of cumulative distribution [30], implying that sum of the top 1,200 edges plays an important role in the global remittance system. In order to highlight the significant remittance relationships among economies, we filter the original network with 210 nodes and 12,687 edges into a core network with 172 nodes and 1,200 edges by setting the 95th percentile as a threshold. Figure 2 shows the GRN before and after the filtering procedure. Note that some low population countries and isolated regions are removed from the GRN, including American Samoa, Aruba, Channel Islands and so on.
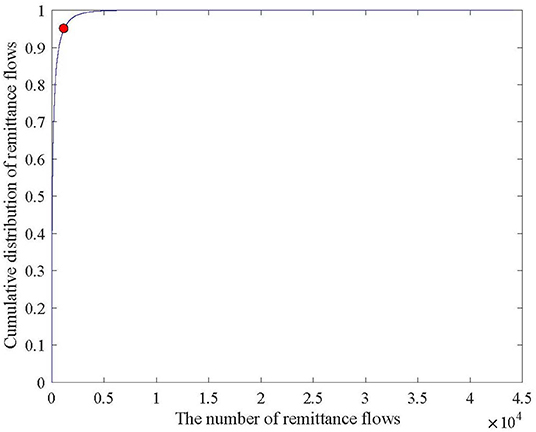
Figure 1. The cumulative distribution of remittance.
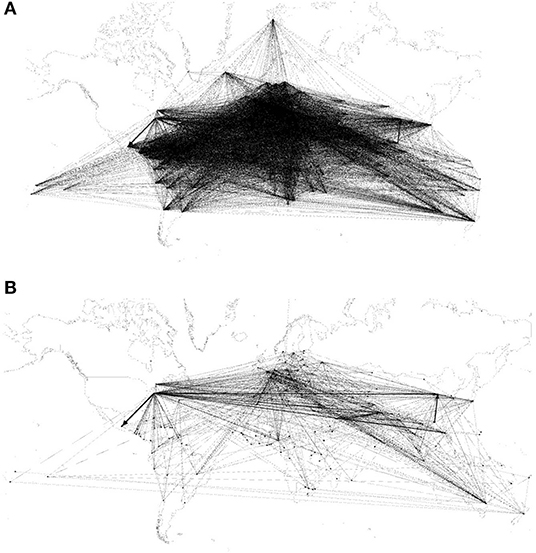
Figure 2. Global remittance network. (A) Before filtering. (B) After filtering.
Figure 3 displays the cumulative distribution of degree on log-log axes in the GRN. Intuitively, there exists a large number of low-degree nodes and a small number of high-degree nodes. Thus, the degree distribution is of asymmetry. To further identify the degree distribution, the method of maximum-likelihood and Kolmogorov-Smirnov (KS) test are applied.
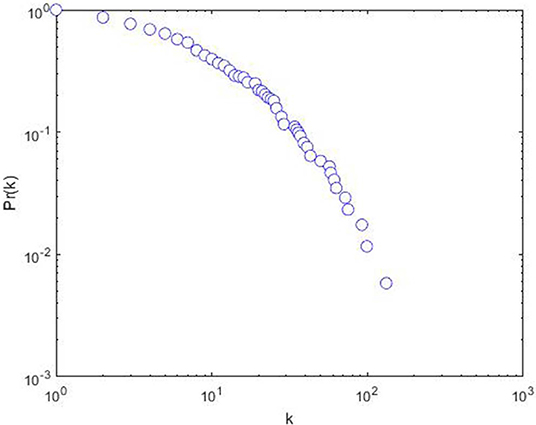
Figure 3. The cumulative distribution of degree on log-log axes.
Table 1 presents the results of goodness-of-fit for three common statistical distributions [34], i.e., exponential, log-normal and power law distribution. Note that P = 0.00 in the case of exponential distribution. Thus, the exponential distribution is ruled out. However, the P-values of log-normal and power law are equal to 0.23 and 0.38, respectively, indicating that the log-normal and power law distribution are not ruled out. Both log-normal and power law distribution are likely fits since they can exhibit a large number of low-degree nodes and few high-degree nodes [35]. It implies that a small number of core nodes play important roles in the GRN. This also provides a theoretical basis for our subsequent analysis of key nodes in section 4.2.2.
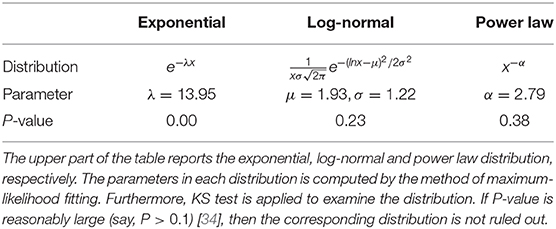
Table 1. The results of goodness-of-fit for degree distribution.
In order to identify key economies, centrality measures are employed to evaluate the importance of economies. Figure 4 shows top 15 key economies in terms of degree, node strength and betweenness centrality measures, respectively. Note that the rankings based on different network centrality measures are distinct from one another, indicating that various economies tend to play distinct roles in GRN. However, a number of key economies, such as the United States, France, the United Kingdom, Germany, Spain, Italy, China, Russian Federation and India, are always at the forefront of the top 15 key economies, highlighting their importance in the remittance system.
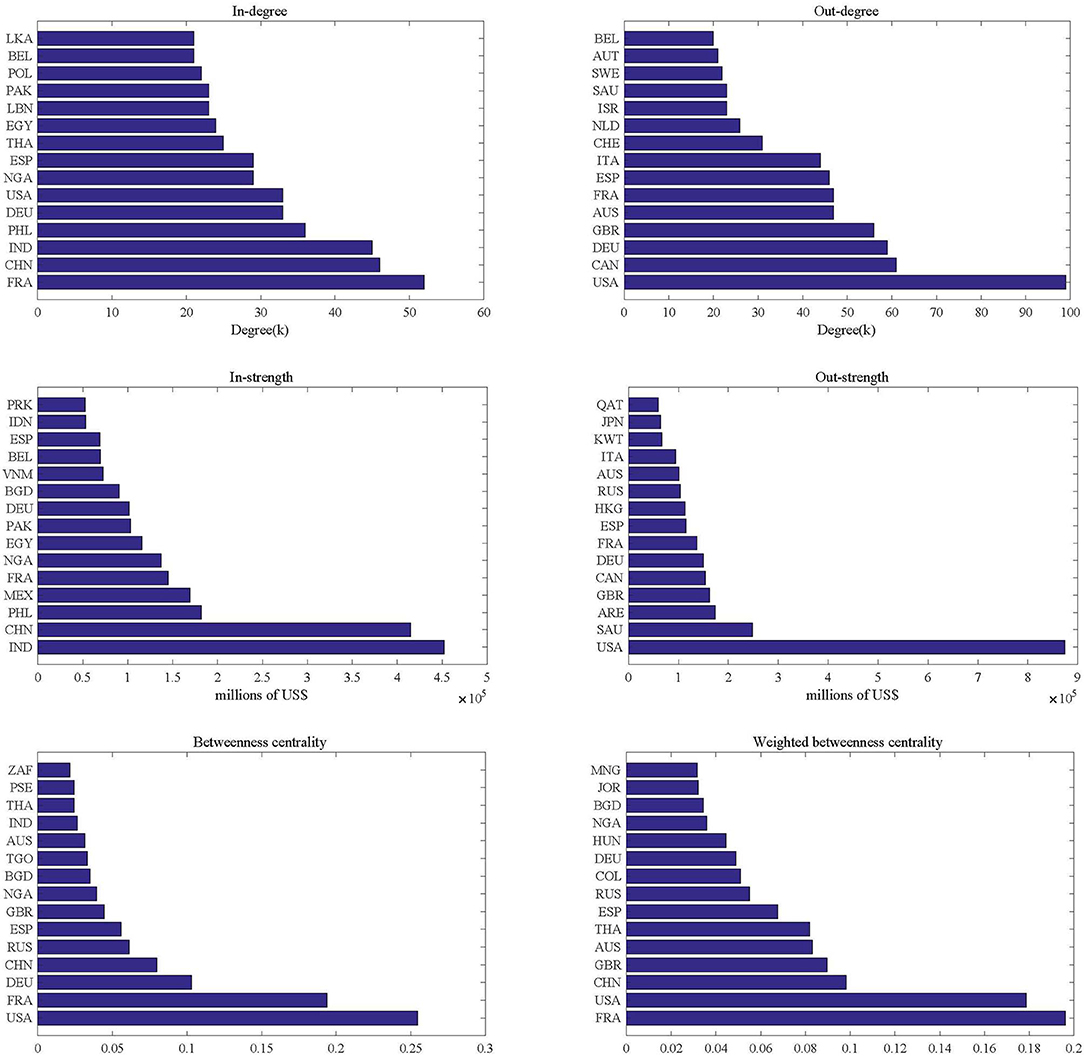
Figure 4. Top 15 important economies based on centrality measures.
For the out-degree and out-strength centrality case, the higher the economy's centrality is, the larger influence it possesses in the network. Note that the United States ranks first in both out-degree and out-strength centrality due to its economic power and immigration history. Further calculations show that US alone reimburses around 24.60% of total remittances to the rest of the world as payment, indicating that the country plays a significant role as a remittance supplier in GRN. In addition, affluent democracies and major oil and gas producing countries, such as Canada, the United Kingdom, Germany, France, Hong Kong (China), Japan, Saudi Arabia, United Arab Emirates and Kuwait, also become primary remittances suppliers.
In terms of in-degree and in-strength centrality, economies with high centrality are major remittance recipient countries, mainly including developing countries with considerable labor force like India, China, Philippines etc. A possible interpretation is that most of labor abundant countries reap up remittances by strategically converting abundant labor into capital [36]. In addition, developed countries like France, Germany, Belgium also obtain high rank of the centralities. The results do not come as surprises given that European Union (EU) citizens are allowed to move freely within the EU labor market. This leads to the fact that labor mobility in common market promotes the movement of remittances [37]. Thus, developed countries also become remittance recipient countries.
In addition to degree and node strength centrality, an economy's importance in the GRN can be evaluated by betweenness centrality, which measures the ability to transfer remittance flows from one economy to another. As shown in Figure 4, whether weighted or not, the betweenness centralities of the United States and France are significantly larger than those of other economies. Therefore, the United States and France play critical roles as bridge in the remittance system. There could be two possible explanations on the intermediary roles of the United States and France. On one hand, the United States is a nation of migrants, which has close cooperations with other economies in terms of remittance. On the other hand, there are many major corridors in remittance between France and its neighbor countries due to the geographical proximity2.
The detection of communities is very important as community structures often correspond to functional organizations [14, 33, 38]. In terms of the remittance network, communities not only uncover its regional structure features, but also provide insights for understanding the collaboration mechanism among economies in the same community. Figure 5 visualizes the regional community structure in GRN.
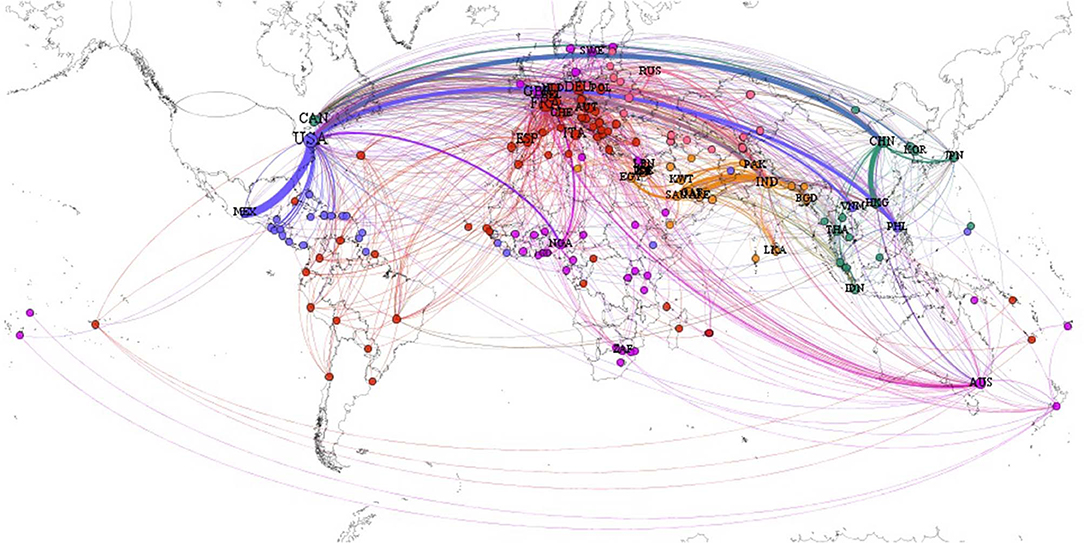
Figure 5. The regional community structure in GRN. Notes: The coloring of nodes and their linkages are the same for each community, i.e., red for C1, purple for C2, blue for C3, orange for C4, green for C5 and pink for C6. The size of a linkage corresponds to the magnitude of remittance flow.
As shown in Figure 5, the GRN is obviously divided into 6 communities where economies in the same community are labeled by a specific color. For each community, we present their major members and intra-remittances:
• C1 - The largest community, dominated by most of the economies in EU and South America, generates $ 6.35E+05 million intra-community remittances.
• C2 - The second-largest community, mainly consisting of Australia, the United Kingdom, the Nordic countries and Africa, contributes to $ 1.54E+05 million intra-community remittances.
• C3 - The third-largest community, led by the United States as well as Central America, transfers $ 4.46E+05 million intra-community remittances.
• C4 - The fourth-largest community, represented by the Middle East, possesses the largest intra-community remittances that is $ 6.47E+05 million.
• C5 - The fifth-largest community, locating in East Asia and Southeast Asia, holds $ 3.15E+05 million intra-community remittances.
• C6 - The smallest community, dominated by Eastern Europe, has $ 1.51E+05 million intra-community remittances.
It is interesting to note that economies in the same regional economy cooperative organizations tend to be included in the same community, such as EU and Latin American Integration Association (LAIA) in C1, Economic Community of West African States (ECOWAS) in C2, members of Central American Free-Trade Agreement(CAFTA) in C3, Gulf Cooperation Council Countries (GCC) in C4, Association of Southeast Asian Nations(ASEAN) in C5 and Eurasian Economic Union (EAEU) in C6. Thus, the community structure of the GRN appears to have significant correlations with geographical and economic factors. A possible interpretation is that labor mobility in regional cooperative organizations promotes the movement of remittances. Additionally, further calculations show that the intra-community remittances of C1–C6 account for 66.07% of total remittances in GRN, highlighting the regional integration of the GRN.
Figure 6 describes the intra-community and inter-community remittance flows. As Figure 6 shows, the economies belonging to the same community form sub-units with close remittance relationships. However, economies not only participate in remitting within the same community, but also engage themselves into the inter-community transfers, which account for 33.93 % of total remittances.
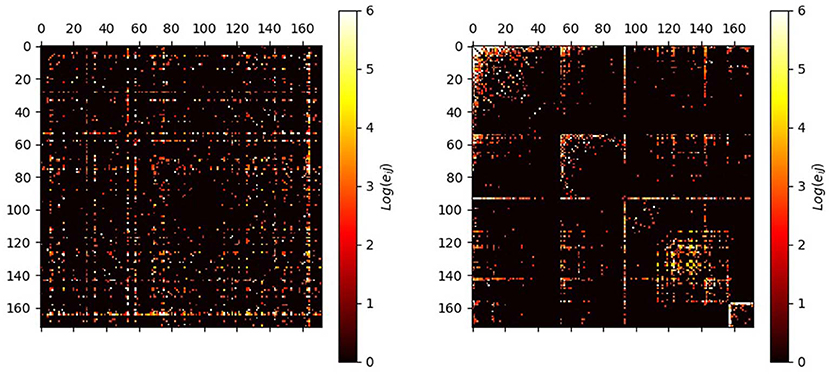
Figure 6. Remittance matrix before and after permutation based on community structure.
Remittance system may have some extreme risks such as migration or remittance restriction, to which corresponds node and edge removal in GRN. Such removal will affect the stability of GRN and the normal operation of the system. The approaches employed in robustness test of networks are usually node attack method, which removes some nodes and all edges connected to them from the network [39]. There are two kinds of node attack method: one is stochastic removal method and the other is selective removal method. The former removes some nodes from the network in a random manner, while the latter removes the nodes in a special order. If the structural properties, such as connectivity, have no significant difference after the attack, it is natural to define that the network is robust. Since the maximum strongly connected component(maximum SCC) size measures the connectivity of a directed network, we evaluate topological stability by calculating the ratio w of the maximum SCC size of the new network to that of the original network.
Figure 7 displays the topological stability test of the GRN. As shown in Figure 7, no matter for the selective removal or stochastic removal, when the first nodes are removed, w < 0.64, implying that network connectivity drops rapidly under these two kinds of node attack methods. However, the impact of selective removal on connectivity is larger than that of stochastic removal. The same phenomenon can also be found at the aggregate level. Note that after a number of nodes removal, the impact of selective removal on the network is significantly larger than that of stochastic removal. Furthermore, in comparing the stochastic removal methods, the connectivity of the network under betweenness (weighted betweenness) centrality-based attack is lower than that under out-degree(out-strength)-based attack. This indicates that selective attacks on the nodes with high betweenness (weighted betweenness) centrality are much more effective in the GRN. Therefore, in order to avoid the connectivity collapse of the remittance system, policy makers should pay more attention to major transshipment nodes.
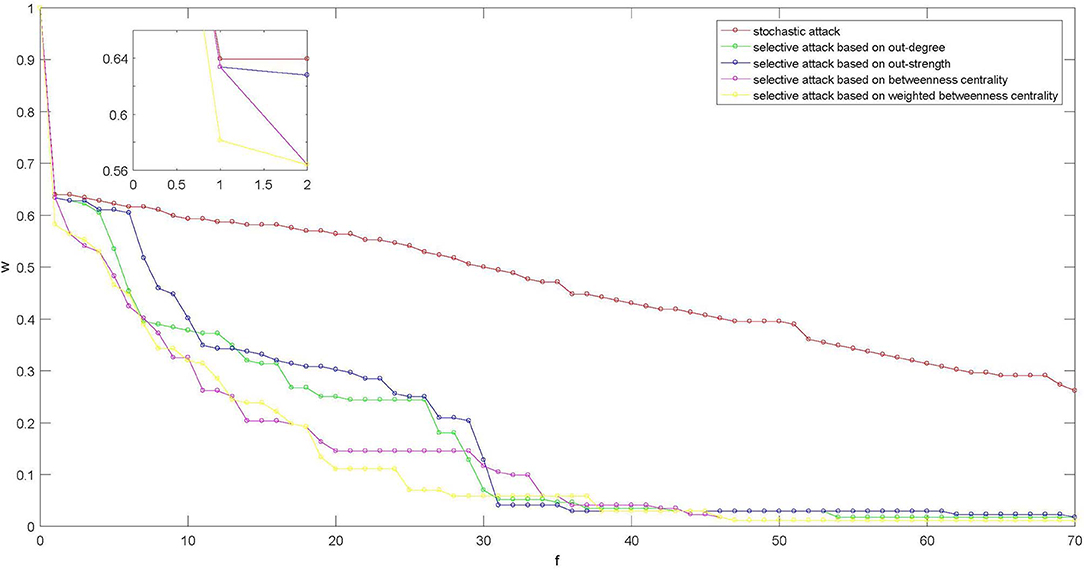
Figure 7. The maximum SCC size of the GRN. Notes: f is the number of removal nodes. The selective removal removes nodes in decreasing order of their centrality.
To a large extent, the existing literature on the analysis of key economies for global remittance predominantly focuses on the influential remittance suppliers and recipients as well as circular patterns between economy pair. Literature dealing with the intermediary roles of the key economies, community structure and topological stability of remittance network seems to be scarce; such studies are however significant for us to understand the local properties as well as the global properties of the remittance network.
In this paper, by employing complex network approach, we present a detailed discussion of key economies for global remittance, and the findings can be summarized as follows: (i) the degree distribution is of heterogeneity, suggesting that GRN is a heterogeneous network; (ii) some key economies, such as the United States, France, India and China, are always at the forefront of centrality measures; (iii) 6 communities are detected, where economies in the same regional economy cooperative organizations tend to be classified in the same community; (iv) 66.07% of total remittances belongs to intra-community flows, indicating that economies present the characteristic of regionalization; (v) GRN is fragile to node removal, particular the selective removal based on betweenness centrality.
Although this paper builds a global remittance network and investigates its key economies, there are still some topics worth further studying. For example, economies play different roles in the network due to its heterogeneity. The positions of economies in the network might have an impact on remittance flows. Thus, it is worth further studying the relationship between remittance flows and economies' positions. This will be our future study.
Publicly available datasets were analyzed in this study. This data can be found here: https://www.worldbank.org/en/topic/migrationremittancesdiasporaissues/brief/migration-remittances-data.
SW and CH: conceptualization and project administration. SW: methodology, formal analysis, resources, and data curation. YT: software, investigation, and visualization. ML and YD: validation. SW, CH, and YD: writing-original draft preparation. YD: writing-review and editing. CH: supervision. SW, CH, and ML: funding acquisition.
Partially supported by the National Natural Science Foundation of P. R. China (Nos. 11971076, 71471020), Hunan Provincial Natural Science Foundation (No. 2019JJ50650), Scientific Research Fund of Hunan Provincial Education Department (No. 18C0221), and Innovation Fund Designated for Graduate Students of Hunan Province (No. CX2018B571).
The authors declare that the research was conducted in the absence of any commercial or financial relationships that could be construed as a potential conflict of interest.
The authors are extremely grateful to three reviewers and the editor for their valuable comments and suggestions, which have contributed a lot to the improved presentation of this paper.
1. ^Bilateral remittance flows worldwide associated with this paper can be found at https://www.worldbank.org/en/topic/migrationremittancesdiasporaissues/brief/migration-remittances-data.
2. ^It is supported by Eurostat statistics explained, which can be found at http://ec.europa.eu/eurostat/statistics-explained/index.php/Personal_remittances_statistics.
1. Bettin G, Lucchetti R, Pigini C. A dynamic double hurdle model for remittances: evidence from Germany. Econ Model. (2018) 73:365–77. doi: 10.1016/j.econmod.2018.04.012
2. Group WB. Migration and Remittances: Recent Developments and Outlook-Transit Migration. Washington, DC: The World Bank (2018).
3. Huang C, Cao J, Wen F, Yang X. Stability analysis of SIR model with distributed delay on complex networks. PLoS ONE. (2016) 11:e0158813. doi: 10.1371/journal.pone.0158813
4. Hu H, Yuan X, Huang L, Huang C. Global dynamics of an SIRS model with demographics and transfer from infectious to susceptible on heterogeneous networks. Math Biosci Eng. (2019) 16:5729–49. doi: 10.3934/mbe.2019286
5. Gong X, Lin B. Time-varying effects of oil supply and demand shocks on China's macro-economy. Energy. (2018) 149:424–37. doi: 10.1016/j.energy.2018.02.035
6. Song DM, Jiang ZQ, Zhou WX. Statistical properties of world investment networks. Phys A Stat Mech Appl. (2009) 388:2450–60. doi: 10.1016/j.physa.2009.03.004
7. Dai YH, Xie WJ, Jiang ZQ, Jiang GJ, Zhou WX. Correlation structure and principal components in the global crude oil market. Empiric Econ. (2016) 51:1501–19. doi: 10.1007/s00181-015-1057-1
8. Davis KF, D'Odorico P, Laio F, Ridolfi L. Global spatio-temporal patterns in human migration: a complex network perspective. PLoS ONE. (2013) 8:e53723. doi: 10.1371/journal.pone.0053723
9. Fagiolo G, Mastrorillo M. Does human migration affect international trade? A complex-network perspective. PLoS ONE. (2014) 9:e97331. doi: 10.1371/journal.pone.0097331
10. Li M, Xiao Q, Wang Y, Zhou W. Statistical properties of the mutual transfer network among global football clubs. Int J Mod Phys B. (2018) 32:1850320. doi: 10.1142/S0217979218503204
11. Huang C, Zhang H, Cao J, Hu H. Stability and Hopf bifurcation of a delayed prey-predator model with disease in the predator. Int J Bifurcat Chaos. (2019) 29:1950091. doi: 10.1142/S0218127419500913
12. Huang C, Su R, Cao J, Xiao S. Asymptotically stable high-order neutral cellular neural networks with proportional delays and D operators. Math Comput Simulat. (2020) 171:127–35. doi: 10.1016/j.matcom.2019.06.001
13. Kitsak M, Gallos LK, Havlin S, Liljeros F, Muchnik L, Stanley HE, et al. Identification of influential spreaders in complex networks. Nat Phys. (2010) 6:888–93. doi: 10.1038/nphys1746
14. Albert SR, Clara G, Sergio G, Alex A. Information transfer in community structured multiplex networks. Front Phys. (2015) 3:61. doi: 10.3389/fphy.2015.00061
15. Iztok F, Iztok F, Matjavz P. Toward the discovery of citation cartels in citation networks. Front Phys. (2016) 4:49. doi: 10.3389/fphy.2016.00049
16. Dai Z, Wen F. Some improved sparse and stable portfolio optimization problems. Finan Res Lett. (2018) 27:46–52. doi: 10.1016/j.frl.2018.02.026
17. Dai Z, Wang F. Sparse and robust mean-variance portfolio optimization problems. Phys A Stat Mech Appl. (2019) 523:1371–8. doi: 10.1016/j.physa.2019.04.151
18. Lu Q, Gu C, Qin X, Yang H, Wu G. State network approach to characteristics of financial crises. Phys A Stat Mech Appl. (2018) 492:1120–8. doi: 10.1016/j.physa.2017.11.042
19. Majapa M, Gossel SJ. Topology of the South African stock market network across the 2008 financial crisis. Phys A Stat Mech Appl. (2016) 445:35–47. doi: 10.1016/j.physa.2015.10.108
20. Han R, Li M, Chen W, Zhou W, Stanley HE. Structural properties of statistically validated empirical information networks. Phys A Stat Mech Appl. (2019) 523:747–56. doi: 10.1016/j.physa.2019.03.010
21. Wen F, Ye Z, Yang H, Li K. Exploring the rebound effect from the perspective of household: an analysis of China's provincial level. Energy Econ. (2018) 75:345–56. doi: 10.1016/j.eneco.2018.08.018
22. Wen F, Zhao C, Hu C. Time-varying effects of international copper price shocks on China's producer price index. Resour Policy. (2019) 62:507–14. doi: 10.1016/j.resourpol.2018.10.006
23. Wen F, Yang X, Zhou W. Tail dependence networks of global stock markets. Int J Finan Econ. (2019) 24:558–67. doi: 10.1002/ijfe.1679
24. Yang X, Wen S, Zhao X, Huang C. Systemic importance of financial institutions: a complex network perspective. Phys A Stat Mech Appl. (2019) 545:123448. doi: 10.1016/j.physa.2019.123448
25. Xie W, Li M, Xu H, Chen W, Zhou W, Stanley HE. Quantifying immediate price impact of trades based on the k-shell decomposition of stock trading networks. Europhys Lett. (2016) 116:28006. doi: 10.1209/0295-5075/116/28006
26. Gong X, Wen F, Xia XH, Huang J, Pan B. Investigating the risk-return trade-off for crude oil futures using high-frequency data. Appl Energy. (2017) 196:152–61. doi: 10.1016/j.apenergy.2016.11.112
27. Wen F, Xu L, Ouyang G, Kou G. Retail investor attention and stock price crash risk: evidence from China. Int Rev Finan Anal. (2019) 65:101376. doi: 10.1016/j.irfa.2019.101376
28. Lillo F, García L, Santander V. Dynamics of global remittances: a graph-based analysis. Math Soc Sci. (2017) 87:64–71. doi: 10.1016/j.mathsocsci.2017.02.005
29. Lillo F, Garay JAM. The global remittance network: an inflow and outflow analysis. J Math Sociol. (2019) 43:59–75. doi: 10.1080/0022250X.2018.1496917
30. Chen B, Li JS, Wu XF, Han MY, Zeng L, Li Z, et al. Global energy flows embodied in international trade: a combination of environmentally extended input-output analysis and complex network analysis. Appl Energy. (2018) 210:98–107. doi: 10.1016/j.apenergy.2017.10.113
31. Yang X, Wen S, Liu Z, Li C, Huang C. Dynamic properties of foreign exchange complex network. Mathematics. (2019) 7:832. doi: 10.3390/math7090832
32. Opsahl T, Agneessens F, Skvoretz J. Node centrality in weighted networks: generalizing degree and shortest paths. Soc Netw. (2010) 32:245–51. doi: 10.1016/j.socnet.2010.03.006
33. Blondel VD, Guillaume JL, Lambiotte R, Lefebvre E. Fast unfolding of communities in large networks. J Stat Mech. (2008) 2008:155–68. doi: 10.1088/1742-5468/2008/10/P10008
34. Clauset A, Shalizi CR, Newman MEJ. Power-law distributions in empirical data. SIAM Rev. (2009) 51:661–703. doi: 10.1137/070710111
35. Broido AD, Clauset A. Scale-free networks are rare. Nat Commun. (2019) 10:1017. doi: 10.1038/s41467-019-08746-5
36. Mamun MA, Sohag K, Uddin GS, Shahbaz M. Remittance and domestic labor productivity: evidence from remittance recipient countries. Econ Model. (2015) 47:207–18. doi: 10.1016/j.econmod.2015.02.024
37. Javorcik BS, Özden Ç, Spatareanu M, Neagu C. Migrant networks and foreign direct investment. J Dev Econ. (2011) 94:231–41. doi: 10.1016/j.jdeveco.2010.01.012
38. Guimera R, Amaral L. Functional cartography of complex metabolic networks. Nature. (2005) 433:895–900. doi: 10.1038/nature03288
Keywords: remittance flow, complex network, degree distribution, key economies, community structure
Citation: Wen S, Tan Y, Li M, Deng Y and Huang C (2020) Analysis of Global Remittance Based on Complex Networks. Front. Phys. 8:85. doi: 10.3389/fphy.2020.00085
Received: 23 November 2019; Accepted: 10 March 2020;
Published: 02 April 2020.
Edited by:
Wei-Xing Zhou, East China University of Science and Technology, ChinaReviewed by:
Chengyi Xia, Tianjin University of Technology, ChinaCopyright © 2020 Wen, Tan, Li, Deng and Huang. This is an open-access article distributed under the terms of the Creative Commons Attribution License (CC BY). The use, distribution or reproduction in other forums is permitted, provided the original author(s) and the copyright owner(s) are credited and that the original publication in this journal is cited, in accordance with accepted academic practice. No use, distribution or reproduction is permitted which does not comply with these terms.
*Correspondence: Chuangxia Huang, Y3hpYWh1YW5nQGFtc3MuYWMuY24=
Disclaimer: All claims expressed in this article are solely those of the authors and do not necessarily represent those of their affiliated organizations, or those of the publisher, the editors and the reviewers. Any product that may be evaluated in this article or claim that may be made by its manufacturer is not guaranteed or endorsed by the publisher.
Research integrity at Frontiers
Learn more about the work of our research integrity team to safeguard the quality of each article we publish.