- College of Control Science and Engineering, China University of Petroleum, Qingdao, China
A near-infrared trace CO2 detection system was experimentally demonstrated based on an 1,580 nm distributed feedback (DFB) laser using a cascaded integrator comb (CIC) filter-assisted wavelength modulation spectroscopy (WMS) technique and a digital lock-in amplifier (DLIA). An 1,580 nm DFB laser emitting at 1,579.1 nm was selected as the light source. A multi-pass cell (MPGC with a 30 m- long path) was adopted as the absorption cell. A DLIA was developed to extract the second harmonic WMS (WMS-2f) signal. The cascade-integrated comb filter (CICF) and the finite impulse response (FIR) low-pass filter (LPF) were combined in the DLIA to improve the performance of DLIA. Three methods of PD (Peak detection), LIA, CICF-assisted WMS, and DLIA were adopted to detect the CO2 concentration levels and the anti-interference performance of each detection method was analyzed. The experimental results indicated that compared with the peak detection and the lock-in amplifier method of the CICF-assisted WMS and DLIA developed in this manuscript had the highest linearity and precision. When the integration time is 3s, the LOD of the system was predicted to be 0.0812 ppm. Due to the advantages of high sensitivity, a low detection limit and a rapid response, the CO2 detection system reported in this manuscript has a good application prospect in the area of oilfield associated gases detection.
Introduction
Oilfield associated gases is an important resource. It contains a variety of gas components, including not only high concentration of methane and ethane, but also trace gases of CO2 and H2O. If oilfield associated gases is directly discharged, it will not only cause serious environmental pollution, but also waste energy. However, the existence of trace carbon dioxide and water vapor will generate an acid, which creates great difficulties for the processing and utilization of oilfield associated gases. Therefore, a DFB laser using a CICF -assisted wavelength modulation technique and a digital lock-in amplifier (DLIA) for the accurate and real-time detection of the concentration of trace impurity gases in oilfield associated gases is of great significance.
Traditional gas detection technologies mainly include electrochemical method, gas chromatography, and chemical analysis. These methods generally have the disadvantage of high cost and low sensitivity. Spectral techniques have gradually become an important research method or gas detection due to rapid development of optoelectronics. Spectral techniques mainly include Differential Optical Absorption Spectroscopy (DOAS), Fourier Transform Infrared Spectroscopy (FTIR), Differential Absorption Lidar (DIAL), and Tunable Diode Laser Absorption Spectroscopy (TDLAS). Among those, TDLAS technology plays an important role due to its high accuracy, stability, anti-interference, and environmental adaptability [1].
Wavelength modulation spectroscopy (WMS) technology is widely used for trace-gas detection because it can effectively suppress the background noise and interference fringes [2]. In this manuscript, the WMS with the first harmonic normalized second harmonic detection (2f/1f) was adopted for CO2 detection. This analytical method can isolate complex, overlapping spectral absorption features at ambient pressures and achieve high detection sensitivity [3–6]. After photoelectric conversion and signal amplification, an analog-to-digital conversion occurs. The first harmonic WMS (WMS-1f) signal and the second harmonic WMS (WMS-2f) signal are extracted by the DLIA [7] and the concentration is derived based the normalized WMS-2f. The low-pass filter (LPF) in the DLIA has the function of filtering out the high frequency components in the signal, which determined the denoising performance of the DLIA [8–12]. In order to reduce the order of filter and improve the performance of denoising, a cascaded integrator–comb filter assisted wavelength modulation technique which was combined with DLIA is developed in this manuscript for the realization of CO2 gas detection in oilfield associated gases.
CO2 Absorption Spectroscopy
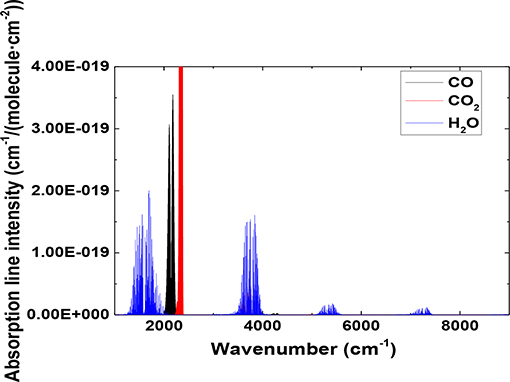
The CO2 molecule has two absorption bands in the infrared spectrum, which are the fundamental band at 4.2 μm and the combination band at 2.7 μm. The spectral data of the CO2 molecule was derived from the HITRAN2016 database. The JavaHAWKS simulation software was used to plot the CO2 and CO molecules in the 1 ~ 10 μm absorption band. Figure 1 showed the absorption intensity in the fundamental absorption band compared to the absorption band of the combination absorption band. The absorption intensity at the fundamental absorption band was~ three orders of magnitude higher than that of the combination absorption band. But a near infrared ray (NIR) DFB laser was commercially less costly and more reliable than a middle infrared ray (MIR) laser.
The absorption spectrum of the R branch of CO and CO2 gas is shown in Figure 2. The R(7) line is located at a wavelength of 1, 579.1 nm and its absorption intensity is 1.56 ×10⁻⁶cm−1/(molecule·cm−2), which is a strong absorption line in the R-band spectrum, where there are less interference exists caused by other gas absorption lines. DFB lasers in this wavelength region are commonly used in optical communication with a low price and mature fabrication. Therefore, an 1.580 μm DFB laser was selected for the detection system and combined with a long pathlength absorption cell in order to achieve the desired CO2 detection sensitivity.
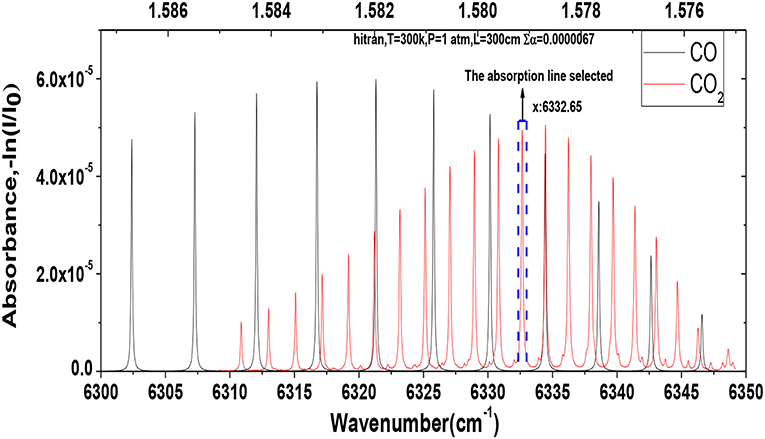
Figure 2. The simulated absorption lines of CO2 and CO at room temperature and atmospheric pressure in the region of 6,300 to 6,350 cm−1.
Cascaded Integrator Comb (CIC) Filter-Assisted Wavelength-Modulation Technique
The wavelength modulation spectroscopy (WMS) can improve the signal-to-noise ratio and suppress the background noise. In the WMS scheme, a hybrid signal is applied to the DFB laser driver, which is composed of a low frequency sawtooth wave scanning signal and a high frequency sinusoidal modulation signal. In order to obtain the optimized WMS signals, we performed a theoretical simulation according to principle of WMS and carried out the experimental test in the laboratory to obtain the optimized parameters of frequency, amplification factor, phase, and baseline of the modulated signal [13–15]. A scanning frequency (5 Hz) of the sawtooth wave tuning signal was used in this system and the modulation frequency of sinusoidal modulation signal was 7.8 kHz. DLIA was used to demodulate the modulated signal absorbed by the CO2 gas to further calculate the CO2. The cascade-integrated comb filter (CICF) and the FIR low-pass filter were combined in the lock-in amplifier to perform primary filtering and secondary filtering, respectively. The CIC filter structure had a superior performance and requires no multiplication operation in the implementation. The operation rate was increased relative to other filters and the filter order could be lowered [16]. The CIC decimation filter mainly included three parts: an integrator, a decimator and a comb filter.
The unit impulse response h(n) was given by
where D is the decimation factor of the decimator and M is the delay factor of the comb filter. In general, M = 1, and the filtering order of the CIC decimation filter was equal to the decimation factor. Therefore, the filter output y(n) and the input x(n) satisfied the Equation (2)
The system function of the CIC decimation filter was
H1(Z) is the system function of the integrator and H2(Z) is the system function of the comb filter. Therefore, the equation of state for a single-stage integrator is
The equation of state for a single-stage comb filter can be expressed as
The down-conversion module of the CIC decimation filter was implemented by a decimator. If the frequency of the input signal can be denoted as f , the frequency of signal which passed through the decimator can be denoted asf/D. With the increase of the decimation D, the computational complexity decreased gradually. If the system is linear, the method that is sent to the decimator behind the integrator can improve the system efficiency. The structure of the CIC filter is shown in Figure 3.
Detection Structure and Key Module Performance
Structure and Configuration
The structure of the CO2 gas detection system is shown in Figure 4, which consisted of four processes: such as a current drive, laser processing, gas detection, and a data processing module.
(i) Current drive. A sinusoidal signal was added to the sawtooth wave to produce a composite signal which acted as the driving signal of the DFB laser [17–19]. In this manuscript, the 1,580 nm tunable diode laser (Serial number SN15060405, provided by the Wuhan sensor, LTD) was chosen as the light source. The commercial laser diode controller (LDC210C, Thorlabs Inc) and a temperature controller (TED200C, Thorlabs Inc) were modified to set the working conditions for wavelength tuning of the DFB laser.
(ii) Laser processing. The light emitted by the DFB laser passed through the beam splitter (BSW23, Thorlabs Inc) and was divided into two beams. One beam entered into the multi-pass gas cell (MPGC with a 30 m-long path, manufactured by Xuzhou Xuhai Optoelectronic Technology Co. LTD) as a measurement chamber directly and the other beam passed through the optical attenuator which entered into the gas cell 2 as a reference chamber.
(iii) Gas detection. The light beam that had not passed through the optical attenuator entered the gas cell 1 of the real-time measurement channel, and the other light beam entered the gas cell 2 of with a fixed gas concentration as a reference channel. The two output beams reached two InGaAs avalanche photodiode detectors (Light Sensing, model LSIAPD-50), and then the detection signal and the reference signal are generated, respectively.
(iv) Data processing (Signal processing). The two signals detected were pre-amplified separately, passed through a LPF, and then entered the lock-in amplifier. The output signals were collected and returned by the Analog-to-digital converter (ADC).
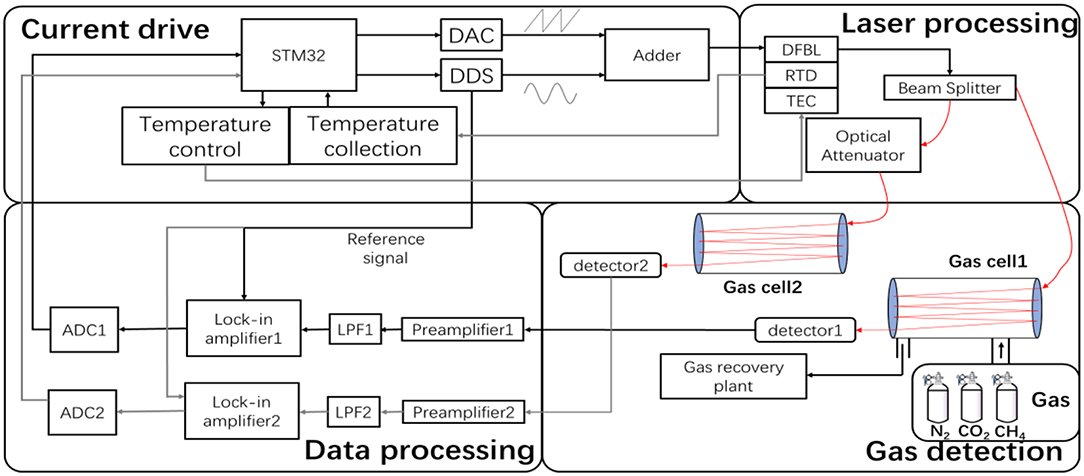
Figure 4. Structure of the CO2 gas detection system. The red line represents a single mode fiber. The black line and the gray line represent the electrical path.
DFB Laser Characterization
The wavelength vs. temperature and current tuning characteristics were measured and is shown in Figure 5. Under a laser operating temperature of 25°C, when the driving current of the laser increased in the range of 56–68 mA, the output wavelength of the laser increases gradually as shown in Figure 5A. The current tuning coefficient was 0.015 nm/mA. For a stable driving current of 60 mA, the emitting peak wavelength increases with an increase of temperature as shown in Figure 5B. When the temperature increased by 1°C, the emitting peak wavelength increased by 0.105 nm. Therefore, the temperature tuning coefficient was 0.105 nm/°C.
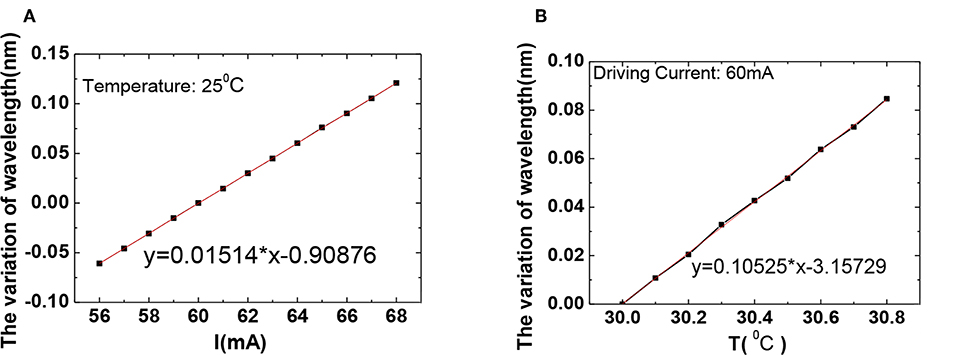
Figure 5. (A) Curve of emitting peak wavelength vs. driving current, where the operation temperature is set to be 25°C. (B) Curve of emitting peak wavelength vs. temperature, where the driving current is set to be 60 mA.
Based on the laser tuning characteristics, the output wavelength can be precisely adjusted by changing the driving current at a fixed temperature. In order to satisfy the design requirements of the system, the output center wavelength of the laser was aligned with the center wavelength of the CO2 absorption line. Finally, a laser operation temperature of 25°C and operation current of 57.8 mA were used for CO2 concentration measurements at the interference-free absorption line of 6336.2382 cm−1.
Digital Lock-in Amplifier
The lock-in amplifier was designed to extract a specific frequency signal from a large interference environment. The core of the module is a phase sensitive detector [20]. The structure of the DLIA is shown in Figure 6.
Various frequencies signals are embedded in the differential signal and only the signal with the same frequency as the reference signal can be extracted. The signal was cross-correlated with the reference signal. After passing through the LPF in the DLIA, the amplitude of the signal was positively correlated with the converted DC signal [21]. The components of other frequencies were filtered out by the LPF, because they were converted into AC signals whose frequency was beyond the filter cut off frequency. The phase sensitive detector was a multiplier that multiplies the measured signal by a reference signal. The differential signal and the reference signal were fed into the phase sensitive detector. The harmonic signal was extracted by a CIC filter and LPF in this DLIA. The reference signal was generated by the direct digital frequency synthesizer (DDS) controlled by the STM32 device.
The common mode component can be effectively suppressed by its differential structure via the two-channel detection method. The differential signal to the DLIA has eliminated many common mode interferences from this detection system. The difference signal S(t) = Asin(ω1t + Δϕ) + N(t), the reference signal R1(t) = Bsin(ω2t), and the orthogonal reference signal R2(t) = Bcos(ω2t) that is obtained by shifting the phase of the reference signal by 90 degrees. The sinusoidal part Asin(ω1t + Δϕ) of the differential signal expression indicated a useful signal that could be extracted, where A is the amplitude and N(t) is the noise signal, B is the amplitude of the two reference signals. In general, the expression of the reference signal is known and Δϕ is the phase difference between the differential signal and the reference signal.
After the multiplication, the output was given by:
When two signals were at the same frequency (ω1 = ω2):
After the low pass filter, the output of the two orthogonal signals was obtained:
By an orthogonal operation, the amplitude and phase of the differential signal can be obtained:
Similarly, when the two signal frequency satisfied the condition ω1 = 2ω2, the WMS-2f signal can be demodulated. Compared with the ordinary lock-in amplifier (LIA), the orthogonal DLIA in this manuscript doesn't depend on the phase difference between reference and detected signal and therefore it requires no phase tuning to optimize the signal amplitude, which brings great advantages for signal processing.
Experiments and results
In this experiment, the operating temperature of the 1,580 nm DFB laser (Serial number SN15060405, provided by the Wuhan sensor, LTD) was set to be 25°C and the driving current was set to be 57.8 mA, for which the emitting peak wavelength is near 1,579 nm by using a commercial laser diode controller (LDC210C, Thorlabs Inc) and a temperature controller (TED200C, Thorlabs Inc). The InGaAs avalanche photodiode detector (Light Sensing, model LSIAPD-50) was selected for photoelectric conversion. The volume of the multi-pass gas cell (MPGC with a 30 m-long path, manufactured by Xuzhou Xuhai Optoelectronic Technology Co. LTD) is 500 ml. Different levels of CO2 concentration were generated through mixing of pure CO2 and pure N2 in the self-designed gas mixing station.
Comparison of Three Test Methods
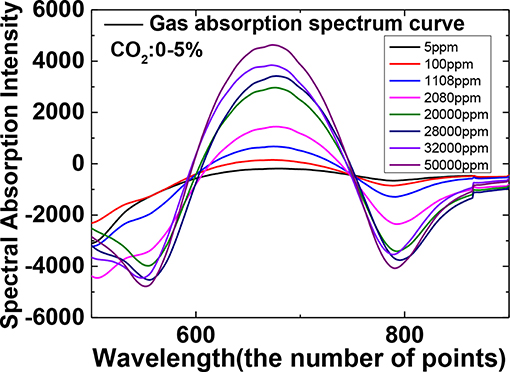
The concentration of CO2 was randomly changed in the range of 0–5%. In the calibration process the WMS-2f amplitudes were recorded for 12 min at each concentration level to maintain a stable mixing. The WMS-2f waveforms corresponding to the related CO2 concentrations are shown in Figure 7.
In the CO2 measurement system, three weak signal processing technologies were adopted in this manuscript, namely peak detection (PD), a lock-in amplifier (LIA) and a CICF-assisted WMS and a DLIA, respectively. The gas absorption spectra of 10% CO2 concentration were used as the reference spectra in the CO2 measurement system. In the system of these three methods, the data algorithms all adopted a partial least squares regression algorithm and adopted the method of 5-fold cross-validation in order to perform a regression prediction on the data that were collected using these three methods. The comparative analysis of CO2 in the 0–5% range for three test methods is shown in Figure 8. The CO2 concentration data of 19 groups were obtained by random mixing ratios with N2 gas and the measured values obtained by the three methods were compared with the set values. It could be found that the measurement error of PD method was significantly larger than that of the other two methods. Compared with the peak detection and the lock-in amplifier, the method of CICF-assisted WMS and DLIA developed in this manuscript had the better linearity and accuracy than the other two methods.
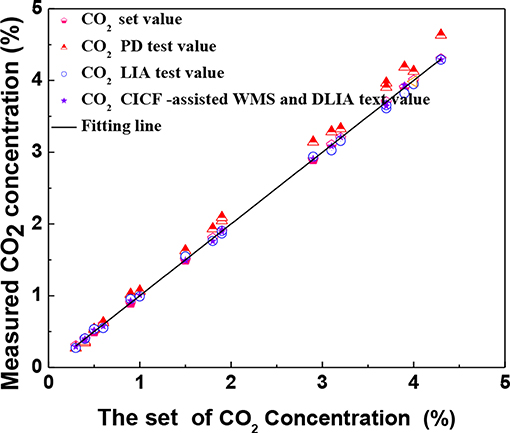
Figure 8. A linear comparison diagram of the set value of CO2 concentration and the values measured by the three methods (PD, LIA, CICF-assisted WMS, and DLIA).
To further compare the measurement errors of the three methods, the relative errors of the 19 groups of data were plotted in Figure 9. The relative error of PD in CO2 was <0.14, the relative error of LIA in CO2 was <0.1 and the error of CICF-assisted WMS and DLIA and DLIA in CO2 was <0.06.By comparing the errors, the last test method has a smaller error and a better performance.
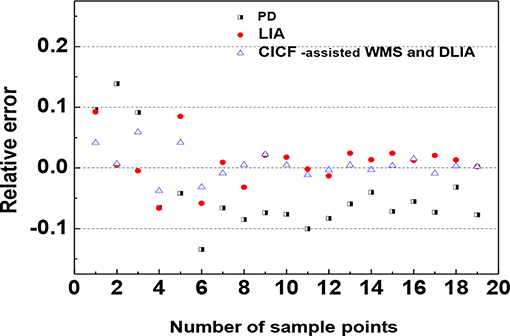
Figure 9. The comparison of the relative errors of the CO2 concentration measured by the three methods (PD, LIA, CICF-assisted WMS, and DLIA).
Background Gas Influence on Experiment
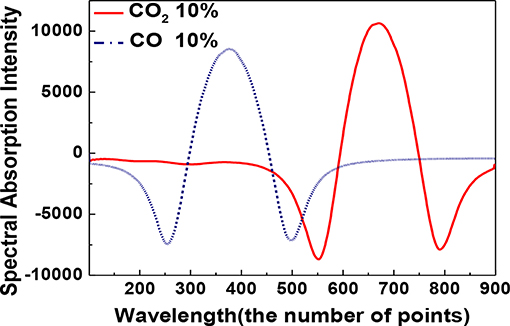
The absorption spectral of CO and CO2 provided by the HITRAN database are shown in Figure 2. From the plot, the CO and CO2 absorption lines are very close. For verification, the modulated absorption spectra of 10% CO and 10% CO2 were collected in the experiment as shown in Figure 10, which is consistent with the spectrum characteristics provided by the HITRAN database. In order to minimize the influence of CO absorption line on a CO2 measurement, the single absorption line located at 1,579.1 nm was selected for the detection of CO2, where less interference existed caused by adjacent CO gas absorption lines.
However, the absorption spectrum of CO2 and CO molecule near 1,580 nm is close. In order to verify the influence of the change of the background CO concentration on the measurement of the CO2 concentration, a thorough performance of the instrument was carried out. Even if there was a strong external interference, the detection system can still meet the requirements of detection accuracy. In the experiment design, the concentration of a target component to be measured was fixed and the concentration of the background component was changed as the background interference. Three methods were adopted to detect the concentration of the target component and the anti-interference performance of each detection method was analyzed. The concentration of fixed CO2 in this experiment was 1% and the background gas CO concentration was varied at 0, 0.5, 1, 4%. Three methods were used to separately estimate the fixed concentration of CO2, when CO concentration changed at 0, 0.5, 1, 4%. The results obtained are shown in Figure 11. The relative errors of these three methods (PD, LIA, CICF-assisted WMS, and DLIA) in measuring CO2 concentration of 1% are <11, 5.5, and 1.9%, respectively. Obviously, this method of CICF-assisted WMS and DLIA described in this manuscript had the highest detection accuracy.
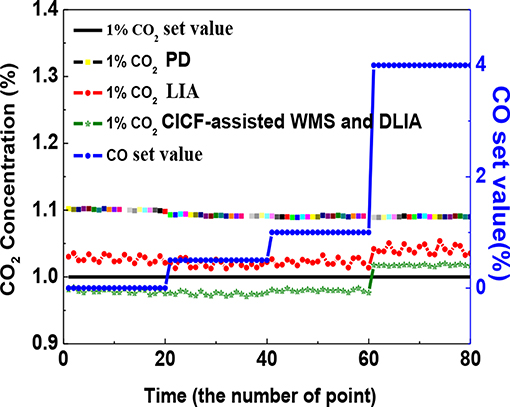
Figure 11. When the CO concentration changes by 0, 0.5, 1, and 4%, the detection results of CO2 with 1% concentration were compared by using three methods (PD, LIA, CICF-assisted WMS, and DLIA).
Calibration Experiment and Limit of Detection
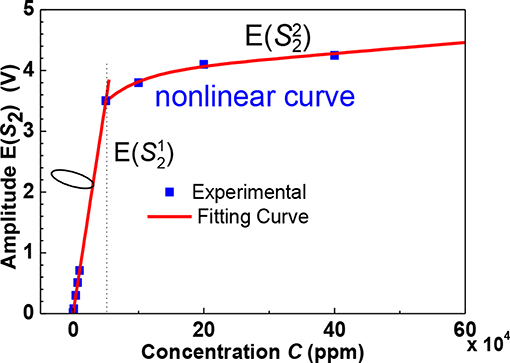
The limit of detection (LOD) of the instrument directly determines the performance of the instrument. To test the instrument performance, the CO2 concentration was varied from 0 to 100%.
It can be seen from Figure 12 that when the gas concentration was in the low concentration range (0–5%), the amplitude of the second harmonic signal obtained by the instrument satisfies the formula exp[−α(t)CL] ≈ 1 − α(t)CL, which is not a response to a linear relationship for the detected gas concentration. When the concentration was >5%, the relationship between the two was non-linear. The CO2 concentration was in the range of 0~100ppm and the sensitivity of the system is defined as:
Among them, and are the minimum and maximum values of the amplitude of the WMS-2f signal when the CO2 concentration was 100 ppm, respectively. The peak-to-peak value of the noise voltage of the analysis system was NL = 0.5mV. The expression for LOD of the CO2 analysis system can be written as LOD = NL/S. Therefore, the LOD of the CO2 analysis system was 0.0812ppm.
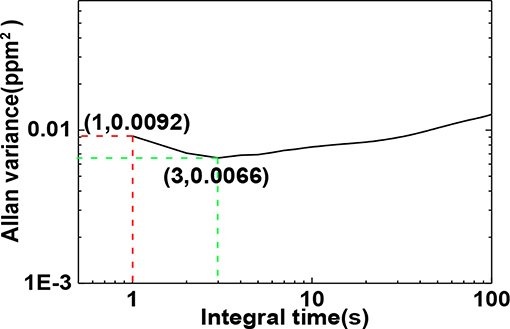
When the carbon dioxide concentration was 5%, the amplitude of the WMS-2f signal was tested and 9,697 points were continuously measured at time interval of 1 s. The Allan variance curve was calculated as shown in Figure 13. It can be seen from this figure that when the integration time was 1 second, the variance of the system was 0.0092 ppm2 and a LOD of 0.0303 ppm was obtained. When the integration time is 3s, the stability of the system is optimum and even a lower LOD of 0.0812 ppm can be achieved. Due to the influence of external environmental variation (such as temperature, humidity) and degradation of the laser driver, detector and data acquisition system, the long-term effects kick in when the integration time increases. This explains why the variance starts to increase and demonstrates some structures after passing the optimum integration time as shown in Figure 13.
Conclusions
By using a modulated DFB laser with peak wavelength 1,579.1 nm, a CO2 detection system was developed. A cascade-integrated comb (CIC) filter and a FIR low-pass filter were combined in DLIA to extract the WMS-2f signal to determine the CO2 concentration gas. The detection system of CICF-assisted WMS and DLIA developed in this manuscript was more linear than the other two conventional methods. Three methods (PD, LIA, CICF-assisted WMS, and DLIA) were compared to detect the concentration of the target component and the anti-interference performance of each detection method was analyzed. The relative errors of these three methods (PD, LIA, CICF-assisted WMS, and DLIA) in measuring the CO2 concentration of 1% are <11, 5.5, and 1.9%, respectively. Compared with the peak detection and the lock-in amplifier, the CICF-assisted WMS and DLIA developed in this manuscript had the highest linearity and precision. When the integration time is 3s, the LOD of the system was predicted to be 0.0812 ppm. The DLIA had a stable performance and a small measurement error, which met the requirements of CO2 gas detection. The CO2 detection system had a simple optical path, a low cost, miniaturization of the instrument and had a good application prospect of real-time monitoring of the CO2 concentration.
Data Availability Statement
The raw data supporting the conclusions of this manuscript will be made available by the authors, without undue reservation, to any qualified researcher.
Author Contributions
GL is responsible for the writing and conception of the overall content of the article. ED is responsible for the design of CIC filter and digital phase-locked atmosphere in this paper. WJ is responsible for the design and analysis of the experiment.
Funding
This work was supported by key R & D program of Shandong Province (Nos. 2019GHY112084, 2019GGX104103), the Fundamental Research Funds for the Central Universities (Nos. 19CX02045A, 18CX02112A), National Natural Science Foundation of China (No. 41704124), Shandong Provincial Natural Science Foundation (Nos. ZR2017LF023, ZR2017BEE026), and Jilin University State Key Laboratory on Integrated Optoelectronics Open Research Fund Project (No. IOSKL2017KF0).
Conflict of Interest
The authors declare that the research was conducted in the absence of any commercial or financial relationships that could be construed as a potential conflict of interest.
References
1. Le Barbu T, Vinogradov I, Durry G, Korablev O, Chassefière E, Bertaux JL., TDLAS a laser diode sensor for the in situ monitoring of H2O, CO2 and their isotopes in the Martian atmosphere. Adv Space Res. (2016) 38:718–25. doi: 10.1016/j.asr.2005.04.049
2. Xia H, Dong FZ, Wu B, Zhang ZR, Pang T, Sun PS, et al. Sensitive absorption measurements of hydrogen sulfide at 1.578 μm using wavelength modulation spectroscopy. Chin. Phys. (2015) 24:034204. doi: 10.1088/1674-1056/24/3/034204
3. Qu SM, Wang M, Li N. Mid-infrared trace CH4 detector based on TDLAS-WMS. Spectr Anal. (2016) 36:3174–8. doi: 10.3964/j.issn.1000-0593(2016)10-3174-05
4. Nie X, Pan Z. Differential-type integrating GMI magnetic sensor based on orthogonal vector lock-in amplifier. Chin J Lasers. (2013) 45:0911014.1–14.7. doi: 10.1109/CAC.2013.6775756
5. Tang Q, Wang J, Zhang Y, Dong S, Chen J, Jiang F, et al. Detection of a weak Near-Infrared signal using a digital orthogonal-vector lock-in amplifier. J Instrument. (2019) 14:P05011.1–11.12. doi: 10.1088/1748-0221/14/05/P05011
6. Webber ME, Pushkarsky M. Fiber amplifier enhaneed photoaeoustic spectroscopy with near-infrared tunable diode lasers. Appl Opt. (2003) 42:2119–26. doi: 10.1364/AO.42.002119
7. BStosic P, Pavlovic VD. On design of a novel class of selective CIC FIR filter functions with improved response. AEU Int J Electron Commun. (2014) 68:720–9. doi: 10.1016/j.aeue.2014.02.013
8. Ma YF, He Y, Tong Y, Yu X, Tittel FK. Quartz-tuning-fork enhanced photothermal spectroscopy for ultra-high sensitive trace gas detection. Opt Exp. (2018) 26:32103–10. doi: 10.1364/OE.26.032103
9. Li J, Benli Y, Weixiong Z, Weidong C. A review of signal enhancement and noise reduction techniques for tunable diode laser absorption spectroscopy. Appl Spectr Rev. (2014) 49:666–91. doi: 10.1080/05704928.2014.903376
10. He QX, Liu HF, Li B, Pan JQ, Wang LJ, Zheng CT, et al. Online detection system on acetylene with tunable diode laser absorption spectroscopy method. Guang Pu Xue Yu Guang Pu Fen Xi. (2016) 36:3501–5. doi: 10.3964/j.issn.1000-0593(2016)11-3501-05
11. Colombo R, Rocchini L, Suardi N, Benigni F, Colciago G, Bettiga A, et al. Implementation of digital lock-in and concentration measurement for wavelength modulation spectroscopy (WMS) based Sensors using MATLAB. In: IEEE 3rd International Conference on Sensing, Signal Processing and Security (ICSSS) (2017). p. 350–6. doi: 10.1109/SSPS.2017.8071619
12. Wu H, Dong L, Zheng H, Liu X, Xukun Y, Weiguang M, et al. Enhanced near-infrared QEPAS sensor for sub-ppm level H2S detection by means of a fiber amplified 1582 nm DFB laser. Sens Actuat. (2015) 221:666–72. doi: 10.1016/j.snb.2015.06.049
13. Li B, Zhang S, Chi Y. Development and integration of a CO detection system based on wavelength modulation spectroscopy using near-infrared DFB laser. J Spectr. (2018) 2018:1707252. doi: 10.1155/2018/1707252
14. He Y, Ma YF, Tong Y, Yu X, Tittel FK. Ultra-high sensitive light-induced thermoelastic spectroscopy sensor with a high Q-factor quartz tuning fork and a multipass cell. Opt Lett. (2019) 44:1904–7. doi: 10.1364/OL.44.001904
15. Jiang C, Liu Y, Yu B, Yin S, Chen P. TDLAS-WMS second harmonic detection based on spectral analysis. Rev Sci Instr. (2018) 89:083106. doi: 10.1063/1.5031683
16. Liu W, Tang M, Liu L, Lu X, Luo C. Analysis and simulation of extracting radar modulation signal based on CIC Filter. IOP Conf. Seri. (2019) 569:032058. doi: 10.1088/1757-899X/569/3/032058
17. Li B, He QX, Fu Y, Zhai B, Huang JQ, Zheng CT. Development of near infrared distributed feedback laser temperature control system for CO detection. Acta Opt Sin. (2014) 34:1–7. doi: 10.3788/AOS201434.s214002
18. He Y, Zhang YJ, Kan RF, Xia H, Wang M. The development of acetylene on line monitoring technology based on laser absorption spectrum. Spectrosc Spectral Anal. (2008) 10:2228–31. doi: 10.3964/j.issn.1000-0593(2008)10-2228-04
19. Zheng CT, Huang JQ, Ye WL, Lv M. Demonstration of a portable near infrared CH4 detection sensor based on tunable diode laser absorption spectroscopy. Infrared Phys Technol. (2013) 61:306–12. doi: 10.1016/j.infrared.2013.08.006
20. Bhattacharyya S, Ahmed R, Purkayastha B, Bhattacharyya K. Implementation of digital lock-in amplifier. J Phys. (2016) 759:012096. doi: 10.1088/1742-6596/759/1/012096
Keywords: TDLAS, tunable diode laser, CIC filter, WMS, lock-in amplifier
Citation: Li G, Dong E and Ji W (2019) A Near-Infrared Trace CO2 Detection System Based on an 1,580 nm Tunable Diode Laser Using a Cascaded Integrator Comb (CIC) Filter-Assisted Wavelength Modulation Technique and a Digital Lock-in Amplifier. Front. Phys. 7:199. doi: 10.3389/fphy.2019.00199
Received: 16 September 2019; Accepted: 08 November 2019;
Published: 26 November 2019.
Edited by:
Yufei Ma, Harbin Institute of Technology, ChinaReviewed by:
Wei Ren, The Chinese University of Hong Kong, ChinaFrank Tittel, Rice University, United States
Copyright © 2019 Li, Dong and Ji. This is an open-access article distributed under the terms of the Creative Commons Attribution License (CC BY). The use, distribution or reproduction in other forums is permitted, provided the original author(s) and the copyright owner(s) are credited and that the original publication in this journal is cited, in accordance with accepted academic practice. No use, distribution or reproduction is permitted which does not comply with these terms.
*Correspondence: Wen-hai Ji, aml3ZW5oYWlAdXBjLmVkdS5jbg==; Guolin Li, bGlndW9saW5AdXBjLmVkdS5jbg==
 Guolin Li
 Enting Dong
 Wen-hai Ji