- 1Department of Electronic Engineering, East China Normal University, Shanghai, China
- 2Institute for Solid State Physics, The University of Tokyo, Kashiwa, Japan
Two organic-inorganic halide CH3NH3PbI3 perovskite solar cells prepared in the same experimental batch but having different power conversion efficiencies −18.46% and 17.15%—were investigated based on the absolute electroluminescence (EL) efficiency measurements and traditional I-V measurements. The possible factors that affect the power conversion efficiency were also investigated. Comparing the experimental I-V curves of the two solar cells, it was found that the short-circuit currents (Jsc) were nearly the same; however, the open-circuit voltages (Voc) were markedly different. Moreover, the deduced I-V curves from the absolute EL efficiencies of the two solar cells, which were mainly affected by the material quality, were almost the same, proving that the device processing technology has a vital effect on Voc.
Introduction
In the last few years, the power conversion efficiency (PCE) of hybrid organic-inorganic halide perovskite solar cells (PSCs) has improved dramatically, with their power conversion efficiency increasing from 3.9% [1] to a record high of more than 20% [2–5], thereby outperforming commercially mature thin-film solar cells [such as Cu(In,Ga)Se2 and CdTe solar cells] [6]. Although PSCs have caused widespread concern in the scientific community, the actual PCE is still far below the theoretical efficiency limit of about 31% [7, 8]. Characterizing energy losses and designing an approach for achieving higher efficiency are of great importance. However, some specific physical properties of PSCs, which are important for cell design and fabrication, are difficult to obtain via the widely used traditional solar-simulator-based current-voltage measurement [9–12]. Moreover, there are many factors, such as thickness and film quality of every layer, which may affect device performance and result in a low reproducibility. Therefore, it is of importance to study these variations and to try to find out the origins to improve yield and reliability for achieving high and stable efficiency for solar cell. Electroluminescence (EL) measurement is another promising diagnosis technique for solar cells, having the advantages of being non-destructive and relatively simple [13–20]. An absolute EL-efficiency measurement method based on the basic reciprocity relationship between the light-emitting diode operation and solar cell [13] has been demonstrated as a powerful method for diagnosing solar cells [21, 22]. This can evaluate not only the internal current-voltage properties but also detailed photovoltaic parameters of the PSCs, including junction loss, non-radiative loss, radiative emission loss, thermalization loss, and transmission loss in the solar cell, providing useful feedback information for device design and fabrication.
In this study, PSCs were prepared with the solution process method at the same time and same condition; however, the conversion efficiencies were different, 18.46 and 17.15%. To determine the reason for different efficiencies, these PSCs were measured with both the traditional I–V measurements and the absolute EL efficiency measurements. The measured EL quantum efficiency of the solar cell directly reflect the penalty in Voc arising from the NR recombination. The photovoltaic parameters and energy losses of the solar cells were analyzed with the absolute EL efficiency measurements. Through the comparison of the predicted I–V properties with the experimental I–V of the solar cells, possible factors that affect the power conversion efficiency of the solar cells were discussed.
Experimental
The PSCs were prepared using a well-documented process by Oku et al. [23] with slight adjustment. The specific fabrication process of solar cells is described as follows. Fluorine-doped tin oxide (FTO) was first etched by Zn powder and HCl. The etched FTO was then cleaned ultrasonically with detergent, deionized water, acetone, isopropanol, and ethanol successively, and then dried with nitrogen gas. A titanium dioxide (TiO2) precursor solution was spin-coated on the FTO glass substrate at 2,000 rpm for 30 s, followed by muffle furnace sintering at 500°C for 1 h to form a compact TiO2 layer. After cooling to room temperature, a perovskite film was formed using the spin-coating method with a CH3NH3PbI3 precursor solution on the TiO2 layer at 2,000 rpm for 30 s. The 37 wt% CH3NH3PbI3 precursor solution was prepared by dissolving MAI and Pb(Ac)2 in anhydrous DMF with a 3:1 molar ratio. Upon annealing at 100°C for 10 min, the film darkened in color, indicating the formation of a CH3NH3PbI3 perovskite film, which was confirmed by X-ray diffraction (XRD) spectroscopy. Subsequently, the hole transporting material, a Spiro-OMeTAD solution, was deposited on top of the perovskite film by spin coating at 3,000 rpm for 30 s. The Spiro-OMeTAD solution was prepared by dissolving 72.3 mg of Spiro-OMeTAD, 28.5 μL of 4-tert-butylpyridine, and 17.5 μL of lithium salt-acetonitrile solutions in 1 mL of chlorobenzene. After that, a gold metal contact of 80 nm thickness was evaporated using a mechanical mask onto the sample as top electrodes to form the complete device. The size of the cell unit studied was circular with a diameter of 0.3 cm.
The experimental setup for the absolute EL measurements of the PSC consists of a current-voltage source and a photon detection approach following the setup reported by Chen et al. [22] and Yoshita et al. [24]. The spectrometer consists of two parts, one is a monochromator and the other is an electrically cooled silicon charge-coupled device. The solar-cell External Quantum efficiency (EQE) was measured with Crowntech Qtest Station 1000 AD. The experimental I-V characteristics of the PSCs were performed under illustration at 100 mW/cm2 using an AM1.5G solar simulator at room temperature. The experimental I–V measurement was performed at forward scan direction with scanning rate of 0.3 V/s. XRD patterns were obtained using Cu Kα radiation.
Results and Discussion
Figures 1A,B present the photograph and the schematic structure of the PSCs used in this study, respectively. Figure 1C shows the cross-section sectional scanning electron microscopy (SEM) image of the CH3NH3PbI3 film deposited on the TiO2 layer, visualizing a thick perovskite layer of around 1 μm. Figure 1D shows the XRD pattern of the CH3NH3PbI3 film. The diffraction peaks located at degrees of 14.16, 28.45, and 43.35 can be indexed to the (110), (220), and (330) planes, respectively, confirming an orthorhombic crystal structure of the CH3NH3PbI3 film with high crystallinity, which is consistent with the previous report [25].
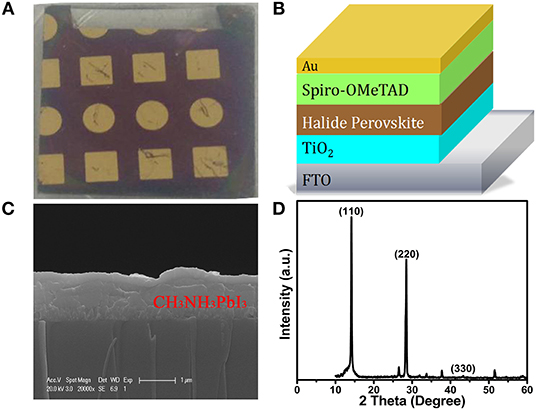
Figure 1. (A) Photograph, (B) schematic structure, (C) cross-section SEM image, and (D) XRD pattern of the CH3NH3PbI3 PSCs.
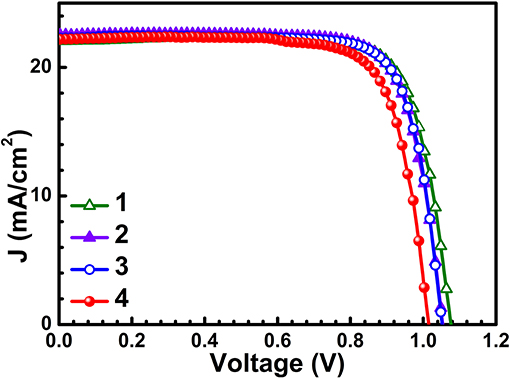
Figure 2 shows the corresponding I–V characteristics of the PSCs (cells 1–4) used in this study. We can observe that although the solar cells are fabricated with the same process at the same time, their efficiencies are slightly different. Therefore, we chose two solar cells (cell 1 and cell 4) with different efficiencies to analyze their photovoltaic parameters and energy losses with absolute EL efficiency measurements.
Figure 3 shows the absolute EL intensity images of cell 1 with different applied forward injection current densities. Along with the increase of injection current density, higher EL emission intensity can be observed. It can be seen that the solar cells have some spatial inhomogeneity, on account of the internal resistance of the sample, which has been proved by Mochizuki et al. [26]. It can also be seen that some bright points with weak current injections disappeared with increasing current density, indicating that the current distributions in the solar cells are different with different current injection densities. Further, the forward injection current may have some effects on the structural and material properties of the solar cells, which was also discussed previously by Okano et al. [27].
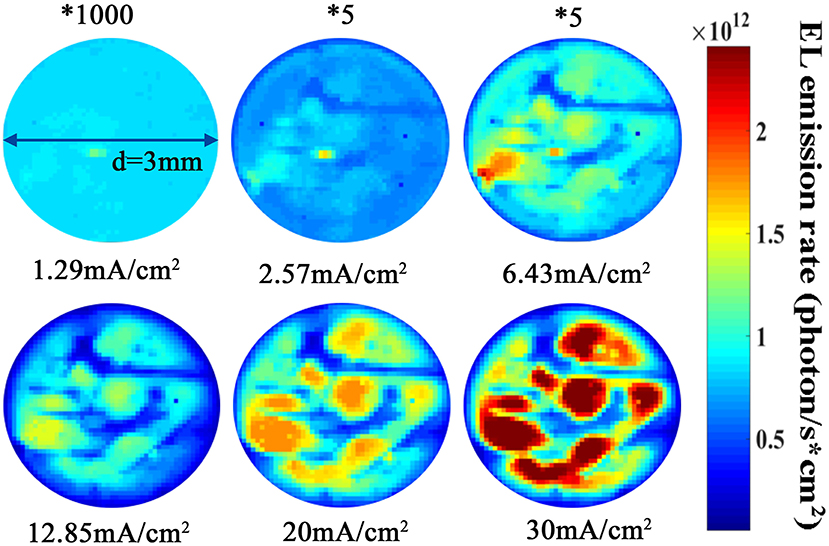
Figure 3. EL images of cell 1 with different forward Jinj. The size of the cell unit was circular with a diameter of 3 mm.
Figure 4A shows the measured EQE spectrum and the normalized EL intensity of solar cell 1. Figure 4B shows the measured EL quantum efficiency (defined as the ratio between the emitted photon number and the total injected carrier number) of solar cell 1 on a semi-log scale as a function of the injected current density. In the early stage, of the solar cell increases gradually with increasing injection current density, which indicates an increased radiative recombination rate with increased carrier density [28]. Nevertheless, when applying high current densities, gradually decreased. Similar behaviors were observed previously in PSCs [27, 29–31], and two possible origins with high carrier density are suggested: (1) Generation of non-radiative recombination centers [29] and (2) migration of ions induced generation of trap-type vacancy defects in the perovskite layer [30], which may be responsible for the observed degradation of the EL efficiency.

Figure 4. (A) EQE and normalized EL spectra of the cell 1. (B) of the cell 1 as a function of the forward Jinj. (C) I–V curves of the cell 1 under the AM1.5 1-sun condition with solar simulator (blue open circle), deduced from EL measurements without (black line), and with (red dash dot line) a series resistance Rswith a value of 0.044 Ω cm2.
According to the reciprocity relationship between EL and EQE of a solar cell [13], the emitted photon density Rem from the top surface of the solar cell can be given as
Here, is the spectral photon density of a black body for the photon energy E; V is the internal junction voltage; q is the electron charge; k is the Boltzmann constant; T is the Kelvin temperature of the cell; and h and c are the Planck constant and the velocity of light in vacuum, respectively. Moreover, Rem is expressed as a function of yext and JAM1.5. Hence, we can derive the internal I-V characteristics of solar cell 1 as shown in Figure 4C. The detailed description of the derivation can be found in previous studies [21, 22].
Figure 4C plots the I–V curves of solar cell 1 under 1-sun AM1.5. The blue open circle represents the experimental I–V measurements under a 1-sun AM1.5 condition using a solar simulator. The black solid line represents the I–V curve extrapolated from the absolute EL measurements without series resistance contribution. The red dash-dot solid line represents the estimated I-V curve from the absolute EL measurements considering the effect of series resistance Rs, where the value of Rs is estimated as 0.044 Ω cm2. The I–V curve measured by the EL method after considering the series resistance Rs comes much closer to the I–V curve measured with a solar simulator. Table 1 lists the fundamental photovoltaic parameters of solar cell 1 extrapolated from the I–V curves with the solar simulator by the EL method with Rs and without Rs, respectively.
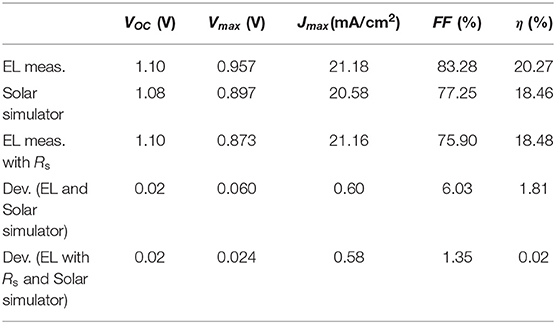
Table 1. Major parameters of the cell 1 derived from the I–V curves from the absolute-EL-measurements with and without considering Rs, from experimental I–V measurement under the condition of AM1.5 1sun.
As we can see, the open-circuit voltage Voc of 1.10 V derived through the absolute EL efficiency and EQE measurements is in good agreement with the measured Voc of 1.08 V with the solar simulator. The derived efficiency of 20.27% from the EL efficiency is higher than the measured efficiency of 18.46%, because the effects of the resistances from the solar cell or sometimes partly from the probes of the I–V measurement system are not included in the EL method. If we introduce Rs into the I–V from the absolute EL measurement, the efficiency (18.48%) gets much closer to the measured data with a very small deviation of 0.02%. Furthermore, the detailed energy losses of the solar cell can also be obtained from the absolute EL efficiency measurements. We evaluated all the loss/output rates in solar cell 1 working at the maximum-output-power condition under AM1.5 1-sun irradiation [22], as shown in Table 2. All the values are given in proportion; the input solar energy is normalized to 100%.

Table 2. Major parameters of the cell 1 derived from the I–V curves based on absolute EL-efficiency measurements under AM1.5 1-sun radiation under the working condition of maximum output power.
As a result, 50.1% solar energy transmits (TR) through the device without being absorbed; 49.9% solar energy is absorbed, but only 20.4% solar energy is used for generating electric energy. The rest is all energy loss, including 14.4% of thermalization (TH) loss, 1.6% of non-radiative (NR) loss, and 13.5% of junction (JN) loss. The radiative emission (EM) loss is small enough to be neglected in the maximum-output-power condition. From Table 2, we know that most of the energy loss in the PSC is caused by the TR loss, i.e., photons with energies lower than the bandgap energy of the solar cell material cannot be utilized. The TH loss is due to the relaxation of “hot” charge carriers that were created upon absorption of high-energy photons in solar irradiation [32]. The TR and TH losses mainly depend on material, and once the material is fixed, these losses cannot be reduced. Reducing JN and NR loss is a feasible approach to obtaining higher conversion efficiency. Numerous defects in the polycrystalline perovskite film will give rise to serious NR loss. High-quality perovskite films with low-density defects are necessary. To obtain high-quality perovskite films with low-density defects, many methods have been proposed: (1) the dual-functional polymethyl methacrylate fullerene complex is incorporated into the perovskite layer to accomplish the improvement in intrinsic stability and charge transport properties of the film [33]; (2) antisolvent assisted crystallization method to obtained superior film [34, 35]; (3) incorporation of chlorine in perovskite film enlarges grains increases crystallinity and carrier mobility, reduces electronic disorder and suppresses trap-assisted recombination [36], leading to improved efficiency of devices. Furthermore, interfacial recombination at the perovskite/transport-layer interface dominates the junction energy loss and results in a significant reduction of the potential Voc of the solar cell. Consequently, Stoterfoht et al. have reported that inserting an ultrathin LiF interfacial layer between the perovskite and transport layers, which decreases the interface recombination and increases quasi-Fermi-level splitting, results in significant improvement of the device performance [37]. We will further improve the quality of perovskite films and optimize the interface between the perovskite and transport layers to obtain high-efficiency solar cells for EL measurement in our future work. These results provide valuable diagnosis for optimizing the PSC structure.
To further explore the possible factors that affect the power conversion efficiency of the solar cells, solar cell 4 was also measured with absolute EL measurements. Figure 5A shows the measured absolute EL efficiency as a function of the injection current density of solar cell 4. Figure 5B plots the I–V curves of solar cell 4 under 1-sun AM1.5 with different measurements. The open-circuit voltage Voc evaluated from the absolute EL measurements and from the I–V measurements with solar simulator were 1.08 and 1.02 V, respectively. The I–V curve measured with a solar simulator was clearly different from the I–V curve obtained from the absolute EL measurement, even considering the series resistance Rs. Moreover, Figures 5C,D show the I–V curves measured with the solar simulator and I–V curves deduced from the EL measurements of both the solar cells, and the corresponding extracted key device parameters are summarized in Table 3. From Figure 5C, it can be seen that the short-circuit currents (Jsc, 22.13 mA/cm2 for solar cell 1 and 22.20 mA/cm2 for cell 4) of the two cells are almost the same; however, the open-circuit voltages (Voc, 1.08 V for cell 1 and 1.02 V for cell 4) are clearly different. In addition, from Figure 5D it can also be seen that the difference between the predicted I–V relations from the EL measurements of cell 1 and cell 4 is minor. This indicates that the fabrication processes have a significant impact on the Voc of the solar cells, such as the electrode effect [38], perovskite/hole transport layer (HTL), and perovskite/ electron transport layer (ETL) interface effects [39]. It is possible that the ohmic contact between the HTL and the Au electrode is not good in solar cell 4; thus, substantial surface recombination may occur at the interfaces, which in turn will decrease Voc. Moreover, the perovskite-HTL and perovskite-ETL interfaces are critical in charge transportation, recombination, and separation, thus affecting Voc [39]. The decrease in Voc of cell 4 might be attributed to the imperfect interfaces and will thereby influence charge extractions.
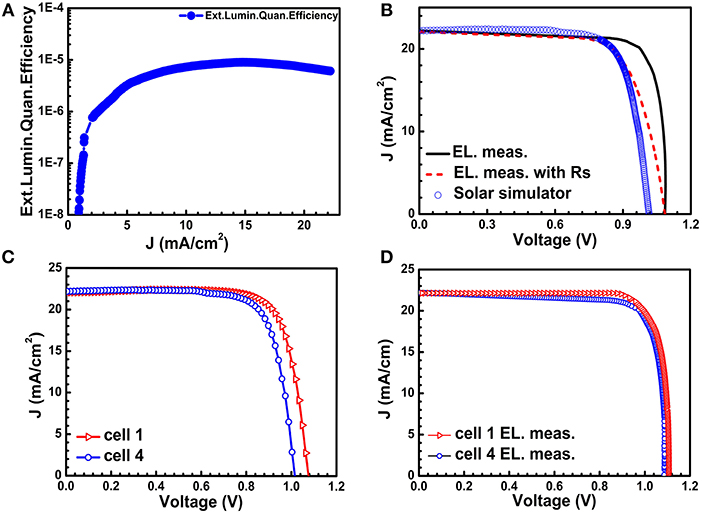
Figure 5. (A) yextof the cell 4 measured under LED operation as a function of the forward Jinj. (B) I–V curves of the cell 4 under AM1.5 1-sun condition with solar simulator (blue open circle) and deduced from EL measurement without (black solid line) and with (red dash dot line) Rscontribution. (C) I–V curves measured with solar simulator and (D) the I–V curves from EL measurement of cell 1 (red open circle) and cell 4 (blue open triangle), respectively.
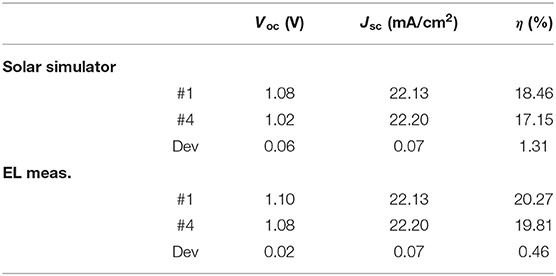
Table 3. Major parameters of the solar-simulator-based and EL-measurement-based I–V curves with a condition of AM1.5 1-sun of cell 1 and cell 4.
Furthermore, the detailed energy loss of the two cell samples (cell 1 and cell 4) derived from the I–V curves based on absolute- EL-efficiency measurements under AM1.5 1-sun radiation under the working condition of maximum-output-power including the TH loss, TR loss, EM loss, NR loss, and JN loss, as shown in Table 4. It can be seen that for the two cells, the distributions of energy losses were almost identical. From Table 4, it could be inferred that the higher Voc for the high efficiencies might be partly due to the smaller NR loss. The lower efficiency for cell 4 was possibly due to its poorer interface (perovskite/Spiro-OMeTAD or perovskite/TiO2) inducing more non-radiative loss, resulting in a significant reduction of the Voc, which is consistent with previously reported results [37].

Table 4. Energy balance sheet of two CH3NH3PbI3 cell samples (cell 1 and cell 4) with different efficiencies derived from the I–V curves based on absolute EL-efficiency measurements under AM1.5 1-sun radiation under the working condition of maximum output power.
Conclusion
In summary, a batch of PSCs were prepared with a solution process method at the same time and under the same conditions; however, the conversion efficiency differed. To understand the reason for the different efficiencies, two solar cells with different power conversion efficiencies were investigated by employing absolute EL efficiency measurements and traditional I–V measurements. The photovoltaic parameters and energy losses of the solar cells were also analyzed with the absolute EL efficiency measurements. It was found that the short-circuit currents (Jsc) were nearly the same; however, the open-circuit voltages (Voc) differed markedly, while the deduced I-V curves from the absolute EL efficiencies of the two solar cells were almost same. This indicates that the device processing technologies may have a significant effect on Voc. The quantification of the energy losses and internal parameters of PSCs is expected to provide valuable insight and guidance for the future design and development of high-efficiency CH3NH3PbI3 solar cells. In addition, PSCs are sensitive to environmental conditions—it is better to measure the PSCs placed within a glove box that is free of oxygen and moisture.
Data Availability Statement
The raw data supporting the conclusions of this manuscript will be made available by the authors, without undue reservation, to any qualified researcher.
Author Contributions
The CH3NH3PbI3 solar cells were synthesized by YG and JX. JX and XH set up the experimental apparatus, conducted the experiments, and collected all the measured data. SC designed the experiment and supervised the research. The analysis and discussion of the results were carried out by all the authors. The manuscript was written by JX with suggestions from all the authors.
Funding
This work was supported in part by the National Natural Science Foundation of China (Grant Nos. 61604055, 61704055, 61874044), the Shanghai Pujiang Program (grant No. 16PJ1402600), and the Program of Shanghai Science and Technology Committee (No. 17142202500) of China, and was also partly supported by KAKENHI No. 15H03968 from JSPS, the Photon Frontier Network Program of MEXT in Japan.
Conflict of Interest
The authors declare that the research was conducted in the absence of any commercial or financial relationships that could be construed as a potential conflict of interest.
References
1. Kojima A, Teshima K, Shirai Y, Miyasaka T. Organometal halide perovskites as visible-light sensitizers for photovoltaic cells. J Am Chem Soc. (2009) 131:6050–1. doi: 10.1021/ja809598r
2. Jeon NJ, Noh JH, Yang WS, Kim YC, Ryu S, Seo J, et al. Compositional engineering of perovskite materials for high-performance solar cells. Nature. (2015) 517:476–80. doi: 10.1038/nature14133
3. Bi D, Tress W, Dar MI, Peng G, Luo JS, Renevier C. Efficient luminescent solar cells based on tailored mixed-cation perovskites. Sci. Adv. (2016) 2:e1501170. doi: 10.1126/sciadv.1501170
4. Yang WS, Park BW, Jung EH, Jeno NJ, Kim YC, Lee DU. Iodide management in formamidinium-lead-halide–based perovskite layers for efficient solar cells. Science. (2017) 356:1376–9. doi: 10.1126/science.aan2301
5. NREL. Best Research-cell Efficiency Chart. (2018). Available online at: https://www.nrel.gov/pv/cell-efficiency.html (accessed April 16, 2019).
6. Green MA, Hishikawa Y, Dunlop ED, Levi DL, Jochen H, Yoshita M, et al. Solar cell efficiency tables (version 53). Prog Photovolt Res Appl. (2018) 27:1. doi: 10.1002/pip.3102
7. Shockley W, Queisser HJ. Detailed balance limit of efficiency of p-n junction solar cells. J Appl Phys. (1961) 32:510–9. doi: 10.1063/1.1736034
8. Sha WEI, Ren X, Chen LZ, Choy WCH. The efficiency limit of CH3NH3PbI3 perovskite solar cells. Appl. Phys Lett. (2015) 106:221104. doi: 10.1063/1.4922150
9. Snaith HJ, Abate A, Ball JM, Eperon GE, Leijtens T, Noel NK, et al. Anomalous hysteresis in perovskite solar cells. J Phys Chem Lett. (2014) 5:1511–5. doi: 10.1021/jz500113x
10. Zimmermann E, Wong KK, Müller M, Hu H, Ehrenreich P, Kohlstädt M, et al. Characterization of perovskite solar cells: towards a reliable measurement protocol. APL Mater. (2016) 4:091901. doi: 10.1063/1.4960759
11. Mastroianni S, Heinz FD, Im JH, Veurman W, Padilla M, Schubert MC. Analysing the effect of crystal size and structure in highly efficient CH3NH3PbI3 perovskite solar cells by spatially resolved photo-and electroluminescence imaging. Nanoscale. (2015) 7:19653–62. doi: 10.1039/C5NR05308K
12. Unger EL, Hoke ET, Bailie CD, Nguyen WH, Bowring AR, Heumüller T, et al. Hysteresis and transient behavior in current–voltage measurements of hybrid-perovskite absorber solar cells. Energy Environ Sci. (2014) 7:3690–8. doi: 10.1039/C4EE02465F
13. Rau U. Reciprocity relation between photovoltaic quantum efficiency and electroluminescent emission of solar cells. Phys Rev B. (2007) 76:085303. doi: 10.1103/PhysRevB.76.085303
14. Fuyuki T, Kondo H, Yamazaki T, Takahashi Y, Uraoka Y. Photographic surveying of minority carrier diffusion length in polycrystalline silicon solar cells by electroluminescence. Appl Phys Lett. (2005) 86:262108. doi: 10.1063/1.1978979
15. Bokalič M, Raguse J, Sites JR, Topič M. Analysis of electroluminescence images in small-area circular CdTe solar cells. Appl Phys. (2013) 114:123102. doi: 10.1063/1.4820392
16. Seeland M, Kästner C, Hoppe H. Quantitative evaluation of inhomogeneous device operation in thin film solar cells by luminescence imaging. Appl Phys Lett. (2015) 107:82_1. doi: 10.1063/1.4929343
17. Su ZC, Xu SJ, Wang RX, Ning JQ, Dong JR, Lu SL, et al. Electroluminescence probe of internal processes of carriers in GaInP single junction solar cell. Sol Energy Mat Sol C. (2017) 168:201–6. doi: 10.1016/j.solmat.2017.04.041
18. Zimmermann CG. Electroluminescence imaging of III–V multijunction solar cells. In: 35th IEEE Photovoltaic Specialists Conference (PVSC). Honolulu, HI (2010). doi: 10.1109/PVSC.2010.5615896
19. Shu GW, Ou NN, Hsueh PY, Lin TN, Wang JS, Shen JL, et al. Measuring photovoltages of III–V multijunction solar cells by electroluminescence imaging. Appl Phys Express. (2013) 6:102302. doi: 10.7567/APEX.6.102302
20. Hameiri Z, Mahboubi Soufiani A, Juhl MK, Jiang LC, Huang FZ, Cheng YB, et al. Photoluminescence and electroluminescence imaging of perovskite solar cells. Prog Photovolt Res Appl. (2015) 23:1697–705. doi: 10.1002/pip.2716
21. Hu XB, Chen TF, Xue JJ, Weng GE, Chen SQ, Akiyama H, et al. Absolute electroluminescence imaging diagnosis of GaAs thin-film solar cells. IEEE Photon J. (2017) 9:1. doi: 10.1109/JPHOT.2017.2731800
22. Chen SQ, Zhu L, Yoshita M, Mochizuki T, Kim C, Akiyama H, et al. Thorough subcells diagnosis in a multi-junction solar cell via absolute electroluminescence-efficiency measurements. Sci Rep. (2015) 5:7836–41. doi: 10.1038/srep07836
23. Oku T, Matsumoto T, Suzuki A, Suzuki K. Fabrication and characterization of a perovskite-type solar cell with a substrate size of 70 mm. Coatings. (2015) 5:646–55. doi: 10.3390/coatings5040646
24. Yoshita M, Zhu L, Kim C, Akiyama H, Chen SQ, Mochizuki T, et al. Absolute electroluminescence imaging of multi-junction solar cells and calibration standards. In: PVSC, IEEE. New Orleans, LA (2015). doi: 10.1109/PVSC.2015.7356199
25. Liu MZ, Johnston MB, Snaith HJ. Efficient planar heterojunction perovskite solar cells by vapour deposition. Nature. (2013) 501:395–8. doi: 10.1038/nature12509
26. Mochizuki T, Kim C, Yoshita M, Mitchell J, Zhu L, Chen SQ, et al. Solar-cell radiance standard for absolute electroluminescence measurements and open-circuit voltage mapping of silicon solar modules. J Appl Phys. (2016) 119:034501. doi: 10.1063/1.4940159
27. Okano M, Endo M, Wakamiya A, Yoshita M, Akiyama H, Kanemitsu Y. Degradation mechanism of perovskite CH3NH3PbI3 diode devices studied by electroluminescence and photoluminescence imaging spectroscopy. Appl Phys Express. (2015) 8:102302. doi: 10.7567/APEX.8.102302
28. Jordan C, Donegan JF, Hegarty J, Roycroft BJ, Taniguchi S, Hino T, et al. Carrier-density dependence of the photoluminescence lifetimes in ZnCdSe/ZnSSe quantum wells at room temperature. Appl Phys Lett. (1999) 74:3359.
29. Handa T, Tex DM, Shimazaki A, Aharen T, Wakamiya A, Kanemitsu Y. Optical characterization of voltage-accelerated degradation in CH3NH3PbI3 perovskite solar cells. Opt Express. (2016) 24:A917–24. doi: 10.1364/OE.24.00A917
30. Bndiello E, Ávila J, Gil-Escrig L, Tekelenburg E, Sessolo M, Bolink HJ. Influence of mobile ions on the electroluminescence characteristics of methylammonium lead iodide perovskite diodes. J Mater Chem A. (2016) 4:18614–20. doi: 10.1039/C6TA06854E
31. Handa T, Okano M, Tex DM, Shimazaki A, Aharen T, Wakamiya A, et al. Carrier injection and recombination processes in perovskite CH3NH3PbI3 solar cells studied by electroluminescence spectroscopy. Organic Photonic Materials and Devices XVIII. Int Soc Opt Phot. (2016) 9745:97451I. doi: 10.1117/12.2212052
32. Van Der Ende BM, Aarts L, Meijerink A. Lanthanide ions as spectral converters for solar cells. Phys ChemChemPhys. (2009) 11:11081–95. doi: 10.1039/b913877c
33. Wu CC, Wang K, Yan YK, Yang D, Jiang YY, Chi B, et al. Fullerene polymer complex inducing dipole electric field for stable perovskite solar cells. Adv Funct Mater. (2019) 29:1804419. doi: 10.1002/adfm.201804419
34. Yi J, Zhuang J, Ma Z, Guo Z, Zhou WY, Zhao SS, et al. Regulated perovskite crystallinity via green mixed antisolvent for efficient perovskite solar cells. Org Electron. (2019) 69:69–76. doi: 10.1016/j.orgel.2019.03.021
35. Yang LL, Gao YB, Wu YJ, Xue XX, Wang FY, Sui YR, et al. Novel insight into the role of chlorobenzene antisolvent engineering for highly efficient perovskite solar cells: gradient diluted chlorine doping. ACS Appl Mater Interfaces. (2018) 11:792–801. doi: 10.1021/acsami.8b17338
36. Zhao DW, Chen C, Wang CL, Junda MM, Song ZN, Grice CR, et al. Efficient two-terminal all-perovskite tandem solar cells enabled by high-quality low-bandgap absorber layers. Nat Energy. (2018) 3:1093–102. doi: 10.1038/s41560-018-0278-x
37. Stolterfoht M, Wolff CM, Márquez JA, Zhang SS, Hagges CJ, Rothhardt D, et al. Visualization and suppression of interfacial recombination for high-efficiency large-area pin perovskite solar cells. Nat Energy. (2018) 3:847–56. doi: 10.1038/s41560-018-0219-8
38. Elumalai NK, Uddin A. Open circuit voltage of organic solar cells: an in-depth review. Energy Environ. Sci. (2016) 9:391–410. doi: 10.1039/C5EE02871J
Keywords: CH3NH3PbI3, perovskite, thin-film solar cell, absolute electroluminescence (EL) efficiency measurements, energy losses
Citation: Xue J, Hu X, Guo Y, Weng G, Jiang J, Chen S, Zhu Z, Chu J and Akiyama H (2019) Diagnosis of Perovskite Solar Cells Through Absolute Electroluminescence-Efficiency Measurements. Front. Phys. 7:166. doi: 10.3389/fphy.2019.00166
Received: 08 July 2019; Accepted: 11 October 2019;
Published: 30 October 2019.
Edited by:
Emilio J. Juarez-Perez, Fundacion Agencia Aragonesa para la Investigacion y el Desarrollo, SpainReviewed by:
Wei E. I. Sha, Zhejiang University, ChinaAditya Sadhanala, University of Cambridge, United Kingdom
Copyright © 2019 Xue, Hu, Guo, Weng, Jiang, Chen, Zhu, Chu and Akiyama. This is an open-access article distributed under the terms of the Creative Commons Attribution License (CC BY). The use, distribution or reproduction in other forums is permitted, provided the original author(s) and the copyright owner(s) are credited and that the original publication in this journal is cited, in accordance with accepted academic practice. No use, distribution or reproduction is permitted which does not comply with these terms.
*Correspondence: Shaoqiang Chen, c3FjaGVuQGVlLmVjbnUuZWR1LmNu
†These authors have contributed equally to this work and share first authorship
 Juanjuan Xue1†
 Shaoqiang Chen