- 1Department of Electronics and Telecommunication, Jadavpur University, Kolkata, India
- 2Department of Electrical Engineering, Jadavpur University, Kolkata, India
- 3Department of Physics, Charuchandra College, Kolkata, India
- 4Department of Physics, St. Xavier's College, Kolkata, India
- 5Department of Physics, Condensed Matter Physics Research Centre, Jadavpur University, Kolkata, India
In our study we report on some of the novel properties of a square lattice filled with white sites, randomly occupied by black sites (with probability p). We consider connections up to the second nearest neighbors, according to the following rule. Edge-sharing sites, i.e., nearest neighbors of similar type are always considered to belong to the same cluster. A pair of black corner-sharing sites, i.e., second nearest neighbors may form a “cross-connection” with a pair of white corner-sharing sites. In this case assigning connected status to both pairs simultaneously, makes the system quasi-three dimensional, with intertwined black and white clusters. The two-dimensional character of the system is preserved by considering the black diagonal pair to be connected with a probability q, in which case the crossing white pair of sites are deemed disjoint. If the black pair is disjoint, the white pair is considered connected. In this scenario we investigate (i) the variation of the Euler number χ(p) [= NB(p) − NW(p)] vs. p graph for varying q, (ii) variation of the site percolation threshold with q, and (iii) size distribution of the black clusters for varying p, when q = 0.5. Here NB is the number of black clusters and NW is the number of white clusters, at a certain probability p. We also discuss the earlier proposed “Island-Mainland” transition [1] and show mathematically that the proposed transition is not in fact a critical phase transition and does not survive finite size scaling. It is also explained mathematically why clusters of size 1 are always the most numerous.
1. Introduction
Different aspects of the properties of two-dimensional square lattices has been an ongoing challenge for over half a century. Yet, there are certain lattice properties which have not been as well-studied as the others.
The identification of the percolation transition as a critical phase transition has been a significant finding with deep theoretical as well as practical implications [2]. Another quantity which survives finite size scaling is the Euler number which has therefore many practical applications. The concept of Euler number is an important topological property inspired from ideas useful to the field of image processing [3]. The Euler number (or genus) is defined as the difference between the number of “connected components” and the number of “holes” in an image. These types of topological properties remain invariant under any arbitrary rubber-sheet transformation, i.e., stretching, shrinking, rotation etc. and thus is very useful in image characterization to match shapes, recognize objects, image database retrieval and other image processing, and computer vision applications. Analysis of images of real systems like soil crack patterns [1, 4], fast reading of car number plates [5], and automatic signature matching [6] have been facilitated through use of Euler numbers. In diagnostic imaging, analysis of patterns with proper thresholding, is extremely important to identify irregularities indicating possible medical conditions. Here again the Euler number plays an important role [7, 8].
Recently the Euler number and its variation with site occupation probability on a square lattice, has been discussed by Khatun et al. [1]. Black (B) unit squares are randomly dropped, with probability p onto a lattice initially filled with white (W) unit squares. Here sites up to second nearest neighbors are considered to be connected. That is, by definition edge sharing as well as corner sharing sites of similar type belong to the same cluster. A problem in this situation is that with clusters defined thus, there may appear points where two diagonal connections cross each other and the system no longer remains ideally two-dimensional [1, 9] (Figure 1), but has to be visualized as a quasi-three-dimensional system. In the present study we report an extension of the work by Khatun et al. [1], where this problem is circumvented. A new variable q is introduced, which represents the probability of a pair of diagonals B sites being connected, in which case the pair of diagonals W sites sharing the same corner will be necessarily considered disjoint. Now the flattened system can be represented as a purely two-dimensional lattice. The site percolation threshold pc(q),over the whole range of q covering values from 0 to 1 are presented. The number of black clusters(NB) is now a function of p and q, so is the number of white clusters (NW). The Euler number is defined as χ(p, q) = NB(p, q)−NW(p, q) so “connected components” and “holes” imply here clusters of occupied (Black/White) or vacant (White/Black) sites respectively. Random deposition and clustering on square lattices with the nearest neighbor as well as the second nearest neighbor connections have been studied earlier, but probabilistic connections between second neighbors (introduced through q) is a new concept, which simultaneously retains the two-dimensional as well as stochastic character of the system.
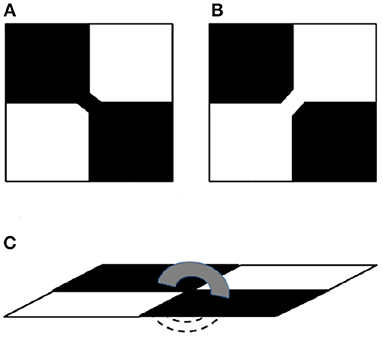
Figure 1. Possible diagonal connections in a 2 × 2 square lattice having two diagonally opposite black pixels (squares) and two diagonally opposite white pixels which orthogonally neighbor them. (A) shows a diagonal connection between two diagonal black pixels (squares) which disconnects the orthogonally neighboring white pixels while (B) shows the reverse situation where two diagonal white squares are connected. In case both are connected, as in (C), the system becomes quasi-3D.
Apart from the percolation threshold pc, i.e., the value of p where the B sites first form a system-spanning “infinite cluster” the structure and size-distribution of the finite clusters are also of great interest and considerable work has been done for two-dimensional lattices with various patterns [10, 11]. The cluster size distributions in the new scenario are studied and it is shown that their qualitative features do not vary significantly with q. In addition, we show mathematically that an “island-mainland” transition, conjectured by Khatun et al. [1] from numerical simulations cannot be a critical phase transition and may be observed in finite-sized systems only.
Mertens and Ziff [12] and Sykes and Essam [13] have also worked on the Euler characteristic χc albeit they follow a slightly different definition which involves the concept of matching lattices. On a square lattice if nearest neighbors (NN), i.e., edge-sharing sites of same type are considered to be connected, the Euler characteristic is defined as
where NB(p) is the number of clusters of B sites on the primary lattice and NWM(p) is the number of W clusters on the matching lattice corresponding to the primary lattice. The matching lattice of the primary square lattice is obtained by adding edges to each face of the primary lattice such that the boundary vertices of that face form a clique, namely a fully connected graph. For the square lattice, this means that we add the two diagonals to each face: the matching lattice of the square lattice is the square lattice with next-nearest neighbors.
Here we will focus on the first definition of Euler number, as defined in Dey et al. [3] i.e., χ(p) = NB(p) − NW(p). This definition is equivalent to the case when the primary and complementary lattices are identical and connections of black and white clusters in the primary and complementary lattices are governed by the diagonal connection probability q as described before.
The situation discussed here is connected to another practical problem of surface science, namely wetting, spreading, or salt deposition on a plane surface. This depends on the properties of the spreading fluid and substrate (two different fluids may be involved to make things more complex). In case of crystal growth, for example, with a cubic crystal like NaCl crystallizing from a complex solution [14], one may think of an underlying square lattice. Here, the crystal growth sometimes favors diagonal connections over edge connections. Crystal growth in this case is in the form of narrow fingers connected through corners, while in others it may grow as compact cubes or empty box-like hopper crystals.
We expect the present discussions to be applicable to wetting-spreading problems between fluids and substrates with complex interactions amongst themselves, in determining what final configurations the system shall take, since growth can happen either across the edge or the corner of a square lattice, but in reality will depend on the physics and chemistry governing the wetting or growth process.
Following this introduction, in the next section 2 details of the numerical simulation and the results obtained are presented and discussed in section 3. In section 4 we discuss the idea behind the Island-Mainland transition suggested in Khatun et al. [1], its limitations and its relationship with our model. Finally, section 5 provides a discussion of the results and concludes with directions for future work.
2. Simulation Details
For our simulations all binary random matrices were generated using the Xorshift pseudo-random generator [15] with system size as seed.
2.1. Euler Number Variation With Diagonal Connection Probability q
Random binary matrices of size 1000 × 1000 were generated for different values of occupation probability p in the range [0, 1] in steps of 0.1. A diagonal connection probability q as described in section (1) is also considered. Clustering, with diagonal connection probability q considered, was done dynamically during the process of generation of the random matrices, to avoid extra re-iterations through the whole lattice. Statistics for χ(p) were collected and averaged over for 100 random matrices for each such value of p. The results have been plotted in Figure 2.
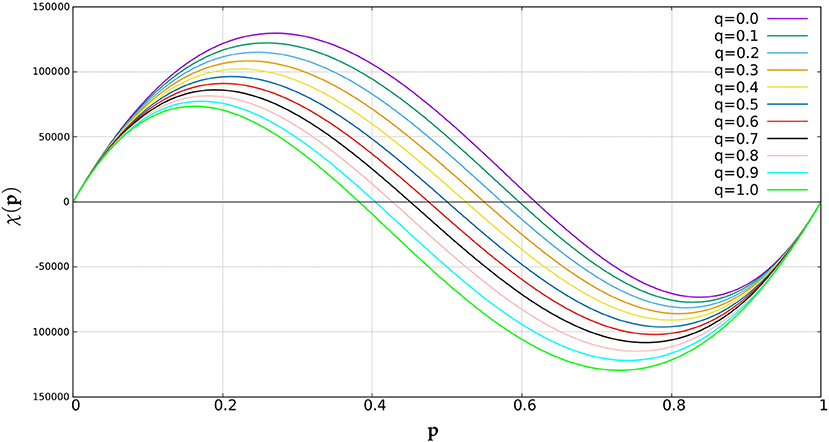
Figure 2. Variation of Euler number χ(p) with site occupation probability p for different values of diagonal connection probabilities q.
Let us call the probability at which the curves for different values of q cross the horizontal axis p0 (which is a function of q). The variation of p0 with q is shown in Figure 3 along with the regression line in blue.
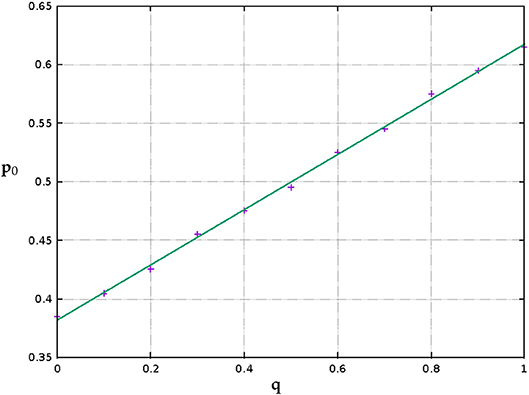
Figure 3. A plot showing how the probability at which there exist an equal number of black and white clusters i.e., p0 varies with diagonal connection probability q. The error bounds lie within the symbol size.
2.2. Variation of Spanning Cluster Percolation Threshold With Diagonal Connection Probability q
Let Π(p, L) be the probability that a square lattice of size L × L percolates at concentration p. We use the notion of site percolation [2, 10] here i.e., for some value of p a path begins to exist between any two opposite pair of edges of the square lattice. In an infinite system we have Π = 1 above pc and Π = 0 below pc. For finite systems Π is expressed as where ν is a critical exponent (which is zero for infinite systems). Φ is a monotonically increasing scaling function which maps values in (−∞, ∞) to (0, 1). Since Π is expected to approach the step function when L → ∞, we might define an effective threshold at the concentration where Π = 1/2. This effective threshold peff approaches the true percolation threshold pc when L → ∞.
The peff's were first determined using a binary search approach. The two initial bounds for p were taken as 0.3 and 0.7. We then iteratively checked for the particular value of p for which percolation probability Π first hit 50%. For each value of p considered during the iterations, the value of Π was determined by averaging over 500 randomly generated square lattices (corresponding to the specific value of p). Three decimal places of accuracy were considered. The reason for choosing 0.3 and 0.7 was that, for all the system sizes and all values of q, Π(p = 0.3) was always 0 and Π(p = 0.7) was always 1. Thus, the percolation threshold had to lie within 0.3 and 0.7 and would not be outside that range in any case. The values were re-checked using the Monte Carlo method described in Stauffer and Aharony [2, p. 73] upto the third decimal place.
We studied the variation of peff for different values of q and L. To be more specific, we calculated peff by averaging over 500 randomly generated binary matrix configurations of sizes L = 125, 250, 500, and 1000 each, with q varying from 0 to 1, in steps of 0.1. The results have been plotted in Figure 4. The “Reference Line” in the figure is the line which passes through the coordinates (0, 0.592) and (1, 0.407) and corresponds to L → ∞ percolation thresholds. The boundary point coordinates of the reference were obtained from the 2005 paper by Malarz and Galam [16]. In between these two boundary points the functional form of the percolation threshold pc is
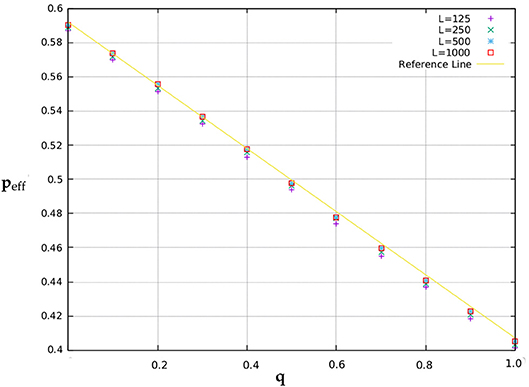
Figure 4. Percolation thresholds for different values of diagonal connection probabilities q and system sizes L. The error bound for the data points is ±0.005.
When only considering the Von Neumann (N2)1 neighborhood the site percolation threshold is approximately 0.592 and when considering the Moore (N2+N3)2 neighborhood the site percolation threshold is approximately 0.407. The first case essentially corresponds to the q = 0 case and the second case corresponds to the q = 1 case.
Furthermore, we used the method of finite size scaling to estimate the actual percolation thresholds pc for different values of q. We know that |peff(L)˘ where ν is a percolation critical exponent which has a standard value of for dimension d = 2 lattices. According to the universality principle the value of the critical exponents is independent of local details [2] as they describe the system in the limit where the correlation length diverges. We performed a power law fit on the (1/L) vs. peff data (for different values of q), obtaining the predicted values of the percolation thresholds as well as the value of , that is, the obtained values of from Equations (1)–(3) turn out to be close to the expected value of (for d = 2 lattices). In Figure 5 the power law fit has been shown for q = 0, q = 0.5, and q = 1, respectively, in a double log scale. The best fit equations for the three values of q, as shown in Figure 5 are as follows: for q = 0
for q = 0.5
and for q = 1
The variation of Π with p for different system sizes L, with q fixed at 0.5, is shown in Figure 6. The intersection of the system sizes indicates a value of 0.500 for the percolation threshold with a percolation probability 64.6%.
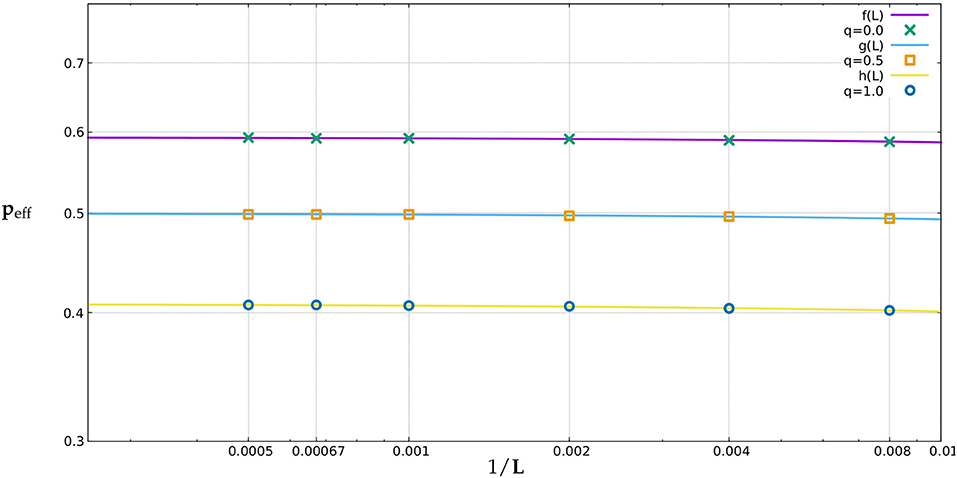
Figure 5. Finite-size scaling using power-law fit, for q = 0, q = 0.5, and q = 1, respectively. Data was collected for L = 125, 250, 500, 1000, 1500, and 2000, peff is plotted against 1000/L in log-log scale. Resulting graphs are linear, the equations are given in the text. The error bounds lie within the symbol sizes.
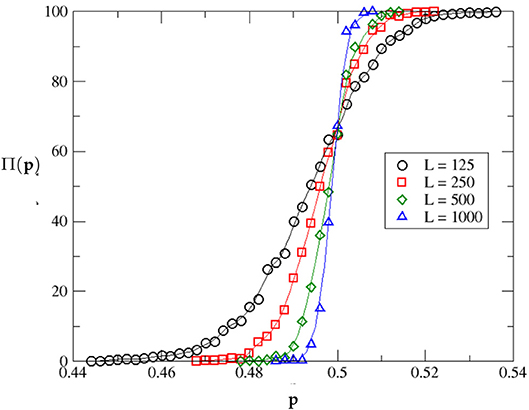
Figure 6. A plot showing the percentage percolation probability Π for different values of site occupation probability p, as obtained from our simulations. Results were averaged over 500 iterations for each system size L. The running average method was used to approximate the data points and estimate the critical percolation probability, which turns out to be 0.499 when diagonal connection probability q is 0.5.
2.3. Size Distribution of Clusters
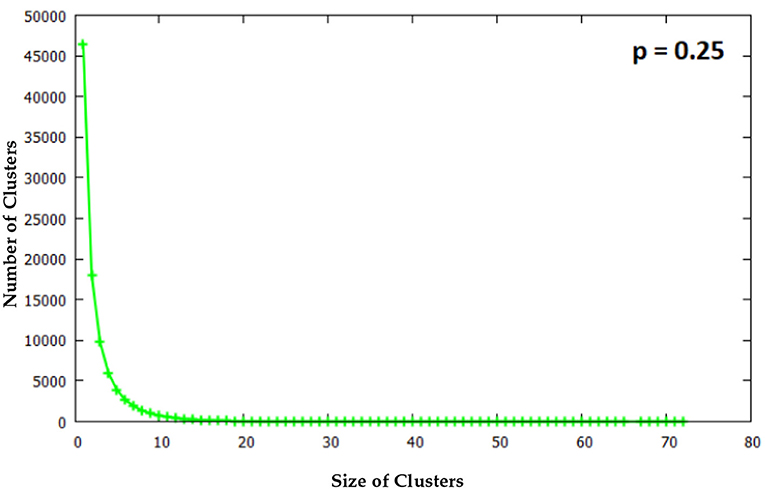
Cluster size statistics for q = 0.5 are shown in Figures 7–9. Data were collected over 100 randomly generated binary matrices with p set at 0.25, 0.5, and 0.75, respectively. The labeling and the subsequent counting of clusters was done using an extended version of the Hoshen-Kopelman algorithm [17] which considers the diagonal connection probability q.
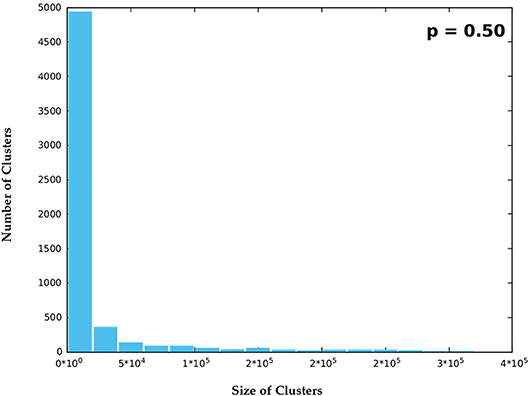
Figure 8. Nearby the critical phase i.e., p = 0.5, clusters are seen to vary over a wide range and hence nearby cluster sizes were binned together to observe the averaged statistics.
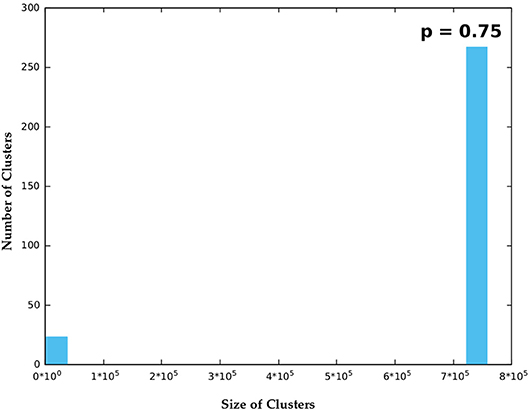
Figure 9. In the super-critical phase when p = 0.75, only a single “large” cluster was seen for each one of the randomly generated binary matrices and a small number of irregularly distributed small clusters.
For p = 0.25 the size of B clusters is confined to within 80 squares and the number of clusters of each size in the whole system is seen to fall exponentially. As the occupation probability p increases further cluster sizes increase by several orders of magnitude and it becomes necessary to bin the data into groups within certain ranges of magnitude. Data for p = 0.5 and p = 0.75 are shown thus in Figures 7–9. Statistics were collected and averaged over 100 randomly generated binary matrices.
It is seen that in Figure 10B, i.e., for p = 0.5 the number of B clusters is non-zero continuously over a wide range of cluster sizes. However, for p = 0.75, clusters are divided into two groups, a small group of small-sized clusters and a large group of very large sized clusters. The two groups are separated by a wide white gap occupied by no B cluster.
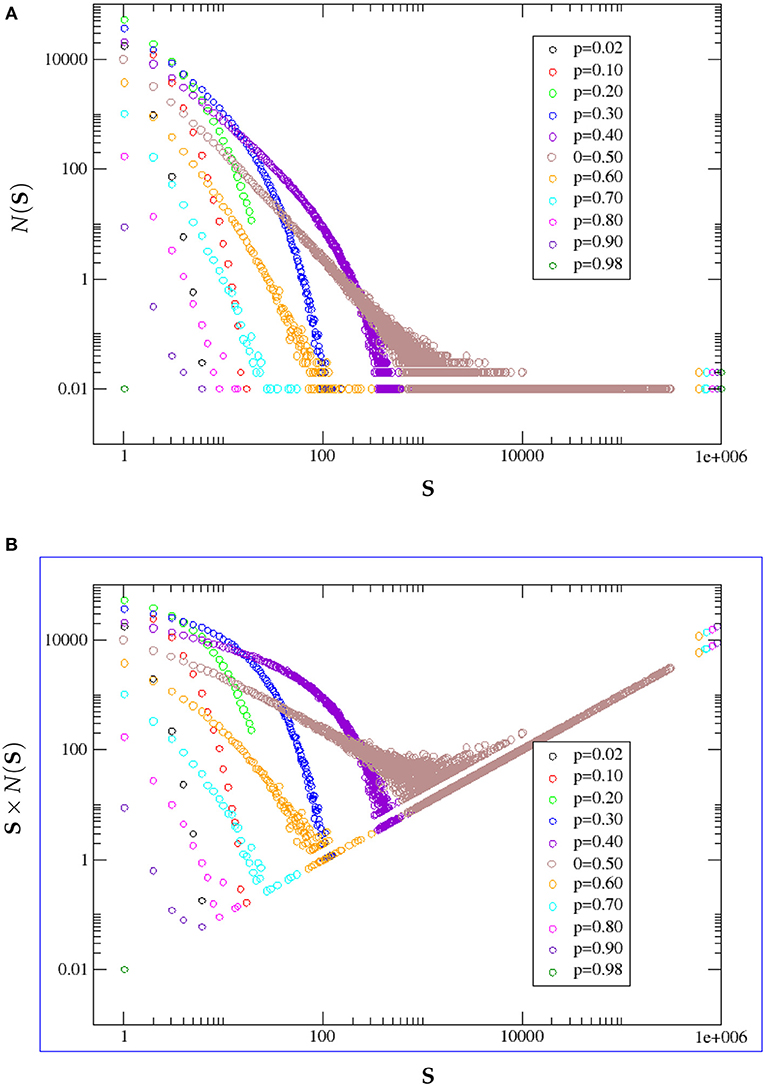
Figure 10. (A) S represents cluster size. N(S) represents the number of clusters of a certain size. Based on our simulations, we plot the nature of variation of N(S) against cluster size S for different values of occupation probability p in double logarithmic scale. (B) N(S) × S, i.e., the total number of B sites in clusters of size S are plotted against S in double logarithmic scale. For each p, statistics were collected over 100 randomly generated binary matrix configurations.
The same data can be presented on a double logarithmic scale, and with slight modifications as well, to bring out some more features clearly, at higher values of p. This is done in Figure 10A.
Figure 10A shows the number of B clusters N(S) of size S as function of S and Figure 10B shows N(S) × S i.e., the total number of B sites in clusters of size S. From both figures it is evident that for p < 0.5 clusters of sizes varying continuously from 1 to a specific value which increases with p occur. However, when p reaches 0.5 clusters of nearly all sizes are present, this is a signature of the percolation threshold. This appears very prominently as a broad continuous patch of color in both Figures 10A,B. As soon as the threshold is crossed clusters are divided into two highly discrete groups, a few very small clusters and a few very large clusters with no clusters of intermediate size. Ultimately at p = 1, there is only one B cluster covering the whole system. Figures 10, 11 results also corroborate this analysis.
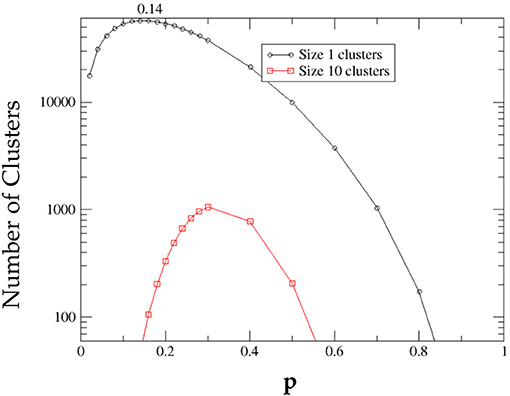
As an example of how the number of clusters of a definite size varies with p we show in Figure 11 the variation of the number of B clusters of sizes 1 and 10. As p starts to increase from 0, initially of course clusters of size 1 are most numerous, their number increases, reaches a peak and then starts to fall, ultimately reaching zero. In the meantime, larger clusters begin to form, the number of size 1 clusters is however never overtaken by clusters of larger size. The numerical results for the number of size 10 clusters is shown here for comparison. Interestingly, this is true in general for clusters of any size larger than 1 and is proved mathematically in Appendix B.
3. Discussion
3.1. Euler Number Variation With Diagonal Connection Probability q
The Euler number graph (Figure 2) varies in an interesting manner as q gradually increases from 0 to 1.
• When q = 0, the connection probability of any two diagonally placed black pixels is 0, whereas the connection probability of any two diagonally placed white pixels is 1. Intuitively speaking, in such a situation, white clusters would have greater joining tendency as compared to black clusters. Thus, at p = 0.5, number of black clusters should exceed the number of white clusters, which in turn implies that χ(0.5) > 0. Also, clearly χ(p) > 0 ∀ p < 0.5. χ(p) would become negative beyond some value of p, say p0, which is greater than 0.5. p0 may be estimated by considering a large number of system configurations at q = 0. However, the value is not deterministic.
• When q = 0.5, the connection probability of any two diagonally placed black pixels is same as the connection probability of any two diagonally placed white pixels i.e., 0.5. In this case, logically, the mean value of p0 considering a large number of system configurations should be 0.5.
• When q = 1, the connection probability of any two diagonally placed black pixels is 1, whereas the connection probability of any two diagonally placed white pixels is 0. Thus, the black clusters would have greater tendency of joining compared to the white counterparts. At p = 0.5, number of white clusters should exceed the number of black clusters, implying χ (0.5) < 0. We can also directly conclude that χ(p) < 0 ∀ p > 0.5 and that χ(p) should change from positive to negative, at some value of p i.e., p0 which should less than 0.5. As mentioned earlier, the value of p0 is not fixed for finite lattices but may be estimated.
Interestingly, when p0, the B occupation probability where the number of black clusters and white clusters are equal, is plotted against q (Figure 3), it is seen that the graph is approximately linear (even for a finite 1000 × 1000 system). Linear regression on the data returns p0 = −0.2396q + 0.6198.
Considering the appearance of the χ(p) graphs in Figure 2 we tried a cubic fit of the form C(p−α)(p−p0)(p−β) = 0. Since the two end roots are nearly 0 and 1 respectively, we considered α = 0 and β = 1. By applying a “constant fit" on the data for C we obtain C = 1.97596 × 10⁶. Thus, for practical (physical) systems we can approximate the Euler number χ as χ(p, q) = (1.97596 × 10⁶)(p−0)(p−1)(p−(−0.2396q+0.6198)) (cf. Figure 12). The figure compares the simulation data for q = 0.0, 0.5, and 1.0 represented by plus, cross and star symbols with respective data from solutions of equation (3.1) represented by continuous red, green and blue lines.
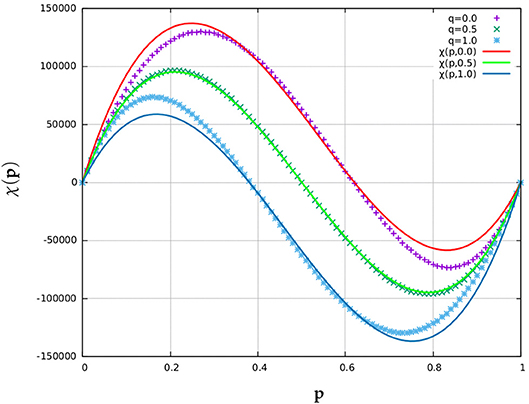
Figure 12. Plot showing the cubic fit χ(p, q) for the Euler number χ = NB − NW statistics, collected over 100 random binary matrix configurations of size 1000 × 1000, when q = 0, q = 0.5, and q = 1, respectively. The cubic approximation works almost perfectly when q = 0.5 but its accuracy decreases as q gradually shifts from 0.5 toward either 0 or 1.
3.2. Variation of Spanning Cluster Percolation Threshold With Diagonal Connection Probability q
A classical definition of percolation phase transition in discrete percolation theory is based on the appearance of spanning clusters [2, 10]. Since we are concerned only with 2 dimensional square lattices Λ ∈ ℤ2 with V = L × L sites, spanning clusters in this context are those clusters of occupied cells which either extend from the left border of the lattice to its right border, or from its bottom border to its top border. For infinite lattices, there exist a particular critical probability Pc, below which the probability of the existence of an infinite spanning cluster is 0 but above which the probability of the existence of an infinite spanning cluster is 1. And indeed, Pc is what we call the “percolation threshold.” On a related note, the probability of the existence of a cluster spanning two given sides of a large box, or more generally, two arbitrary boundary segments, is sometimes referred to as the “crossing probability.” Even for L as small as 100, the probability of the existence of a spanning cluster increases sharply from very close to zero to very close to one within a short range of values of p. This in itself hints at the underlying fact that finite large systems can be related to the L → ∞ limit via the theory of “finite size scaling.”
In Figure 4, the offsets of the data points (w.r.t the Reference Line) for different L's can clearly be seen to decrease with increasing L and are hence expected to become zero in the infinite limit.
3.3. Size Distribution of Clusters
The nature of cluster sizes in the subcritical, critical, and supercritical phases has always been an important topic of study in percolation theory. We will discuss all the three phases one by one.
• Subcritical Phase: In the subcritical phase, p < pc, the number of clusters of a certain size falls exponentially with the size. Further detailed discussion on this aspect are to be found in Grimmett [10], Menshikov [18], Aizenman and Barsky [19], and Kesten [20].
• Critical Phase: In the critical phase, where p approaches pc sufficiently quickly as L → ∞), the ratio between the largest cluster size M1 and the second largest cluster size M2 follows a scaling law [21]. A detailed study of this feature may be planned in future for a range of q values within the critical phase.
• Supercritical Phase: In the supercritical phase, with p tending to 1 as L → ∞, the largest B cluster in an L×L system is of order approaching the system size. Moreover, the expectation value of the second largest cluster is sublinear in total number of sites [22].
In our simulations the above characteristics appear to be present for all q, and we may thus conclude that the basic nature of cluster size distributions does not vary significantly with q and L (provided L is sufficiently large, that is, at least 100).
4. Comparison With the Island-Mainland (IM) Transition Model
In Khatun et al. [1], dealt with random binary square lattices where cross connections were permitted. That is, say d0 is the probability of white cells being diagonally connected at crossover points, while d1 is the probability of black cells being diagonally connected at crossover points. They considered both d0 and d1 to be 1. We successfully reproduced their simulations and verified the finite size-scaling limit (i.e., L → ∞) of Pa1 and Pa2, where Pa1 is the value of p at which the number of black clusters NB peaks and Pa2 is that value at which the number of white clusters NW peaks. The limiting values are named pmaxB and pmaxW. We further performed finite size-scaling on the global maxima and minima of the Euler number curves χ(p), using the data generated for system sizes L = 125, 250, 500, and 1000 (averaged over 100 iterations, as before). Let us call them pχmax and pχmin respectively. In the L → ∞ limit, the values turn out to be 0.216±0.098% and 0.791±0.196%, as illustrated in Figure 13.
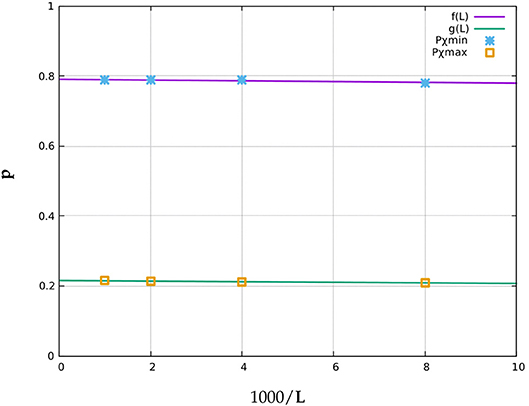
Figure 13. Finite size-scaling on the maxima pχmax (squares) and minima pχmin (star symbols) of the Euler number curves for system sizes L = 125, 250, 500, and 1000. Here f(L) = 0.7906 − 0.0010(1000/L) and g(L) = 0.2303 − 0.0027(1000/L).
In the same paper, pc1 was defined to be that critical value of probability p, at which NW increases from 1 to a value >1 i.e., the continuous white background breaks into two or more parts. Similarly, pc2 was defined to the critical value of p at which the disjoint black clusters join to form a single large black cluster i.e., NB reduces to 1.
It was conjectured there, that pc1 and pc2 coincide with the maximum and minimum of the Euler number curve - pχmax and pχmin respectively as L → ∞. However, here it is (see Appendix A) mathematically proved that as L → ∞, pc1 → 1 and pc2 → 0 as L → ∞, whereas from finite size scaling pχmax and pχmin tend respectively to the non-trivial values close to 0.2 and 0.8, respectively. So, the quantities which survive finite size scaling are the two points where the derivative of χ(p) with respect to p vanish or
This implies that for a vanishingly small increase in p, say deposition of one black square, the change in the number of black clusters equals the change in the number of white clusters, or
and similarly, for pa2.
Adding a black site can increase NB when a new black square falls on a white site surrounded by eight others and can decrease NB if the new black site unites two disjoint black clusters. The difference of these two quantities contributes to the left-hand side of above equation. On the right-hand side, NW can increase by a adding a black site, if it separates an existing white cluster into two disjoint clusters. Here NW can decrease if the new black site falls in an existing isolated black site.
In a real situation for example wetting/dewetting experiments, evaporation or condensation may not be random, but controlled by factors such as surface tension or adhesion. In such cases, these factors will control the probabilities of the above occurrences. Exploring such possibilities may be a useful application of the discussions presented.
Khatun et al. [1] described some experiments where the minimum in χ(p) was very close to the point where the background first broke up into disjoint clusters. We see here that for infinite systems this is not strictly true but is more or less satisfied for real finite systems.
5. Conclusion
In this article we generate a strictly two-dimensional square lattice with a range of connection probabilities q varying from 0 to 1, between second neighbor (diagonally placed) sites of same color (black or white). Nearest neighbor, i.e., edge-sharing sites of same color are always connected. This new feature ensures that black and white clusters are uniquely defined and not entangled or intertwined. The intertwining in the work of Feng et al. [9] and the quasi 3-dimensional nature in the work by Khatun et al. [1] are thus avoided. Mertens and Ziff [12] studied a special case of this problem with the Euler characteristic defined for the matching lattice. We have determined percolation thresholds for the whole range of q and they are found to vary linearly. For the symmetric case with q = 0.5 cluster size distributions and some other statistics have been determined.
We also point out an inconsistency in Khatun et al. [1]. It was shown there that the maxima and minima for the Euler number χp converge to non-trivial values in the L → ∞ limit and it was suggested that these values are identical to the values of p where the white background broke up from a single connected cluster to more than one white and the single black cluster broke up into more than one black cluster. These points were named as IS(island) → MP(mixed phase) and MP → ML(mainland) transitions respectively. However, it is demonstrated here that these transitions do not survive finite size scaling as elaborated in Appendix A and are therefore not critical phase transitions. For real systems of finite size however, these observations work quite well.
An interesting difference is observed between the Euler number curve obtained in Khatun et al. [1] with intertwined clusters and the Euler number curves in the present work. Khatun et al. found inflection points in the Euler number curve corresponding to the values of the percolation thresholds. The Euler number curves in the present paper are smooth for all q with no inflection points.
We may conclude by emphasizing the importance of the Euler number curve, in a percolating system under varied conditions of connection (such as varying q). Similar to the percolation threshold, the Euler number also survives finite size scaling.
Problems worth further investigations in the future may be (i) finding an explanation for the linearity of the p0 vs. q graph seen in Figure 3 and (ii) working out a mathematical expression for the Euler number graphs for general values of q and p as obtained in Figure 2.
Author Contributions
SD and SS undergraduate students at Jadavpur University, carried out the numerical computations and worked on the mathematical analysis involved. The problem was conceived by ST and the project was carried out under the guidance of ST, TD, and TK.
Conflict of Interest Statement
The authors declare that the research was conducted in the absence of any commercial or financial relationships that could be construed as a potential conflict of interest.
Acknowledgments
SD and SS acknowledge the support provided by the Condensed Matter Physics Research Centre, Jadavpur University during the period of the research project.
Supplementary Material
The Supplementary Material for this article can be found online at: https://www.frontiersin.org/articles/10.3389/fphy.2019.00061/full#supplementary-material
Footnotes
1. ^The neighborhood composed of a central cell and its four adjacent cells, on a two-dimensional square lattice.
2. ^The neighborhood composed of a central cell and the eight cells which surround it, on a two-dimensional square lattice.
References
1. Khatun T, Dutta T, Tarafdar S. “Islands in sea” and “lakes in mainland” phases and related transitions simulated on a square lattice. Eur Phys J B. (2017) 90:213. doi: 10.1140/epjb/e2017-80365-3
2. Stauffer D, Aharony A. Introduction to Percolation Theory. 2nd ed. London: Taylor and Francis (2003).
3. Dey S, Bhattacharya BB, Kundu MK, Bishnu A, Acharya T. A co-processor for computing the euler number of a binary image using divide-and-conquer strategy. Fund Inform. (2007) 76:75–89.
4. Vogel H-J, Hoffmann H, Roth K. Studies of crack dynamics in clay soil: I. Experimental methods, results, and morphological quantification. Geoderma (2005) 125:203–11. doi: 10.1016/j.geoderma.2004.07.009
5. Al Faqheri W, Mashohor S. A real-time malaysian automatic license plate recognition (m-alpr) using hybrid fuzzy. Int J Comput Sci Netw Secur. (2009) 9:333–40.
6. Vatsa M, Singh R, Mitra P, Noore A. Signature verification using static and dynamic features. In: International Conference on Neural Information Processing. Berlin: Springer (2004). p. 350–5.
7. Wong LP, Ewe HT. A study of nodule detection using opaque object filter. In: 3rd Kuala Lumpur International Conference on Biomedical Engineering 2006. Berlin: Springer (2007). p. 236–40.
8. Zhang C, Qiu Z, Sun D, Wu J. Euclidean quality assessment for binary images. In: 18th International Conference on Pattern Recognition (ICPR'06), Vol. 2. New York, NY: IEEE (2006). p 300–3.
9. Feng X, Deng Y, Blöte HWJ. Percolation transitions in two dimensions. Phys Rev E. (2008) 78:031136. doi: 10.1103/PhysRevE.78.031136
12. Mertens S, Ziff RM. Percolation in finite matching lattices. Phys Rev E. (2016) 94:062152. doi: 10.1103/PhysRevE.94.062152
13. Sykes MF, Essam J W. Some exact critical percolation probabilities for bond and site problems in two dimensions. Phys Rev Lett.(1963) 10:3–4. doi: 10.1103/PhysRevLett.10.3
14. Choudhury MD, Dutta T, Tarafdar S. Pattern formation in droplets of starch gels containing nacl dried on different surfaces. Colloids Surf A Physicochem Eng Aspects. (2013) 432:110–8. doi: 10.1016/j.colsurfa.2013.04.064
16. Malarz K, Galam S. Square-lattice site percolation at increasing ranges of neighbor bonds. Phys Rev E. (2005) 71:016125. doi: 10.1103/PhysRevE.71.016125
17. Hoshen J, Kopelman R. Percolation and cluster distribution. i. cluster multiple labeling technique and critical concentration algorithm. Phys Rev B. (1976) 14:3438–45. doi: 10.1103/PhysRevB.14.3438
18. Men'shikov M. Coincidence of critical points in percolation problems. Sov. Math. Doklady. (1986) 33:856–9.
19. Aizenman M, Barsky DJ. Sharpness of the phase transition in percolation models. Commun Math Phys. (1987) 108:489–526. doi: 10.1007/BF01212322
21. Yong Z, Zi-Qing Y, Xin Z, Xiao-Song C. Critical behaviors and universality classes of percolation phase transitions on two-dimensional square lattice. Commun Theor Phys. (2015) 64:231. doi: 10.1088/0253-6102/64/2/231
Keywords: square-lattice, Euler-number, scaling theory, second-nearest-neighbor, percolation theory
Citation: Dutta S, Sen S, Khatun T, Dutta T and Tarafdar S (2019) Euler Number and Percolation Threshold on a Square Lattice With Diagonal Connection Probability and Revisiting the Island-Mainland Transition. Front. Phys. 7:61. doi: 10.3389/fphy.2019.00061
Received: 01 December 2018; Accepted: 08 April 2019;
Published: 01 May 2019.
Edited by:
Ferenc Kun, University of Debrecen, HungaryReviewed by:
Geza Odor, Institute for Technical Physics and Materials Science (MTA), HungaryBappaditya Roy, IITB-Monash Research Academy, India
Copyright © 2019 Dutta, Sen, Khatun, Dutta and Tarafdar. This is an open-access article distributed under the terms of the Creative Commons Attribution License (CC BY). The use, distribution or reproduction in other forums is permitted, provided the original author(s) and the copyright owner(s) are credited and that the original publication in this journal is cited, in accordance with accepted academic practice. No use, distribution or reproduction is permitted which does not comply with these terms.
*Correspondence: Sujata Tarafdar, c3VqYXRhJiN4MDAwNUY7dGFyYWZkYXJAaG90bWFpbC5jb20=
 Sanchayan Dutta
 Sugata Sen
 Tajkera Khatun
 Tapati Dutta
 Sujata Tarafdar