- 1Research Institute for Electronic Science, Hokkaido University, Sapporo, Japan
- 2Graduate School of Information Science and Technology, Hokkaido University, Sapporo, Japan
Laser scanning microscopy using high-peak-power ultrashort near infrared light pulses can visualize biological microstructures by utilizing non-linear optical processes, such as multi-photon excitation and sum frequency generation. Here we introduced a polarization-resolving detection methodology for a laser scanning microscopy system equipped with a spinning-disk confocal scanner. The developed system achieved high-speed intravital imaging of living tissues with resolving their signals to orthogonally polarized components. First, we applied the system to a liposomal vesicle labeled with the fluorescent lipophilic dye and confirmed the orientation map of the lipid bilayer. Next, by detecting polarization-resolved second harmonic generation signals, the structural orientations of the collagen fibers in fixed mouse tissues were visualized without exogenous or genetic fluorophore labeling. Finally, we demonstrated in vivo polarization-resolved second harmonic generation imaging of the collagen fibers in the mouse skeletal muscles at a 56 Hz temporal resolution. We expect that our developed methodology can achieve real-time visualization, thus, revealing the conformational changes of supramolecular structures in living animals.
Introduction
Second harmonic generation (SHG) is a non-linear optical process that can be applied for bioimaging [1, 2]. Two photons from ultrashort high-peak-power laser pulses are converted to a single photon, and its wavelength becomes halved via SHG processes. SHG signals are strongly observed from individual non-centrosymmetric molecules, especially when they are arranged in a crystalline array, such that SHG signals are frequently generated by endogenous fiber-like structures like supercoiled collagens fibers and thick myosin filaments [3]. Moreover, the probability of SHG occurring largely depends on the relative orientation between the polarization of the incident light beam and the orientation axis of the targeted molecules. Therefore, polarization-based SHG imaging, the concept of which is based on analyzing the polarization anisotropy of SHG light or SHG signal intensity as a function of the polarization state of the incident light beam, can be implemented to reveal the structural assembly information of targeted molecules [4–6] and has been used as a tool for medical and biological analyses [7–9]. However, most of polarization-based SHG microscopy requires a specialized optical setup to irradiate the sample with the excitation laser light beam, capture, and/or analyze the SHG light signals.
Simple SHG images can be acquired by using a laser scanning microscope equipped with an ultrashort high-peak-power laser light source such as a conventional two-photon excitation fluorescence microscope (TPM) [2, 10]. Since most of TPM systems employ a single-point laser scanning method using moving mirrors, their temporal resolution depends on the speed of the physical movement of the mirrors. However, since early 21st century, multi-point laser scanning methods have been attempted to achieve high-speed TPM imaging [11]. One method is introducing multiplexed beams generated by a microlens array [12] or a cascade of beam splitters [13, 14] into a moving mirror scanning unit. Another is utilizing a spinning-disk scanning unit, which incorporates a micro-lens array disk and a Nikpow disk containing a set of confocal pinholes [15, 16]. The spinning-disk scanning unit scans a specimen with several 100 excitation beams. However, the insufficient energy of conventionally-used mode-locked titanium-sapphire (Ti-Sa) laser light sources restricted the number of excitation beams, resulting in a narrow effective field of view (FOV) of TPM utilizing the spinning-disk scanning unit (TPM-SD). Although Shimozawa et al. modified spinning-disks to increase near infrared laser light power throughput, the system using a Ti-Sa laser light source could use 10% of the effective area of the detector, which corresponded to ~40 μm diameter FOV with a 60 × objective lens [15]. To enlarge the FOV further, we introduced a higher-peak-power ytterbium (Yb)-based laser light source to the TPM-SD system, achieving approximately 10-times larger FOV [16].
In this study, we developed a high-speed, polarization-resolved imaging methodology by introducing a polarizing beam splitter cube to an image splitting optical unit in front of the detection camera in our TPM-SD system. The developed system performed in vivo tissue imaging at a 56 Hz temporal resolution, thus, revealing the structural orientations of collagen fibers without exogenous or genetic labeling.
Materials and Methods
Optical Setup
Figure 1A shows a schematic diagram of our TPM-SD system. The system was equipped with a Yb-based laser (femtotrain; Spectra Physics, Santa Clara, CA) that generated femtosecond light pulses with a wavelength of 1,042 nm (averaged power: 4 W, pulse width: 300 fs, repetition rate: 10 MHz) [16]. Laser power was adjusted by using a set of a half-wave plate and a Glan-Laser polarizer. The beam width was enlarged to ~10 mm in diameter by applying a beam expander comprising a pair of plano-convex lenses. This enlarged beam was introduced into a spinning-disk scanner with 100 μm-wide pinholes aligned on a Nipkow disk (CSU-MP φ100; Yokogawa Electric, Kanazawa, Japan) [15, 16] installed on an inverted microscope (Eclipse Ti-E; Nikon, Tokyo, Japan). The incident excitation light beam was introduced at the pupil of the water immersion objective lens (Plan Apo IR 60X, numerical aperture: 1.27, working distance: 0.17 mm; Nikon) and focused on multiple points of a specimen. In order to adjust the polarization state of the beam at the position of the objective lens, a half-wave plate and a quarter wave plate were placed in the optical path of the excitation laser light beam [17]. To measure the polarization state of the incident light beam at the specimen, a linear polarizer film was placed just after the objective lens, and angle dependent throughput was measured and plotted in polar coordinates (Figures 1B–F). In this study, we used circularly polarized light (Figure 1B; ellipticity 0.95) and 4 kinds of laterally angled linearly polarized light beams (Figures 1C–F; ellipticity 0.2–0.3). Lateral polarization angles were set to 0, 45, 90, and 135° from the horizontal axis of the FOV.
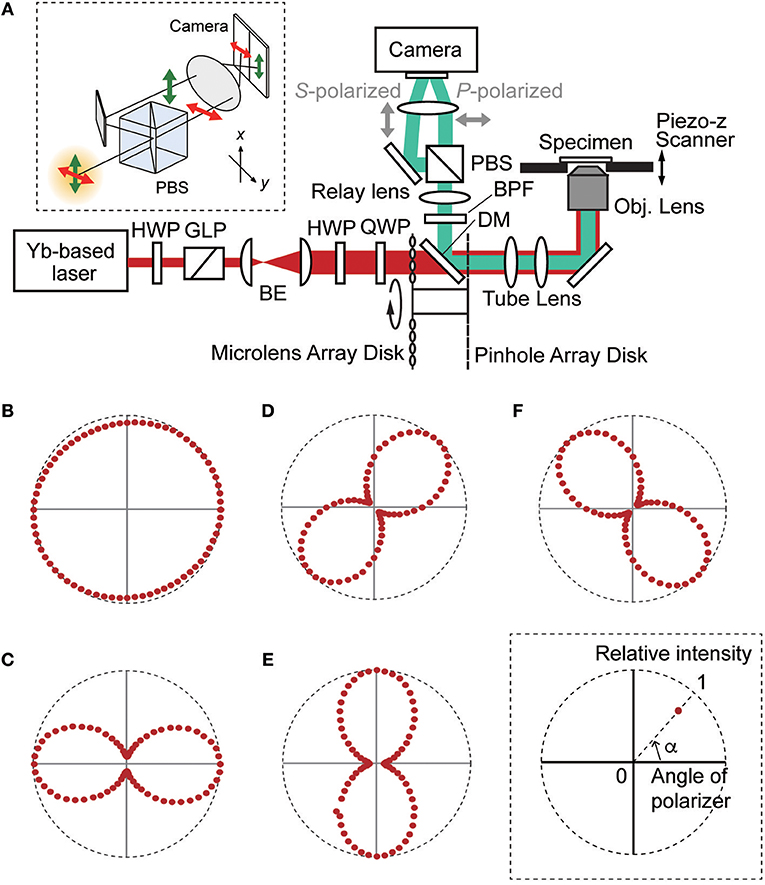
Figure 1. (A) Optical setup of the developed TPM-SD system. BE, beam expander; BPF, band pass filter; DM, dichroic mirror; GLP, Glan-Laser polarizer; HWP, half-wave plate; PBS, polarizing beam splitter cube; QWP, quarter-wave plate. The upper inset panel is the schematic diagram of the polarization-resolving detection. (B–F) The polarization state of the incident light pulse at the specimen by adjusting the positions of HWP and QWP. (B) Circular polarization (ellipticity: 0.95). (C–F) Linear polarization for which the polarization angle from the horizontal axis of the FOV is 0° (ellipticity: 0.28), 45° (ellipticity: 0.27), 90° (ellipticity: 0.27), and 135° (ellipticity: 0.24), respectively. The lower inset panel indicates the schematic used for plotting the relative intensities on the polar coordinate.
Fluorescent or SHG light acquired by the objective lens was passed through the Nipkow disk, reflected by the first dichroic mirror (700–1,100 nm band pass; Yokogawa Electric), and passed through two infrared ray cut filters (FF01-770/SP-25 × 2; Semrock, Rochester, NY). In the case of SHG imaging, we added a band pass filter (FF01-520/15-25; Semrock) to remove autofluorescence. Optically filtered signals were separated into one pair of polarization-resolved signals using a polarizing beam splitter cube (PBSH-450-700-100; CVI Laser Optics, Albuquerque, USA) placed in an image-splitting optical unit (W-View Gemini; Hamamatsu Photonics, Hamamatsu, Japan); then, they were focused on a square-shaped detection area of electron multiplying CCD camera (iXon Ultra 897: 512 pixels × 512 pixels, pixel size: 16 μm × 16 μm; Andor Technology, Belfast, UK) using relay lenses with a magnification of × 1.2, thus simultaneously acquiring one pair of rectangular images. Z-scans were performed with a piezo actuator (P-721; Physik Instrumente, Karlsruhe, Germany). NIS-Elements C software (Nikon) was used to acquire all images. To confirm the signal intensity ratio of the polarization-resolved components, TPM images of a sulforhodamine B solution (0.1 mM in water) were produced by the system. As Figure 2 shows, the fluorescent intensities of both components were almost same and were independent of the incident light polarization.
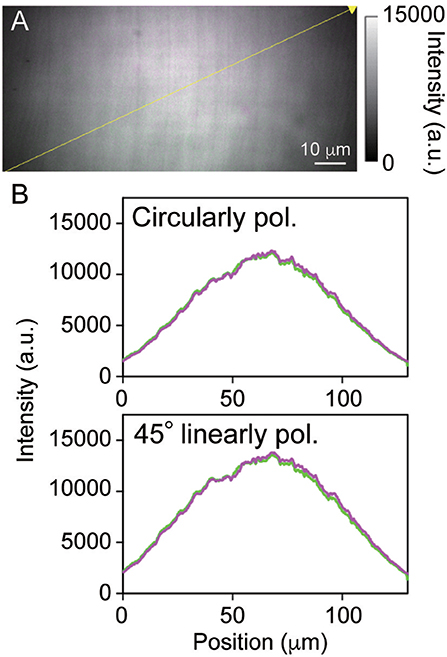
Figure 2. (A) A two-photon excitation fluorescent image of a sulforhodamine B solution. (B) Fluorescent intensity profiles taken along the yellow line in the fluorescent image between the s- and p-polarized components, here colored in green and magenta, respectively. The upper and lower panels show circularly polarized and 45° linearly polarized excitation light irradiation, respectively. The exposure time was 90 ms, the pixel size was 230 nm × 230 nm, and the FOV size was 118 μm × 55 μm (512 pixels × 240 pixels).
Sample Preparation
Liposomal vesicles were prepared from pancreatic acinar cells of C57BL/6NCrSlc mice (9 weeks old, male). The acini were digested by collagenase (1 mg/ml) followed by gentle trituration. Then they were dispersed in a small chamber with a solution containing 140 mM NaCl, 5 mM KCl, 2 mM CaCl2, 1 mM MgCl2, 10 mM HEPES-NaOH, and 10 mM glucose (pH 7.3) [18]. To label the plasma membranes, the acini were immersed in an extracellular solution containing fluorescent probes (0.5 μM FM4-64; Molecular Probes).
Tissues from C57BL/6NCrSlc mice (8–12 weeks old, male) were used as specimens for polarization-resolved SHG imaging. For fixed tissue imaging, quadriceps in the hind limbs and skin in the abdomen of mice were dissected, fixed overnight in 4% PFA at 4°C, and rinsed three times with a phosphate buffer solution. For in vivo observations of fascia-muscles, mice were anesthetized through intra-peritoneal injection of pentobarbital (10 mg/kg), and their quadriceps in the hind limbs were exposed by skin incisions. The mice were maintained anesthetized during the entire imaging process. The study was carried out in accordance with the recommendations in the Guidelines for the Care and Use of Laboratory Animals of the Animal Research Committee of Hokkaido University. The Institutional Animal Care and Use Committee of National University Corporation Hokkaido University approved all protocols (Permit Number: 17-0077).
Results
First, we applied the developed TPM-SD system to the imaging of a liposomal vesicle labeled with a lipophilic fluorescent dye, FM4-64. As Figure 3A shows, a pair of orthogonally-resolved polarization images of the plasma membrane were simultaneously captured under circularly polarized excitation light beam irradiation. Each fluorescent image reflected the anisotropic nature of the emitting dipole of the FM4-64 molecules in the focal plane, as shown in Figure 3B. This indicates that dipole moments of the FM dye were almost orthogonal to the plane of the membrane since FM4-64 molecules are usually integrated vertically into the outer leaflet of the membrane lipid bilayer [19]. Fluorescent intensity profiles along circumference were not perfect isotropic pattern because the liposomal vesicle was prepared from mouse pancreatic acinar cells and might include many other components besides lipid molecules. However, fluorescent signal intensities of both images were almost same likewise images of the dye solution (Figure 2), suggesting that intensity standardization between two channels was unnecessary.
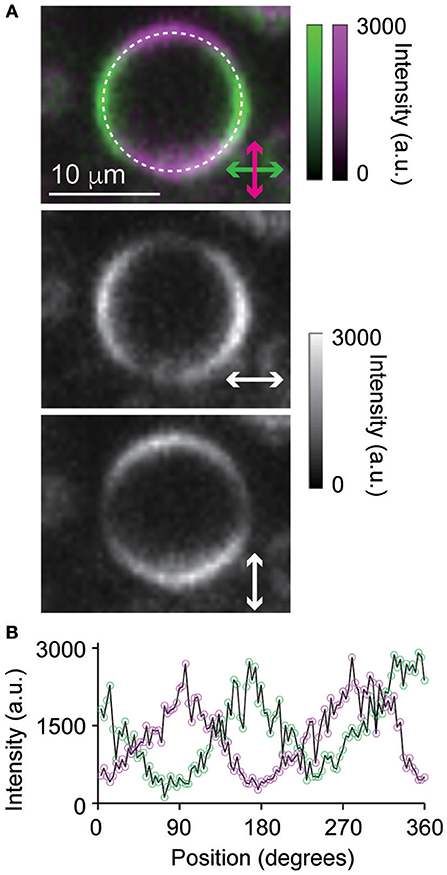
Figure 3. (A) Polarization-resolved, two-photon excitation fluorescence images of a liposomal vesicle labeled with FM4-64 and excited by circularly polarized light pulses. (B) The intensity profiles of the polarization-resolved, two-photon excitation fluorescence extracted from (A) along the white, dashed circle. The exposure time was 300 ms, the pixel size was 230 nm × 230 nm, and the FOV size was 23 μm × 18 μm (98 pixels × 77 pixels).
Next, we visualized three-dimensional objects from cross-sectional images of non-labeled biological specimens. First, we irradiated a circularly polarized beam to a fixed mouse skin sample from the dermal side and acquired a pair of orthogonally-resolved polarization SHG images from the surface to a depth of 50 μm. As Figure 4A shows, complicated collagen fiber network structures were visualized and the signal ratios between the two channels appeared to reflect their orientations. However, each polarization-resolved SHG image was detected on the alternative channel to the side where it was expected. Namely, a collagen fiber having an axis oriented at a particular angle appeared to emit orthogonally polarized SHG light under circularly polarized light beam irradiation. Next, we applied linearly polarized light beams to the same specimen, as shown in Figures 4B–E. As expected, each polarization-resolved image was detected on the channel for which the detectable angle of polarized lights was parallel to the collagen fiber axis. Light beam with 0 and 90° linear polarization from the horizontal axis of the FOV enhanced the SHG signals from the collagen fibers corresponding to their orientation with respect to the polarization angle. On the other hand, 45 and 135° linearly polarized light beam irradiation resolved various orientations of the collagen fibers to two channels equally. Reconstructed SHG image under irradiation of 45° linearly polarized light beam is displayed in Figure S1. Although the SHG intensities of the cross-sectional image were decreased with depth from the surface, each channel appeared to detect SHG signals of the corresponding orientation of collagen fibers in the entire FOV. This fact suggested that scattering from the specimens did not affect polarization states of SHG signals in this measurement condition. We also applied the same measurements for other tissue, a fixed skeletal muscle (Figures 5A–E). The results of a skeletal muscle sample showed a similar tendency with that of a skin sample, indicating that the detected s- and p-polarized SHG signals from the collagen fibers were reversed between linearly and circularly polarized light beam irradiation. In addition, although we also applied circularly polarized light beam with opposite directions of rotation to the same specimens, the results exhibited the same tendency.
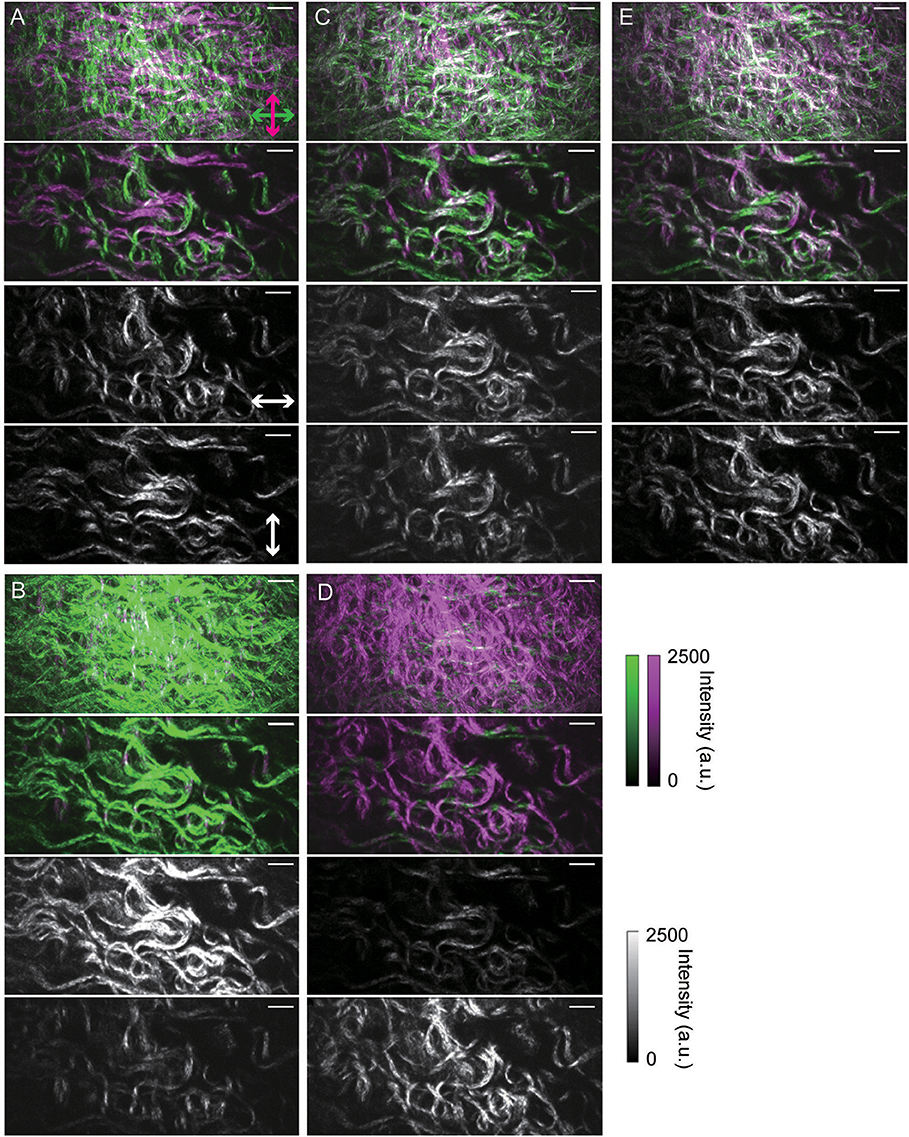
Figure 4. Polarization-resolved SHG images of collagen fibers in a fixed mouse skin sample. (A) Under irradiation of circularly polarized light. (B–E) Under irradiation of linearly polarized light. Images taken when lateral polarization angles were set to 0, 45, 90, and 135° from the horizontal axis of the FOV are shown in (B–E), respectively. In (A–E), the upper images are maximum intensity projection SHG images from Z-stacks (50 μm thick) taken at 1.0 μm intervals. The upper-middle, lower-middle, and lower images are merged, horizontal, and vertical SHG images taken 13 μm from the specimen surface, respectively. In each sectioned image, the exposure time was 300 ms, the pixel size was 230 nm × 230 nm, and the FOV size was 118 μm × 56 μm (512 pixels × 242 pixels). Scale bars indicate 10 μm length.
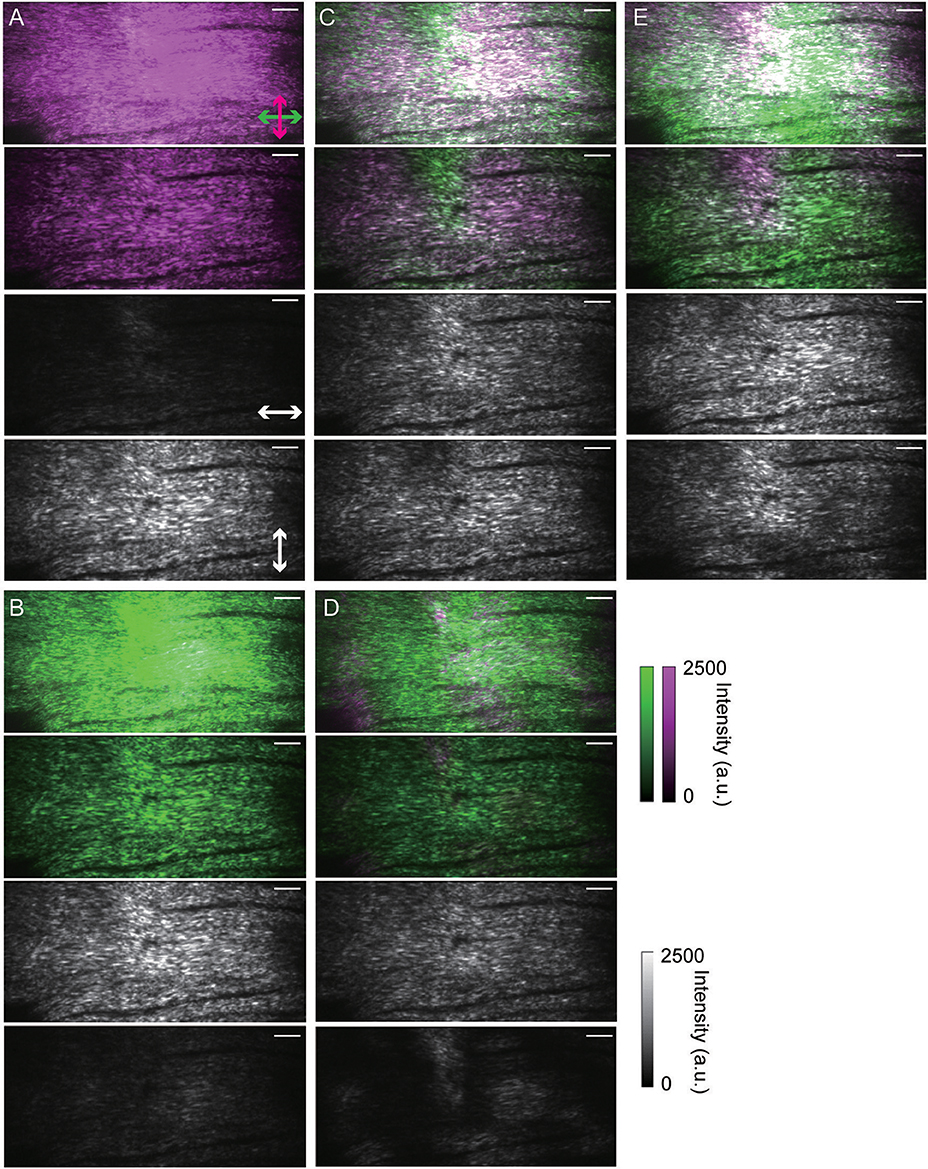
Figure 5. Polarization-resolved SHG images of collagen fibers in a fixed mouse skeletal muscle sample. (A) Under irradiation of circularly polarized light. (B–E) Under irradiation of linearly polarized light. Images taken when lateral polarization angles were set to 0, 45, 90, and 135° from the horizontal axis of the FOV are shown in (B–E), respectively. In (A–E), the upper images are maximum intensity projection SHG images from Z-stacks (50 μm thick) taken at 1.0 μm intervals. The upper-middle, lower-middle, and lower images are merged, horizontal, and vertical SHG images taken 24 μm from the specimen surface, respectively. In each sectioned image, the exposure time was 300 ms, the pixel size was 230 nm × 230 nm, and the FOV size was 118 μm × 56 μm (512 pixels × 242 pixels). Scale bars indicate 10 μm length.
Finally, we demonstrated in vivo polarization-resolved SHG imaging of mouse skeletal muscles. As the excitation, we applied a linearly polarized laser light beam with a 45° angle from the horizontal axis of the FOV. As Figure 6 shows, we successfully captured polarization-resolved SHG images of a fascia tissue with a sufficiently strong signal in 18 ms (56 fps). Figures 6A–O shows the time series of the captured polarization-resolved SHG images during one cardiac beat of a living mouse. Although the focal plane drifted slightly according to the cardiac beat, the network structure of the collagen fibers was mostly maintained. In addition, images after approximately 5 min of measurement were not different from the initial state, as shown in Figure 6P. This suggests that our measurements were not invasive, i.e., they did not affect the collagen fiber network structure and have the potential to reveal real-time structural changes in nature.
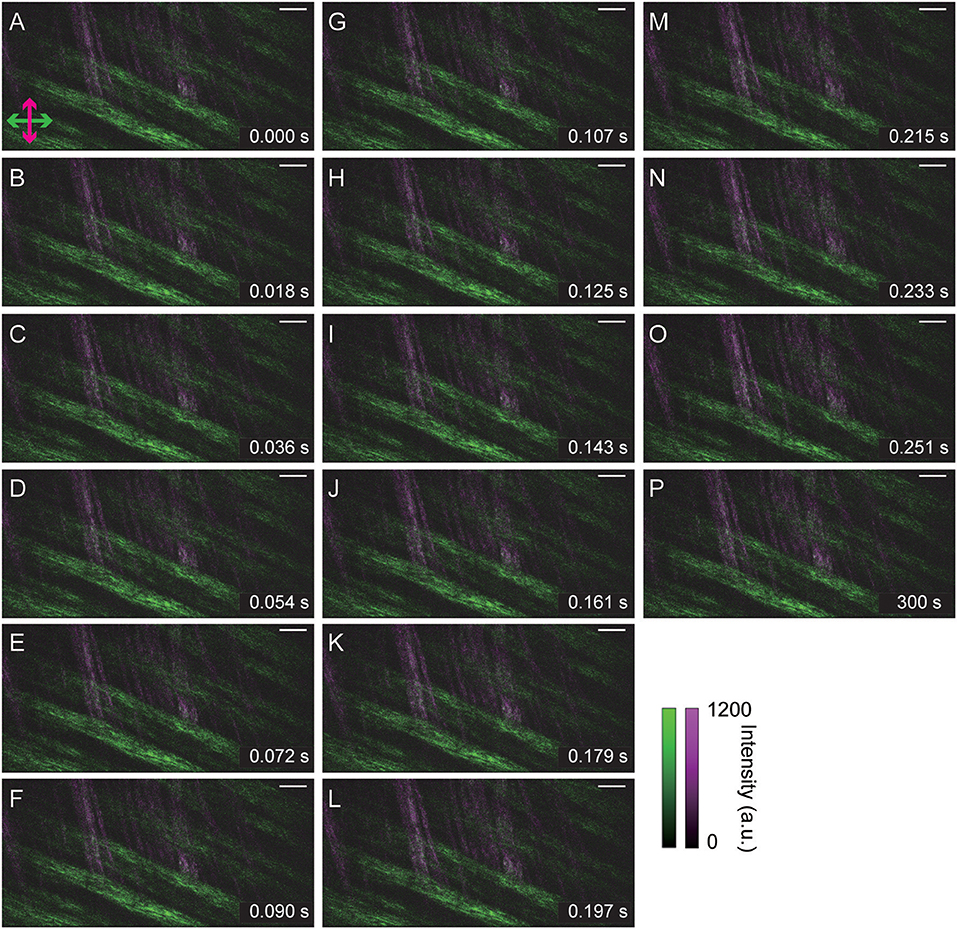
Figure 6. In vivo polarization-resolved SHG images of a mouse skeletal muscle taken 10 μm from the surface of the living specimen. (A–O) Time series during one cardiac beat. (P) After ~5 min measurement. In each image, the exposure time was 18 ms, the pixel size was 230 nm × 230 nm, and the FOV size was 118 μm × 56 μm (512 pixels × 244 pixels). Scale bars indicate 10 μm length.
Discussion
Since most of the SHG light is emitted parallel to the incident light beam, detectable signals in the forward direction are several times stronger than those in the backward direction [20]. Thus, most SHG microscopy systems have adopted advanced techniques that enable the collection of backward and forward signals. However, such specialized optical configurations are difficult to construct and to apply to large-scale specimens like living animals. In comparison, our developed polarization-resolved microscopy system is compact and is composed of a pulsed laser light source, a spinning-disk confocal scanning unit, an inverted microscope, an image splitting optical unit, and an electron multiplying CCD camera. By using this system, we were able to demonstrate 56 Hz, polarization-resolved SHG imaging by exclusively capturing backward signals from a large living animal (Figure 6). This success might be attributable to the high-peak-power laser light source. In most TPM or SHG microscopy setups, light pulses of <100 fs are used, as generated by a Ti-Sa laser light source oscillating at approximately 80 MHz. Compared with the representative 800 nm or 950 nm pulse energy generated by a Ti-Sa laser light source, the light pulses generated by the Yb-based laser light source used in this study possessed approximately a 4-times or 8-times higher pulse energy, respectively. Since the total SHG light and two-photon excitation fluorescent intensities are proportional to the squared value of the irradiated photon number [1, 21], our excitation light irradiation condition should result in approximately 6.5–20 times brighter total signal intensities. Without this magnification, polarization-resolved image pairs shown in Figure 6 could not have been distinguished.
Recently, TPM systems using a two-dimensional detector, such as this TPM-SD system, a light-sheet microscopy-based system [22] and an image scanning microscopy-based system [12], have been prevalent. Merits of these cameras include ease to replace them, recent technical developments to improve the sensitivity, and/or lower prices. As this study demonstrated, the convenience of combining the system with image splitting optical units, which have been developed by several companies and are commercially available, might also be merit. As we show here, without complicated and expensive modification of the detection optics, placing a polarizing beam splitter cube into the optical unit enables polarization-resolved imaging.
For quantitative analysis, the perturbations of polarization states by the optical components on the optical path and specimen itself from the surface to the foci should be considered. Especially, such a high numerical aperture objective lens like we used here is known to perturb the polarization state of the incident light beam [23]. According to the SHG images acquired in this study (Figures 4–6), orientations of collagen fibers were distinguished in the entire FOV. Thus, effects of the depolarizations seemed to be negligible and/or homogeneous in our measurement. However, for more precise analysis, evaluations of depolarizations depending on the lateral position of focal plane may be necessary. Moreover, the polarization state of SHG light might not be completely identical with the state of incident light especially in the case of circular polarization, as shown in Figures 4, 5. Although the mechanism of the reversed detections between linearly and circularly polarized light beam irradiation was unclear, Psilodimitrakopoulos et al. reported that polarization of SHG light was elliptical under circularly polarized light beam irradiation, and this ellipticity reflected the characteristic anisotropy parameter of tissues [5]. Unlike the fluorescence shown in Figure 3, such elliptical polarization of SHG light might be more perturbed by optical components in the detection light path, thus resulting in being unidentical with the state of the incident light. Such perturbations may make precise analysis complicated. However, high-speed, relative structural changes can be monitored by using raw image data obtained even from living animals (Figure 6). Therefore, we conclude that the main advantage of our developed method is its potential to analyze in vivo, fast dynamics of biological molecules.
Summary
We developed a novel polarization-resolved imaging methodology based on the TPM-SD system. The developed system enabled high-speed SHG imaging of living tissue and revealed the structural orientation of collagen fibers. The uncomplicated addition of the polarizing beam splitter cube into the image splitting optical unit made the measurements possible. This technique will enable monitoring of the distribution of biological molecular orientations responding to intracellular dynamics with a superior temporal resolution.
Author Contributions
KO and TN designed the project. AG and KO conducted the experiments and image acquisitions. KO and TN wrote the manuscript. All authors reviewed the manuscript.
Funding
This work was supported by JSPS KAKENHI Grants Numbers 18K06591, JP15H05953 Resonance Bio and JP16H06280 Advanced Bioimaging Support of the Ministry of Education, Culture, Sports, Science, and Technology (MEXT) Japan; by the Nano-Macro Materials, Devices, and System Research Alliance (MEXT); by the Network Joint Research Center for Materials and Devices (MEXT); and by the Brain Mapping by Integrated Neurotechnologies for Disease Studies (AMED).
Conflict of Interest Statement
The authors declare that the research was conducted in the absence of any commercial or financial relationships that could be construed as a potential conflict of interest.
Acknowledgments
We thank Dr. K. Kobayashi, Dr. M. Tsutsumi, and Prof. Y. Matsuo of the Nikon Imaging Center at Hokkaido University, Dr. K. Iijima, Dr. H. Ishii, and Prof. R. Enoki of the Laboratory of Molecular and Cellular Biophysics in the Research Institute for Electronic Science, Hokkaido University for their helpful advises and technical supports, and Enago (www.enago.jp) for the English language review.
Supplementary Material
The Supplementary Material for this article can be found online at: https://www.frontiersin.org/articles/10.3389/fphy.2019.00056/full#supplementary-material
Figure S1. Reconstructed polarization-resolved SHG image of collagen fibers in a fixed mouse skin sample under irradiation of linearly polarized light. Lateral polarization angles were set to 45°from the horizontal axis of the FOV. The Z-stack (50 μm thick) was taken at 1.0 μm intervals. The upper-middle, lower-middle, and lower images are merged SHG images taken 15, 30, and 45 μm from the specimen surface, respectively. In each sectioned image, the exposure time was 300 ms, the pixel size was 230 nm × 230 nm, and the FOV size was 118 μm × 56 μm (512 pixels × 242 pixels). Scale bars indicate 10 μm length.
References
1. Freund I, Deutsch M. 2nd-harmonic microscopy of biological tissue. Opt Lett. (1986) 11:94–6. doi: 10.1364/OL.11.000094
2. Zipfel WR, Williams RM, Webb WW. Nonlinear magic: multiphoton microscopy in the biosciences. Nat Biotech. (2003) 21:1369–77. doi: 10.1038/nbt899
3. Campagnola PJ, Millard AC, Terasaki M, Hoppe PE, Malone CJ, Mohler WA. Three-dimensional high-resolution second-harmonic generation imaging of endogenous structural proteins in biological tissues. Biophys J. (2002) 82:493–508. doi: 10.1016/S0006-3495(02)75414-3
4. Chen X, Nadiarynkh O, Plotnikov S, Campagnola PJ. Second harmonic generation microscopy for quantitative analysis of collagen fibrillar structure. Nat Protoc. (2012) 7:654–69. doi: 10.1038/nprot.2012.009
5. Psilodimitrakopoulos S, Loza-Alvarez P, Artigas D. Fast monitoring of in-vivo conformational changes in myosin using single scan polarization-SHG microscopy. Biomed Opt Express. (2014) 5:4362–73. doi: 10.1364/BOE.5.004362
6. Mazumder N, Deka G, Wu W-W, Gogoi A, Zhuo G-Y, Kao F-J. Polarization resolved second harmonic microscopy. Methods. (2017) 128:105–18. doi: 10.1016/j.ymeth.2017.06.012
7. Campagnola P. Second harmonic generation imaging microscopy: applications to diseases diagnostics. Anal Chem. (2011) 83:3224–31. doi: 10.1021/ac1032325
8. Rouède D, Bellanger J-J, Schaub E, Recher G, Tiaho F. Theoretical and experimental SHG angular intensity patterns from healthy and proteolysed muscles. Biophys J. (2013) 104:1959–68. doi: 10.1016/j.bpj.2013.02.047
9. Aït-Belkacem D, Guilbert M, Roche M, Duboisset J, Ferrand P, Sockalingum G, et al. Microscopic structural study of collagen aging in isolated fibrils using polarized second harmonic generation. J Biomed Opt. (2012) 17:080506. doi: 10.1117/1.JBO.17.8.080506
10. Denk W, Strickler JH, Webb WW. Two-photon laser scanning fluorescence microscopy. Science. (1990) 248:73–6. doi: 10.1126/science.2321027
11. Bewensdorf J, Egner A, Hell SW. Handbook of Biological Confocal Microscopy. New York, NY: Springer Science + Business Media (2006).
12. Ingaramo M, York AG, Wawrzusin P, Milberg O, Hong A, Weigert R, et al. Two-photon excitation improves multifocal structured illumination microscopy in thick scattering tissue. Proc Natl Acad Sci USA. (2014) 111:5254–9. doi: 10.1073/pnas.1314447111
13. Niesner R, Andresen V, Neumann J, Spiecker H, Gunzer M. The power of single and multibeam two-photon microscopy for high-resolution and high-speed deep tissue and intravital imaging. Biophys J. (2007) 93:2519–29. doi: 10.1529/biophysj.106.102459
14. Andresen V, Pollok K, Rinnenthal JL, Oehme L, Günther R, Spiecker H, et al. High-resolution intravital microscopy. PLoS ONE. (2012) 7:e50915. doi: 10.1371/journal.pone.0050915
15. Shimozawa T, Yamagata K, Kondo T, Hayashi S, Shitamukai A, Konno D, et al. Improving spinning disk confocal microscopy by preventing pinhole cross-talk for intravital imaging. Proc Natl Acad Sci USA. (2013) 110:3399–404. doi: 10.1073/pnas.1216696110
16. Otomo K, Hibi T, Murata T, Watanabe H, Kawakami R, Nakayama H, et al. Multi-point scanning two-photon excitation microscopy by utilizing a high-peak-power 1042-nm laser. Anal Sci. (2015) 31:307–13. doi: 10.2116/analsci.31.307
17. Romijn EI, Finnøy A, Kumer R, Lilledahl MB. Automated calibration and control for polarization-resolved second harmonic generation on commercial microscopes. PLoS ONE. (2018) 13:e0195027. doi: 10.1371/journal.pone.0195027
18. Nemoto T, Kimura R, Ito K, Tachikawa A, Miyashita Y, Iino M, et al. Sequential-replenishment mechanism of exocytosis in pancreatic acini. Nat Cell Biol. (2001) 3:253–58. doi: 10.1038/35060042
19. Vida TA, Emr SC. A new vital stain for visualizing vacuolar membrane dynamics and endocytosis in yeast. J Cell Biol. (1995) 128:779–92. doi: 10.1083/jcb.128.5.779
20. Cox G, Kable E, Jones A, Fraser I, Manconi F, Gorrell MD. 3-Dimensional imaging of collagen using second harmonic generation. J Struct Biol. (2003) 141:53–62. doi: 10.1016/S1047-8477(02)00576-2
21. Kawakami R, Sawada K, Kusama Y, Fang Y-C, Kanazawa S, Kozawa Y, et al. In vivo two-photon imaging of mouse hippocampal neurons in dentate gyrus using a light source based on a high-peak power gainswitched laser diode. Biomed Opt Express. (2015) 6:891–901. doi: 10.1364/BOE.6.000891
22. Truong TV, Supatto W, Koos DS, Choi JM, Fraser SE. Deep and fast live imaging with two-photon scanned light-sheet microscopy. Nat. Methods. (2011) 8:757–60. doi: 10.1038/nmeth.1652
Keywords: second harmonic generation, polarization-resolved optical microscopy, in vivo imaging, collagen, spinning-disk microscopy, two-photon excitation fluorescence microscopy
Citation: Goto A, Otomo K and Nemoto T (2019) Real-Time Polarization-Resolved Imaging of Living Tissues Based on Two-Photon Excitation Spinning-Disk Confocal Microscopy. Front. Phys. 7:56. doi: 10.3389/fphy.2019.00056
Received: 31 January 2019; Accepted: 26 March 2019;
Published: 16 April 2019.
Edited by:
Paolo Bianchini, Istituto Italiano di Tecnologia, ItalyReviewed by:
Raluca Aura Niesner, Freie Universität Berlin, GermanyClaudio Vinegoni, Harvard Medical School, United States
Copyright © 2019 Goto, Otomo and Nemoto. This is an open-access article distributed under the terms of the Creative Commons Attribution License (CC BY). The use, distribution or reproduction in other forums is permitted, provided the original author(s) and the copyright owner(s) are credited and that the original publication in this journal is cited, in accordance with accepted academic practice. No use, distribution or reproduction is permitted which does not comply with these terms.
*Correspondence: Kohei Otomo, b3RvbW9AZXMuaG9rdWRhaS5hYy5qcA==
†These authors have contributed equally to this work
 Ai Goto
 Kohei Otomo
 Tomomi Nemoto1,2