 Alex Kirichek
 Claire Chassagne
 Ranajit Ghose3
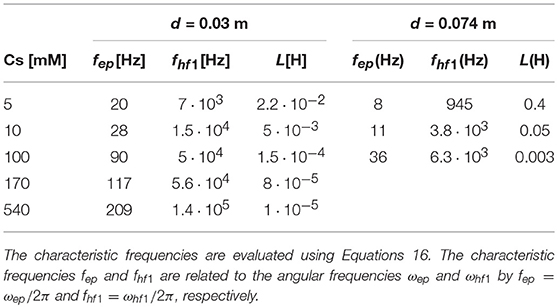

95% of researchers rate our articles as excellent or good
Learn more about the work of our research integrity team to safeguard the quality of each article we publish.
Find out more
ORIGINAL RESEARCH article
Front. Phys. , 08 January 2019
Sec. Chemical Physics and Physical Chemistry
Volume 6 - 2018 | https://doi.org/10.3389/fphy.2018.00148
This article is part of the Research Topic Physics of Porous Media View all 15 articles
4-electrode setups are usually used to measure the dielectric response (complex conductivity) of sandstones, as it is known that 2-electrode systems are sensitive to unwanted electrode polarization at low frequency. Moreover, electrode polarization (EP) occurs in the frequency range where the characteristic relaxation associated to the grain size also occurs, which can therefore theoretically be assessed using 4-electrode setups. Nonetheless, we find that other parameters of interest (porosity, salinity) can easily be extracted from the frequency range ~ 1–10 kHz, beyond the one affected by EP using a 2-electrode setup. An additional unwanted effect (“pseudo-inductance”) is observed in the frequency range 10 kHz–1 MHz during our experiments. Even though the origin of this effect remains unknown, it is shown to be correlated with the ionic strength of the system and the electrode separation. The bulk polarization region, i.e., the region of intermediate frequencies devoid of EP and pseudo-inductance polarizations, is the one of interest, as the complex conductivity of the system is there only dependent on material parameters such as the porosity of the sandstone and the conductivity of the electrolyte. We demonstrate that in the bulk region the model predicts the complex conductivity response, when these porosity and ionic strength are known. The model has been validated using laboratory measurements on a Bentheim sandstone saturated with five different NaCl concentrations: 5, 10, 100, 170, and 540 mM.
Frequency dependent electrical measurements have been widely used during the last decades for environmental and engineering studies [e.g., 1–4]. All these measurements have been typically done using a 4-electrode cell, a measurement technique that is in principle devoid of (unwanted) electrode polarization effect. Numerous laboratory experiments have been conducted to investigate the frequency-dependence of the electrical conductivity of porous rocks, unconsolidated sands and sandstones using 4-electrode setups in the frequency range between 0.01 Hz and 10 MHz [e.g., 1, 5–8]. The electrokinetic polarization response is however difficult to interpret quantitatively due to crosstalks between the 4 electrodes in the frequency range > 1 kHz, dependent on the electrode separation and unwanted interactions between the measuring equipment, electrodes and the sample. For the high frequency range 2-electrode setups are generally used, as they are less sensitive to cross talks in that range [9]. The bulk impedance, i.e., the impedance of the saturated sandstone (devoid of parasitic impedances), can be masked by electromagnetic pseudo-inductance effects which produce inductive loops yielding positive values in the phase spectra at high frequencies. These loops can be triggered by the wiring of the measurement system [10]. Normally, this effect is taken into account during the design of the measurement cell so that its contribution is reduced. Even though crosstalks between electrodes are avoided when 2-electrode systems are used, wiring induced and other unwanted polarizations can still arise as we will demonstrate with our measurements.
Electrode polarization (EP) is the most common electrode/bulk effect reported in the literature for dielectric spectroscopy measurements, which are conducted with 2-electrode systems [11–14]. This phenomenon occurs due to the build-up of ions close to the surface of the electrodes (which are assumed to be perfectly blocking) at low frequencies. As the impedance measurements presented in this article are done with 2-electrode system, EP is dominant in the impedance spectra at low frequencies. Several relaxation frequencies can be observed in the spectra, an important one being associated to the relaxation of the double layer of the grains which occurs at high frequencies [6, 9].
Mechanistic models describing the overlapping of the polarization effects at low and high frequencies are given in Leroy and Revil [15], Jougnot et al., [2], and Okay et al. [16] among others. These models have been successfully used to connect the complex conductivity to the changes in the pore fluid chemistry [e.g., 9, 32, 38]. Recently, we have proposed a new model for the dielectric response of sands and sandstones that in most cases require no adjustable parameters [17]. The model we presented was for dielectric spectra that are not affected by unwanted (parasitic) polarization effects. They were tested using data from literature that were obtained with 4-electrode setups, and the mismatches found between models and experimental data were attributed to the unwanted polarization effects generated from the measuring equipment.
In the present article, we will show that the model can be adapted to account for unwanted polarization effects in the case of 2-electrode systems. Unlike 4-electrode setups, 2-electrode setups have the advantage to be less sensitive to crosstalks in the frequency range > kHz. We will show that in a given frequency range, (1–10 kHz), the impedance of the saturated sandstone (devoid of parasitic impedances) can be obtained and that 2-electrode measurements are reliable. For higher frequencies, we found that an unwanted pseudo-inductance affected our measurements. This pseudo-inductance was also accounted for in the model.
The dielectric spectroscopy measurements presented in this article were performed using a 2-electrode system on fully saturated sandstones in the frequency range 20 Hz–3 MHz, where EP, bulk polarization (the polarization of the saturated sandstone) and pseudo-inductance effects are present. We compare the data with the response of an equivalent circuit model that is built as a sum of three complex impedances. Two of these impedances are directly linked to the theoretical complex conductivities of EP and bulk, and are, therefore only dependent on the system parameters (fluid, grain and electrode properties). The last impedance is introduced to model the pseudo-inductance effect measured at high frequencies. This impedance is a function of one adjustable parameter. Frequency ranges where one of the polarization effects (EP, bulk or pseudo-inductance) is dominant will be mathematically defined from the analysis of the full equivalent circuit expression. The theoretical range corresponding to the dominance of the bulk polarization will be compared to the experimental one.
This paper consists of four sections. In the first section we formulate theoretical descriptions of electrode polarization, bulk polarization, and pseudo-inductance complex conductivities as functions of the system parameters, i.e., porosity, conductivity and dielectric permittivity of water and grains. The model is compared with other models available in literature. In the second section we give an equivalent circuit model, for which the circuit elements can be identified with the complex conductivities found in the first section. In the third section a short overview of the laboratory experimental setup, which is used to measure the dielectric spectroscopy of reservoir rock that is saturated with NaCl solution, is given. Finally, in the fourth section we test the new model by predicting the desired bulk properties from the measured electrokinetic response of a fully saturated reservoir rock for 5 different NaCl solution concentrations.
In Kirichek et al. [17], we show (see Equation 8 in that article) that the complex conductivity of the bulk, , can be expressed using the Maxwell-Wagner model as
where σb(ω) and εb(ω) are, respectively, the conductivity and relative dielectric permittivity of the bulk, ω is the angular frequency, ε0 is the permittivity of vacuum, , σe is the conductivity of electrolyte, εe is the relative dielectric permittivity of electrolyte. Note that σb(ω) and εb(ω) are frequency dependent whereas σe and εe are not in the frequency range of interest, i.e., < GHz. Furthermore, ϕ is the porosity, β*(ω) is the dipolar coefficient that is linked to the polarization P(ω) of a grain and its double layer by . E0(ω) is the electrical field that is applied on the porous media and the polarizability, α*(ω), is given by: , where a is the radius of a grain.
For an electrolyte (with no grains) ϕ = 1, and one gets , as expected. One can show that the dipolar coefficient β*(ω) of a spherical grain with complex conductivity immersed in an electrolyte of conductivity can be written as [17, 18]:
where , εg being the relative dielectric permittivity of the grains. For silica grains, we take εg≈4.5 [19]. This expression for β*(ω) is based on the hypothesis that the polarization of the double layer is negligible compared to the polarization of the core of the grain. This hypothesis is valid for κa>>1, where κ−1 is the Debye length given in Equation 6, and moderate zeta potentials [18]. We showed in Kirichek et al. [17] how the corresponding parameter, the Dukhin number influences the expression for β*(ω) and hence the complex conductivity of sands and sandstones. The Dukhin number reads
where e is the elementary charge, ζ is the zeta potential, k the Boltzmann constant and T the temperature. In our case, we can estimate that on an average κa~104≫1, where the inverse of the Debye length, κ is defined in Equation 6. The Dukhin number is therefore small, which implies that the grain bulk polarization will dominate the total (grain and double layer) polarization. In the case of small charged grains, there are models which take into account the electric double layer polarization, and even account for additional layers, like Stern layers [17, 18], in the evaluation of β*(ω), see also the Appendix of the present article.
The conductivity of the electrolyte σe can be evaluated by:
where Di is the diffusion constant of ion i, zi is the valency of ion i, νi are stoichiometric coefficients, kB is the Boltzman constant, T is temperature, and n∞ is the ionic density. The latter is given by
with Cs and Na being the salt concentration and the Avogadro constant, respectively. The Debye length κ−1 is a measure for the electric double layer thickness. It can be calculated using
Substituting Equation 6 in Equation 4 and using the electroneutrality relation ∑νizi = 0 leads to
In this work we consider NaCl solution as the pore-filling electrolyte. Hence, we assume the following: D+ ≈ D− ≈ 2·10−9 m2/s, z+ = −z− = ν+ = ν− = 1.
Electrode polarization (EP) is observed at low frequencies in a 2-electrode measurement system and arises due to ion build-up close to the surface of the electrodes, as both electrodes are considered to be blocking. This effect is associated with a characteristic frequency ωep, which is defined as [11, 14]
where d is the distance between the electrodes. We found that EP is indeed shifted to higher frequencies in our experiments, in accordance with Equation 8, as the ionic strength is increased and/or d is diminished.
In this article, Cs is in the range 5–540 mM, and two electrodes separations are used: d = 0.03 m and d = 0.074 m. The characteristic frequency for the EP effect is, thus, in the frequency range below 1 kHz (from Equation 8). EP complex conductivity can also be derived from the set of electrokinetic equations presented in Buck [11] and Chassagne et al. [14]. The expression for EP reads
For electrolyte solutions (no porous media), εep = εe. In the case of two-phase systems, such as suspensions or porous media made of electrolyte and grains, it remains to be investigated if εep = εe or εep(ω) = εb(ω) [14], where εb(ω) is the dielectric permittivity of the two-phase system that is connected to the bulk conductivity (Equation 1).
Our dielectric spectroscopy experiments (see Figure 4) show that the electrical impedance has a positive phase in the frequency range [10 kHz–1 MHz]. A positive phase is usually the signature of the presence of parasitic inductors due to the proximity of wires in electric circuits. Therefore, we call this effect “pseudo-inductance.” We have observed that the characteristic frequency of this polarization depends on the electrode separation d, and its magnitude depends on the ionic strength. The pseudo-inductance complex conductivity is not modeled using first principles as is done for EP and bulk polarizations. We show in the next section how we account for it by using the concept of equivalent circuits.
Traditionally, dielectric spectroscopy measurements have been analyzed by means of equivalent electrical circuits. The classical equivalent circuit approach is based on the use of simple R, C, L elements. It has been shown explicitly that two-phase systems can also be modeled by equivalent circuits, where each circuit element can be linked to a theoretical complex conductivity, as defined in the previous section [14].
We looked for the same type of equivalence when setting up our full model. We wanted each polarization to be identifiable as a separate impedance in series with the others. This constraint led us to the equivalent circuits which are illustrated in Figure 1. The total impedance of the system is represented by:
where Zep and Zb are the electrical impedances that arise from electrode and bulk polarizations, respectively. Zhf accounts for the pseudo-inductance effect observed at high frequencies.
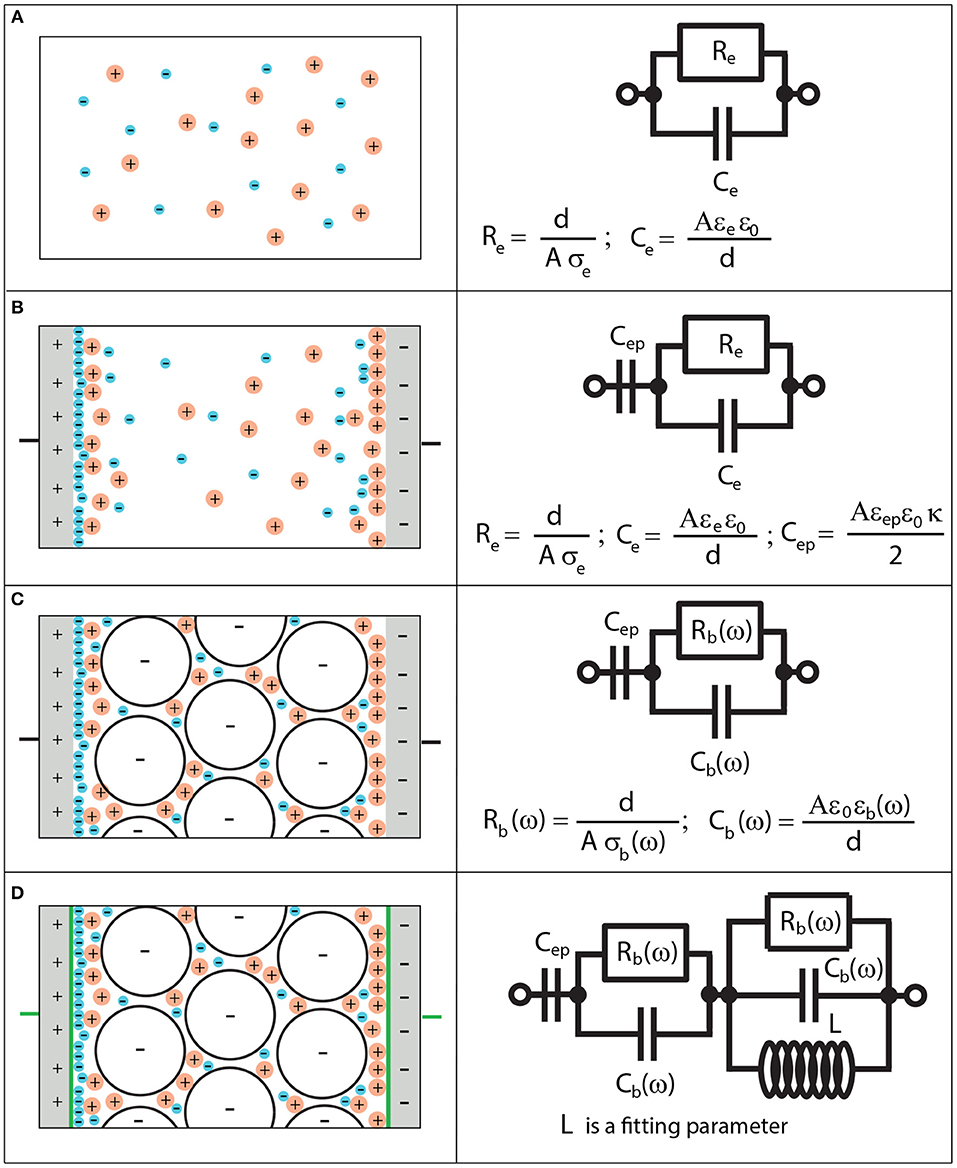
Figure 1. Equivalent circuit representation of the measured electrical impedance. (A) Equivalent circuit representation for an electrolyte solution. Re and Ce are resistance and capacitance of the electrolyte, A is the area of the electrode, d is the distance between the electrodes, ε0 is the permittivity of vacuum, σe and εe are electrical conductivity and permittivity of an electrolyte, respectively. (B) Equivalent circuit representation for an electrolyte solution with electrode polarization. Cep is the capacitance of electrode polarization, εep is the permittivity of electrode polarization and κ−1 is the electric double layer thickness. (C) Equivalent circuit representation for an electrolyte saturated sandstone with electrode polarization. Rb(ω) and Cb(ω) are resistance and capacitance of the bulk, σb(ω) and εb(ω) are electrical conductivity and permittivity of the bulk, respectively. (D) Equivalent circuit representation for a bulk in presence of electrode polarization and pseudo-inductance. L is used as a fitting parameter.
The complex electrical conductivity and complex electrical impedance are linked by
where A is the area of an electrode, d is the distance between the electrodes, and k = theo, b, hf or ep. The ratio d/A is called the cell constant.
For a simple electrolyte solution illustrated in Figure 1A, one can show that
where Re and Ce are linked to σe and εe by
respectively. Note that, in this case, EP is not accounted for. Therefore, this equivalent circuit is valid for ω>ωep. In order to account for EP, one should consider Figure 1B [11], where the complex electrical conductivity of EP is connected to the EP impedance by:
The capacitance is given by Cep = Aκεepε0/2 and the impedance corresponding to EP and bulk polarization of the electrolyte is given by Ztheo = Zep+Ze. The frequency range of validity is now in principle [mHz–MHz].
When the electrolyte solution is replaced by a suspension or a porous medium, the equivalence can still be considered valid [14, 17], but the circuit elements are then frequency-dependent so that Rb(ω) and Cb(ω) have the dimension of resistance and capacitance, but cannot actually be substituted by real resistance and capacitance as in traditional equivalent circuits. They are given by
This case is shown in Figure 1C, where Ztheo = Zep+Zb. The frequency range of validity in this case is in principle [mHz–MHz]. When ϕ = 1 (only electrolyte), we get and Zb = Ze. In this case, the equivalent circuit reduces to the one given in Figure 1B.
The equivalent circuit presented in Figure 1C is valid in order to fit the data in the frequency range [mHz–≈ 10 kHz], as will be shown in the experiment section (Section 4). We found a pseudo-inductance signature in the impedance spectra for frequencies higher than 10 kHz. In order to account for the pseudo-inductance occurring at higher frequencies, the equivalent circuit presented in Figure 1D is used. Using the equivalent circuit, where Ztheo = Zep+Zb+Zhf, the data can be modeled for the whole frequency range [mHz– MHz]. At higher frequencies, the dielectric relaxation of water occurs [20], which is not accounted for in the present model. From the circuit element analysis, one finds the following characteristic frequencies:
The frequency ωep corresponds to the characteristic frequency associated to EP, below which charges can fully build-up a double layer close to the blocking electrodes. Above ωep, EP effects can be considered to be negligible. The frequency ωhf1 corresponds to the frequency above which pseudo-inductance effects can affect the electrokinetic response. For extremely large L there is no pseudo-inductance effect, the frequencies ωhf1 and ωhf2 tend to infinity, and Zhf can be represented by a wire. The equivalent circuit shown in Figure 1D then reduces to the one shown in Figure 1C for the frequency range [ωep−ω0]. The frequency ωhf2 corresponds to the frequency where the charges cannot totally be dissipated in the system start to play a role. Above ω0 (the Maxwell-Wagner frequency) no double layer can be established at the electrodes and the double layers around the grains cannot polarize anymore. Below ω0 one can verify using Equations 1, 2, and 15, that Rb and Cb are in good approximation constant as function of frequency as we are in the special case where the Dukhin number, Equation 3, is small (large κa and moderate zeta potentials). This is why we could define proper characteristic frequencies in Equations 16 using Rb and Cb. In these definitions, we imply that we take the values of Rb and Cb below ω0. The same holds for Table 1 and Table A1 (see Appendix) where the value for Rb is the value of Rb below ω0. For larger Dukhin numbers, Rb and Cb become frequency-dependent below ω0, but it is then also possible to define characteristic frequencies [14]. One can then find the approximations for the amplitude and phase in each frequency domain given in Table 1. An example is given in Figure 2. The individual contributions of Zep, Zb, and Zhf to Ztheo are indicated in color. An alternative equivalent circuit is given and discussed in the Appendix.
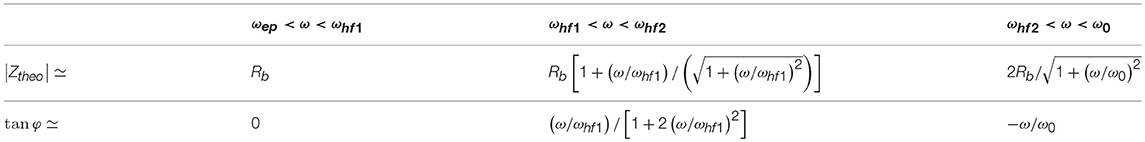
Table 1. Evolution of the amplitude |Ztheo| and phase φ as function of the applied electric field frequency ω for the equivalent circuit presented in Figure 1D.
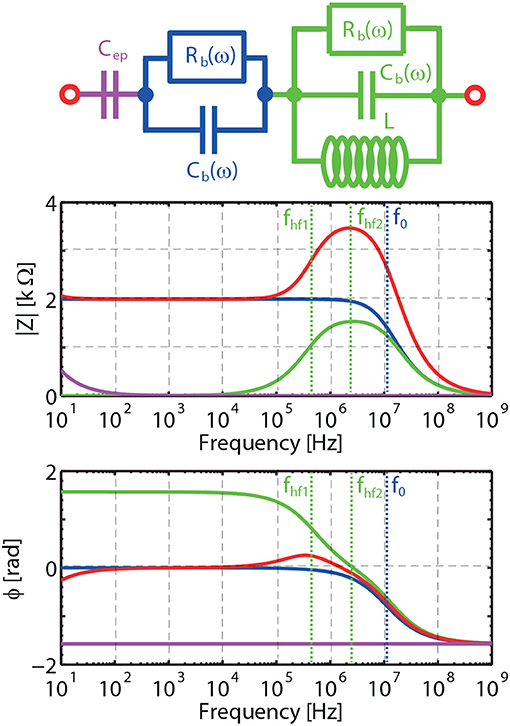
Figure 2. Predicted magnitude |Z| and phase φ of the electrical impedance of a sandstone saturated with a 50 mM NaCl electrolyte, including the effects of EP, bulk polarization and pseudo-inductance with L = 5·10−4 H, that is representative for our measurements. The individual contributions of Zep (magenta line), Zb (blue line) and Zhf (green line) to Ztheo (red line). fhf1, fhf2 and f0 are characteristic frequencies.
Most models used in geophysics concentrate on the bulk polarization [e.g., 23, 27, 33, 37] as these authors use 4-electrode cells, for which EP effects are in theory avoided. 4-electrode cells are in fact not devoid of parasitic impedances due to cross-talks between the electrodes and some EP effects have been measured [e.g., 28, 34]. Moreover, 4-electrode systems and its additional electronics (as compared to 4-electrode systems) is in general less suitable for high frequencies. In their measurements, done using both 4 and 2 electrodes on a Berea sandstone saturated with NaCl, [9] found a good overlap between the two devices in the frequency range [102–103] Hz. The 4-electrode setup was used in the frequency range [10−3–103] Hz, whereas the 2-electrode cell was used in the frequency range [102–106] Hz. The relaxation frequencies associated to the electrolyte saturated sandstone are linked to its characteristic length scales. One of this length scale is the double layer thickness κ−1 and depending on ionic strength the associated characteristic frequency ω0 is of the order of [105–109] Hz a frequency range best probed using a 2-electrode device. The other length scale is the characteristic of a sandstone grain size, a, and the associated frequency is given by [14], which gives values of the order of 1–500 Hz for micrometric particles. This frequency range is therefore best probed by 4-electrode cells in principle. However, as stated above, EP can also contaminate the signal of 4-electrode devices, as such low frequencies and interpretation of data at these frequencies can be complicated [17, 21].
Some authors using 2-electrode cells try to mathematically “clean” the measured signal for EP [22]. A discussion about how to compensate for EP can be found in Chassagne et al. [14]. Experimental evidence however shows that even though it is theoretically possible to compensate for EP, in practice it is very difficult due to the non-ideality of the electrodes. In the present article we explicitly define the frequency range where the bulk properties of the system can be obtained without any correction.
Regarding the modeling of this bulk polarization part, different formulations for the related complex conductivity have been presented in the literature. A review has been provided by Chelidze et al. [23]. There has been some debate in literature regarding the origin of the low-frequency polarization (see Scott 24 for a review), which corresponds, in our terminology, to the frequency range below ω0, where the double layers around charged grains can still polarize under the action of the electric field. It has been argued by some authors [e.g., [25]] that so-called membrane polarization could be causing this effect. Membrane polarization is caused in a pore constriction (pore throat), where ions in the pore fluid can encounter resistance to their movement, causing charge buildup. The first reference to membrane polarization is to be found in Marshall and Madden [26], where Marshall and Madden explicitly state that the conductive grains i.e., metallic particles within the rock are responsible for this phenomenon. Due to the voltage gradient in the vicinity of the conductive grains, a charge build-up can be created close to the conductive grains (much like what happens close to the electrodes) and electric double layers can be established. This is quite similar to what happens close to the surface of charged grains (with a dielectric core) which have electric double layers when they are in contact with an electrolyte. When grains are very close it is possible that their double layers overlap and it is argued that this might be the reason for the restriction in the pore throat (the pore throat being the space between the two grains). As discussed in Scott [24], and as the reader can verify from Equation 6, the size of the double layer for most systems is generally in the nm range, much smaller than the average pore throat. Most rocks formed by grains (like sandstones) are well interconnected pores, see Sen et al. [27] for a discussion. In fact, from simple mathematical consideration, a pile of grains can be seen as having (average) pore throats of the order of a grain diameter. It is, therefore, not surprising that the effective-medium approach based on a collection of grains is giving good results, as for large grains and any ionic strength κa≫1 any grain's double layer can polarize without being affected by a neighboring one. In Kirichek et al. [17], we moreover showed that the effective medium approach, as originally proposed by Maxwell-Wagner and Bruggeman, can be modified so as to include surface conductivities without the use of approximations (large κa, large ζ), which lead to formulations comparable to Equation 48 in Chelidze et al. [23]. In the present article, as discussed above, surface conduction due to the polarization of the grain double layer is negligible and our expression reduces to the self-similar model presented in Sen et al. [27], see their Equation 5.
We will show in the next section how our equivalent circuit model adequately reproduce our measured data for the whole range of frequencies investigated and how indeed the bulk polarization part can be estimated without any adjustable parameter in a well-defined frequency range.
A simplified sketch of the experimental setup is shown in Figure 3. The relatively high porosity (21.8%) and grain diameter (0.1–0.3 mm) of Bentheim sandstone makes it a good testing material for the core-flooding experiments. The sample is encased in a silicone sleeve and placed in a stainless steel core holder. An insulating silicon rubber is used as a material for the sleeve. Thus, current leakages from the system to the core holder can be disregarded. A temperature-controlled oven is used to reproduce realistic reservoir conditions of temperature and to eliminate complication of data analysis due to fluctuations in the external temperature.
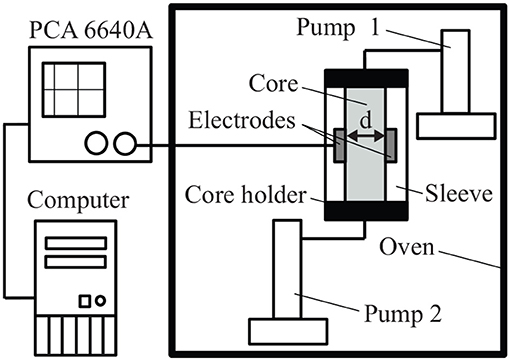
Figure 3. Sketch of the experimental setup. Wayne Kerr Precision Component Analyser 6640A (PCA 6640A) is used to measure |Z| and φ at the frequency range 20 Hz–3 MHz.
Each end of the core holder contains a port for fluid injection. The sandstone is fully saturated with NaCl solution before each experiment.
A Wayne Kerr Precision Component Analyser 6640A is used as the impedance measuring system. Coaxial cables connect the measuring device to the electrodes, which are directly attached to the lateral surface of the core on diametrically opposite sides. We use a 2-terminal electrode system in this study. Both electrodes act as current and potential terminals. Residual stray impedances were filtered out using a standard open/short/load calibration [28]. The measurements of magnitude |Z| and phase φ of the electrical impedance are conducted over the frequency range 20 Hz–3 MHz. The electrical conductivity σ*(ω) is converted from the measured |Z| and φ from
We have conducted two sets of experiments. For the first set, we use a NaCl solution with Cs = 5, 10, 100, 170, and 540 mM. The distance between the electrodes d = 0.03 m and the area is A = 0.01 × 0.05 m2. For the second set of experiments, NaCl solutions with Cs = 5, 10, and 100 mM are used. For this case, the parameters are d = 0.074 m and A = 0.01 × 0.025 m2. Other parameters are the relative permittivity of water εe = 80, the relative permittivity of the sandstone εb = 4.5, the temperature is T = 25 degrees C.
The dielectric response of the reservoir rock filled with NaCl solutions of various salinities is shown in Figures 4, 5. A frequency region can be identified, where the contribution of the (desired) bulk polarization is dominant. For our measured data, this is [≈ 10 ωep–ωhf1], as can be seen from comparing the regions where the bulk impedance is overlapping the total impedance in Figures 4, 5 and the values given in Table 2. This implies that within this frequency range the relevant parameters (porosity, salinity) can be extracted. In our case, both the porosity of the sandstone and the salinity of pore-filling electrolyte are known. Hence, the bulk polarization could be predicted with no adjustable parameters.
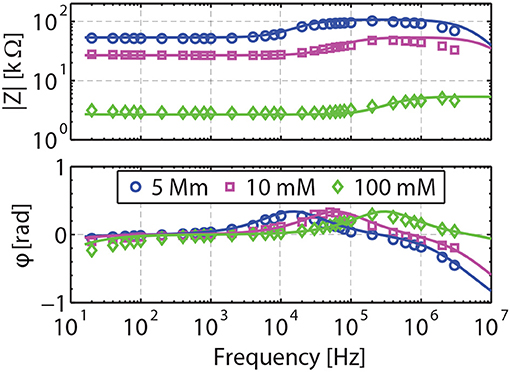
Figure 4. Validation of the model for d = 0.074 m. Measured impedances are shown in symbols for NaCl concentration of 5, 10, and 100 mM. The full model is shown by the solid lines. Only the inductance L is fitted to match the pseudo-inductance response measured at ω>10 kHz. The response of the bulk (1–10 kHz) is obtained with no adjustable parameter, as in particular both porosity and salinity are known.
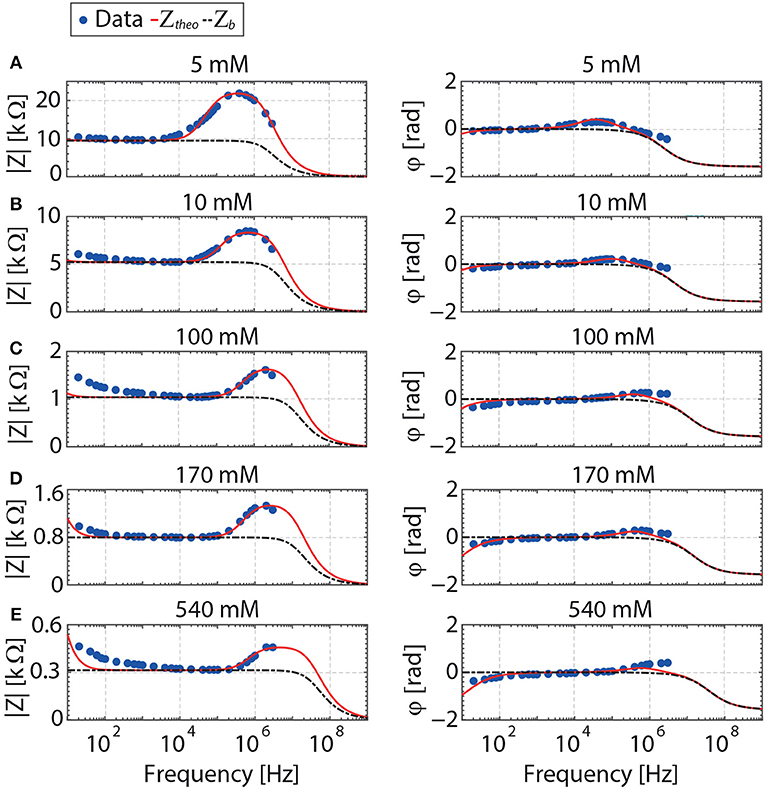
Figure 5. Contribution of the bulk polarization (black line) to the total impedance (red line) of a fully saturated reservoir rock. The model for the impedance is given in Figure 1. No adjustable parameter is used to generate the bulk impedance. Measured impedances are shown in symbols for NaCl concentrations of 5, 10, 100, 170, and 540 mM. The electrode separation is 0.03 m.
The characteristic frequency of EP, ωep is increasing with salinity in accordance with Equation 8. In Chassagne et al. [14] the question was raised whether, in estimating Cep, one should take εep = Cep/(Aκε0) = εe or εb. We find that εep(ω)≃εb(ω) in the whole range of the considered salinity. This implies that the grains close to the electrodes certainly contribute to EP.
From Figure 5 and the values given in Table 2, one realizes that the frequency range where EP is dominant [mHz–ωep] is underestimated. The frequency region where the bulk polarization is dominant is on average starting above ≈ 10 ωep. The estimated value of ωep is based on the assumption that the electrodes are perfectly blocking and that the contact between these electrodes and the porous sandstone is ideal (the electrodes are not porous and extremely clean). In practice a discrepancy between theory and experiment is always observed when studying electrode polarization as these conditions are never met. Taking ≈ 10ωep as an estimation from the characteristic frequency above which EP is negligible is found to be appropriate for the large range of salinity studied for the shortest electrode separation used (d = 0.03 m). For the larger electrode separation, d = 0.074 m, (see Figure 4), EP is barely affecting the measurements as ωep is found to be very low (see Table 2).
The effect of electrode separation is better illustrated in Figure 6, where the data is plotted in terms of conductivity in order to avoid the cell constant (d/A) dependence of the impedance. For ωep≪ω < ωhf1, we have Ztheo = Zb, and no adjustable parameters are required to predict the measured impedance.
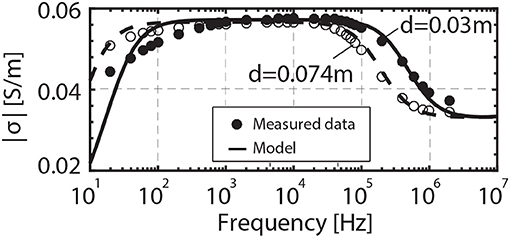
Figure 6. Electrical conductivity spectrum of the porous rock saturated with 100 mM NaCl solution for electrode separation of 0.074 and 0.03 m.
The fact that the phase becomes positive in the frequency range [ωhf1– ωhf2] indicates the development of an inductive effect in the system. There are several possible explanations for the origin of this phenomenon. Inductive loops can be generated by a chemical reaction between electrode and electrolyte, e.g., oxidation of the electrodes [10]. Another trigger for inductive loops can be due to inductive connecting cables [10]. In this case the inductance signatures occur at high frequencies in the impedance spectrum. The coaxial cables used in the present study were perfectly shielded, so we do not expect they create a parasitic inductance. Fleig et al. [29] suggests that inductive loops can be induced in the impedance spectra at high frequencies due to the capacitive leakage to the ground. Since the measurement system used in this study is grounded, the occurrence of this artifact is highly unlikely.
Other authors [e.g., 30, 36] found a pseudo-inductance by measuring electrolyte solutions using 4-electrode setups. Zimmermann et al. [30] refers to this phenomenon as “contact impedance,” and attributed it to a phase error due to the inhomogeneous contact impedance of the current electrodes. They found that the pseudo-inductance depends on the nature of the electrodes used. The surface properties of the electrodes (roughness, contamination) could, therefore, play a major role in the pseudo-inductance effect. An alternative possibility is proposed in the Appendix. We there demonstrate that the contribution of a Stern layer around the grains can generate pseudo-inductance effects. The demonstration is only theoretical as there is no proof that such contribution is present in the system we have investigated.
We have demonstrated that the dielectric response of a porous sandstone saturated with NaCl solutions of different concentrations measured with a 2-electrode setup can correctly be modeled using the theory presented in this article. The model accounts for 3 distinct polarization phenomena: electrode polarization, bulk polarization, and pseudo-inductance effect, that all three were found in our experiments. Different characteristic frequencies (ωep, ωhf1, ω0, and ωhf2) were defined, see Equations 16. Each frequency range was studied theoretically to find its dominant polarization mechanism. A suitable frequency range was identified [≈ 10 ωep–ωhf1] in our experiments, where the bulk polarization is the dominant part of the measured impedance. As both the porosity of the sandstone and the salinity of the pore fluid were known in our system, no adjustable parameter was required to predict the complex impedance response in the bulk polarization region. A good match was found between the predictions and measurements for a large range of ionic strengths and two different setups.
AK wrote the article, performed the experiments and analyzed the data. CC developed the theory and helped with the writing. RG was the formal supervisor of AK during his Ph.D.
The authors declare that the research was conducted in the absence of any commercial or financial relationships that could be construed as a potential conflict of interest.
This research has been carried out in the context of the CATO2 program with grant number FES10036GXDU. CATO2 was the Dutch National Research Program on Carbon Capture and Storage (CCS) Technology. The program was financially supported by the Dutch Government (Ministry of Economic Affairs) and the CATO2 consortium parties. Part of the work presented here was published in the Ph.D. thesis of AK [31]. We thank Karel Heller for his help in the laboratory.
The Supplementary Material for this article can be found online at: https://www.frontiersin.org/articles/10.3389/fphy.2018.00148/full#supplementary-material
1. Slater LD, Glaser DR. Controls on induced polarization in sandy unconsolidated sediments and application to aquifer characterization. Geophysics (2003) 68:1547–88. doi: 10.1190/1.1620628
2. Jougnot D, Ghorbani A, Revil A, Leroy P, Cosenza P. Spectral induced polarization of partially saturated clay-rocks: a mechanistic approach. Geophys J Int. (2010) 180:210–24. doi: 10.1111/j.1365-246X.2009.04426.x
3. Revil A, Karaoulis M, Johnson T, Kemna A. Review: some low-frequency electrical methods for subsurface characterization and monitoring in hydrogeology. Hydrogeol J. (2012) 20:617–58. doi: 10.1007/s10040-011-0819-x
4. Kemna A, Binley A, Cassiani G, Niederleithinger E, Revil A, Slater L, et al. An overview of the spectral induced polarization method for near-surface applications. N Surf Geoph. (2012) 10:453–68. doi: 10.3997/1873-0604.2012027
5. Knight RJ. Hysteresis in the electrical resistivity of partially saturated sandstones. Geophysics (1991) 56:2139–47. doi: 10.1190/1.1443028
6. Garrouch AA, Sharma MM. The influence of clay content, salinity, stress, and wettability on the dielectric properties of brine-saturated rocks: 10 Hz to 10 MHz. Geophysics (1994) 59:909–17. doi: 10.1190/1.1443650
7. Ulrich C, Slater LD. Induced polarization measurements on unsaturated, unconsolidated sands. Geophysics (2004) 69:762–71. doi: 10.1190/1.1759462
8. Binley A, Slater LD, Fukes M, Cassiani G. Relationship between spectral induced polarization and hydraulic properties of saturated and unsaturated sandstone, Water Resour Res. (2005) 41:W12417. doi: 10.1029/2005WR004202
9. Lesmes DP, Frye KM. Influence of pore fluid chemistry on the complex conductivity and induced polarization responses of Berea sandstone. J Geophys Res. (2001) 106:4079–90. doi: 10.1029/2000JB900392
11. Buck RP. Diffuse layer charge relaxation at the ideally polarized electrode. J Electroanal Chem. (1969) 23:219–40. doi: 10.1016/S0022-0728(69)80212-3
12. Scheider W. Theory of the frequency dispersion of electrode polarization. topology of networks with ractional power frequency dependence. J Phys Chem. (1975) 79:127–36. doi: 10.1021/j100569a008
13. Volkmann J, Klitzsch N. Wideband impedance spectroscopy from 1 mHz to 10 MHz by combination of four- and two-electrode methods. J Appl Geophs. (2015) 114:191–201. doi: 10.1016/j.jappgeo.2015.01.012
14. Chassagne C, Dubois E, Jimenez ML, van der Ploeg JPM, van Turnhout J. Compensating for electrode polarization in dielectric spectroscopy studies of colloidal suspensions: theoretical assessment of existing methods. Front Chem. (2016) 4:30. doi: 10.3389/fchem.2016.00030
15. Leroy P, Revil A. A mechanistic model for the spectral induced polarization of clay materials. J Geophys Res. (2009) 114:1–21. doi: 10.1029/2008JB006114
16. Okay G, Leroy P, Ghorbani A, Cosenza P, Camerlynck C, Cabrera J, et al. Spectral induced polarization of clay-sand mixtures: experiments and modeling. Geophysics (2014) 79:E353–75. doi: 10.1190/geo2013-0347.1
17. Kirichek A, Chassagne C, Ghose R. Dielectric spectroscopy of granular material in an electrolyte solution of any ionic strength. Coll Surf A (2017) 533:356–70. doi: 10.1016/j.colsurfa.2017.07.040
18. Chassagne C, Bedeaux D. The dielectric response of a colloidal spheroid. J Coll Interf Sci. (2008) 326:240–53. doi: 10.1016/j.jcis.2008.06.055
19. Kirichek A, Ghose R, Heller HKJ. Laboratory monitoring of CO2 migration and phase transition using complex electrical conductivity. In: 75th EAGE Conference and Exhibition Incorporating SPE EUROPEC 2013 London (2013).
20. Ngai KL. Interpretation of the ghz to thz dielectric relaxation dynamics of water in the framework of the coupling model. J Mol Liq. (2018) 253:113–18. doi: 10.1016/j.molliq.2018.01.039
21. Niu Q, Revil A, Saidian M. Salinity dependence of the complex surface conductivity of the portland sandstone. Geophysics (2016) 81:D125–14. doi: 10.1190/geo2015-0426.1
22. Prodan C, Bot C. Correcting the polarization effect in very low frequency dielectric spectroscopy. J Phys D Appl Phys. (2009) 42:175505. doi: 10.1088/0022-3727/42/17/175505
23. Chelidze T, Gueguen Y. Electrical spectroscopy of porous rocks: a review - I. Theoretical models. Geoph J Int. (1999) 137:1–15. doi: 10.1046/j.1365-246x.1999.00799.x
24. Scott JBT. The origin of the observed low-frequency electrical polarization in sandstones. Geo phys. (2006) 72:G235–8. doi: 10.1190/1.2258092
25. Titov K, Komarov V, Tarasov V, Levitski A. Theoretical and experimental study of time domain-induced polarization in water-saturated sands. J Appl Geophs. (2002) 50:417–33. doi: 10.1016/S0926-9851(02)00168-4
26. Marshall DJ, Madden TR. Induced polarization, a study of its causes. Geophysics (1959) 24:790–816. doi: 10.1190/1.1438659
27. Sen PN, Scala C, Cohen MH. A self-similar model for sedimentary rocks with application to the dielectric constant of fused glass beads. Geophysics (1981) 46:781–95. doi: 10.1190/1.1441215
28. Lvovich VF. Impedance Spectroscopy: Applications to Electrochemical and Dielectric Phenomena. New York, NY: John Wiley and Sons (2012).
29. Fleig J, Jamnik J, Maier J. Inductive loops in impedance spectroscopy caused by electrical shielding. J Electrochem Soc. (1996) 143:3636–41. doi: 10.1149/1.1837263
30. Zimmermann E, Kemna A, Berwix J, Glaas W, Münch HM, Huisman JA. A high-accuracy impedance spectrometer for measuring sediments with low polarizability. Meas Sci Technol. (2008) 19:105603. doi: 10.1088/0957-0233/19/10/105603
31. Kirichek A. Electrokinetic and poroelastic Characterization of Porous Media: Application to CO2 Storage Monitoring. ISBN: 978-94-6186-902-9 (2018).
32. Schmutz M, Revil A, Vaudelet P, Batzle M, Femenía Viñao P, Werkema DD. Influence of oil saturation upon spectral induced polarization of oil bearing sands. Geophys J Int. (2010) 183:211–24. doi: 10.1111/j.1365-246X.2010.04751.x
33. Vinegar HJ, Waxman MH. Induced polarization of shaly sands. Geophysics (1984) 49:1267–87. doi: 10.1190/1.1441755
34. Mazzeo BA. Parasitic capacitance influence of potential-sensing electrodes on four-electrode liquid impedance measurements. J Appl Phys. (2009) 105:094106. doi: 10.1063/1.3124365
35. Hollingsworth AD, Saville DA. A broad frequency range dielectric spectrometer for colloidal suspensions: cell design, calibration, and validation. J Colloid Interface Sci. (2003) 257:65–76. doi: 10.1016/S0021-9797(02)00029-2
36. Abdulsamad F, Florsch N, Schmutz M, Camerlynck C. Assessing the high frequency behavior of non-polarizable electrodes for spectral induced polarization measurements. J Appl Geophs. (2016) 135:449–55. doi: 10.1016/j.jappgeo.2016.01.001
37. Leroy P, Revil A, Kemna A, Cosenza P, Ghorbani A. Complex conductivity of water-saturated packs of glass beads. J Coll Int Sci. (2008) 321:103–17. doi: 10.1016/j.jcis.2007.12.031
Keywords: dielectric spectroscopy, sandstone, electrode polarization, 2-electrode setup, impedance
Citation: Kirichek A, Chassagne C and Ghose R (2019) Predicting the Dielectric Response of Saturated Sandstones Using a 2-electrode Measuring System. Front. Phys. 6:148. doi: 10.3389/fphy.2018.00148
Received: 24 October 2018; Accepted: 05 December 2018;
Published: 08 January 2019.
Edited by:
Dick Bedeaux, Norwegian University of Science and Technology, NorwayReviewed by:
Siddharth Surajbhan Gautam, The Ohio State University, United StatesCopyright © 2019 Kirichek, Chassagne and Ghose. This is an open-access article distributed under the terms of the Creative Commons Attribution License (CC BY). The use, distribution or reproduction in other forums is permitted, provided the original author(s) and the copyright owner(s) are credited and that the original publication in this journal is cited, in accordance with accepted academic practice. No use, distribution or reproduction is permitted which does not comply with these terms.
*Correspondence: Alex Kirichek, YWxleC5raXJpY2hla0BkZWx0YXJlcy5ubA==
Disclaimer: All claims expressed in this article are solely those of the authors and do not necessarily represent those of their affiliated organizations, or those of the publisher, the editors and the reviewers. Any product that may be evaluated in this article or claim that may be made by its manufacturer is not guaranteed or endorsed by the publisher.
Research integrity at Frontiers
Learn more about the work of our research integrity team to safeguard the quality of each article we publish.